
|
|||||
|
 | |
| |
| |
| |
| |
| |
|
Gene: OSBPL1A |
Gene summary for OSBPL1A |
| Gene information | Species | Human | Gene symbol | OSBPL1A | Gene ID | 114876 |
| Gene name | oxysterol binding protein like 1A | |
| Gene Alias | ORP-1 | |
| Cytomap | 18q11.2 | |
| Gene Type | protein-coding | GO ID | GO:0006066 | UniProtAcc | Q9BXW6 |
Top |
Malignant transformation analysis |
| Identification of the aberrant gene expression in precancerous and cancerous lesions by comparing the gene expression of stem-like cells in diseased tissues with normal stem cells |
| Entrez ID | Symbol | Replicates | Species | Organ | Tissue | Adj P-value | Log2FC | Malignancy |
| 114876 | OSBPL1A | HTA11_1391_2000001011 | Human | Colorectum | AD | 6.96e-03 | -3.47e-01 | -0.059 |
| 114876 | OSBPL1A | HTA11_99999973899_84307 | Human | Colorectum | MSS | 1.27e-04 | -4.71e-01 | 0.2585 |
| 114876 | OSBPL1A | A015-C-203 | Human | Colorectum | FAP | 2.02e-09 | -1.97e-01 | -0.1294 |
| 114876 | OSBPL1A | A001-C-108 | Human | Colorectum | FAP | 1.69e-04 | -9.37e-02 | -0.0272 |
| 114876 | OSBPL1A | A002-C-205 | Human | Colorectum | FAP | 1.11e-04 | -7.27e-02 | -0.1236 |
| 114876 | OSBPL1A | A015-C-006 | Human | Colorectum | FAP | 1.26e-02 | -1.07e-01 | -0.0994 |
| 114876 | OSBPL1A | A002-C-114 | Human | Colorectum | FAP | 2.64e-04 | -1.86e-01 | -0.1561 |
| 114876 | OSBPL1A | A015-C-104 | Human | Colorectum | FAP | 3.94e-11 | -1.79e-01 | -0.1899 |
| 114876 | OSBPL1A | A001-C-014 | Human | Colorectum | FAP | 3.40e-05 | -1.99e-01 | 0.0135 |
| 114876 | OSBPL1A | A002-C-016 | Human | Colorectum | FAP | 3.54e-05 | -9.84e-02 | 0.0521 |
| 114876 | OSBPL1A | A002-C-116 | Human | Colorectum | FAP | 2.44e-10 | -1.85e-01 | -0.0452 |
| 114876 | OSBPL1A | A014-C-008 | Human | Colorectum | FAP | 3.76e-03 | -2.32e-01 | -0.191 |
| 114876 | OSBPL1A | A018-E-020 | Human | Colorectum | FAP | 2.08e-06 | -2.90e-01 | -0.2034 |
| 114876 | OSBPL1A | F034 | Human | Colorectum | FAP | 5.09e-04 | -6.28e-02 | -0.0665 |
| 114876 | OSBPL1A | CRC-3-11773 | Human | Colorectum | CRC | 3.15e-16 | -4.44e-01 | 0.2564 |
| 114876 | OSBPL1A | LZE4T | Human | Esophagus | ESCC | 2.11e-06 | 1.58e-01 | 0.0811 |
| 114876 | OSBPL1A | LZE7T | Human | Esophagus | ESCC | 1.21e-04 | 2.39e-01 | 0.0667 |
| 114876 | OSBPL1A | P2T-E | Human | Esophagus | ESCC | 6.67e-39 | 7.18e-01 | 0.1177 |
| 114876 | OSBPL1A | P4T-E | Human | Esophagus | ESCC | 2.20e-27 | 6.32e-01 | 0.1323 |
| 114876 | OSBPL1A | P5T-E | Human | Esophagus | ESCC | 2.05e-20 | 4.25e-01 | 0.1327 |
| Page: 1 2 3 4 5 |
| Tissue | Expression Dynamics | Abbreviation |
| Colorectum (GSE201348) |  | FAP: Familial adenomatous polyposis |
| CRC: Colorectal cancer | ||
| Colorectum (HTA11) |  | AD: Adenomas |
| SER: Sessile serrated lesions | ||
| MSI-H: Microsatellite-high colorectal cancer | ||
| MSS: Microsatellite stable colorectal cancer | ||
| Esophagus | 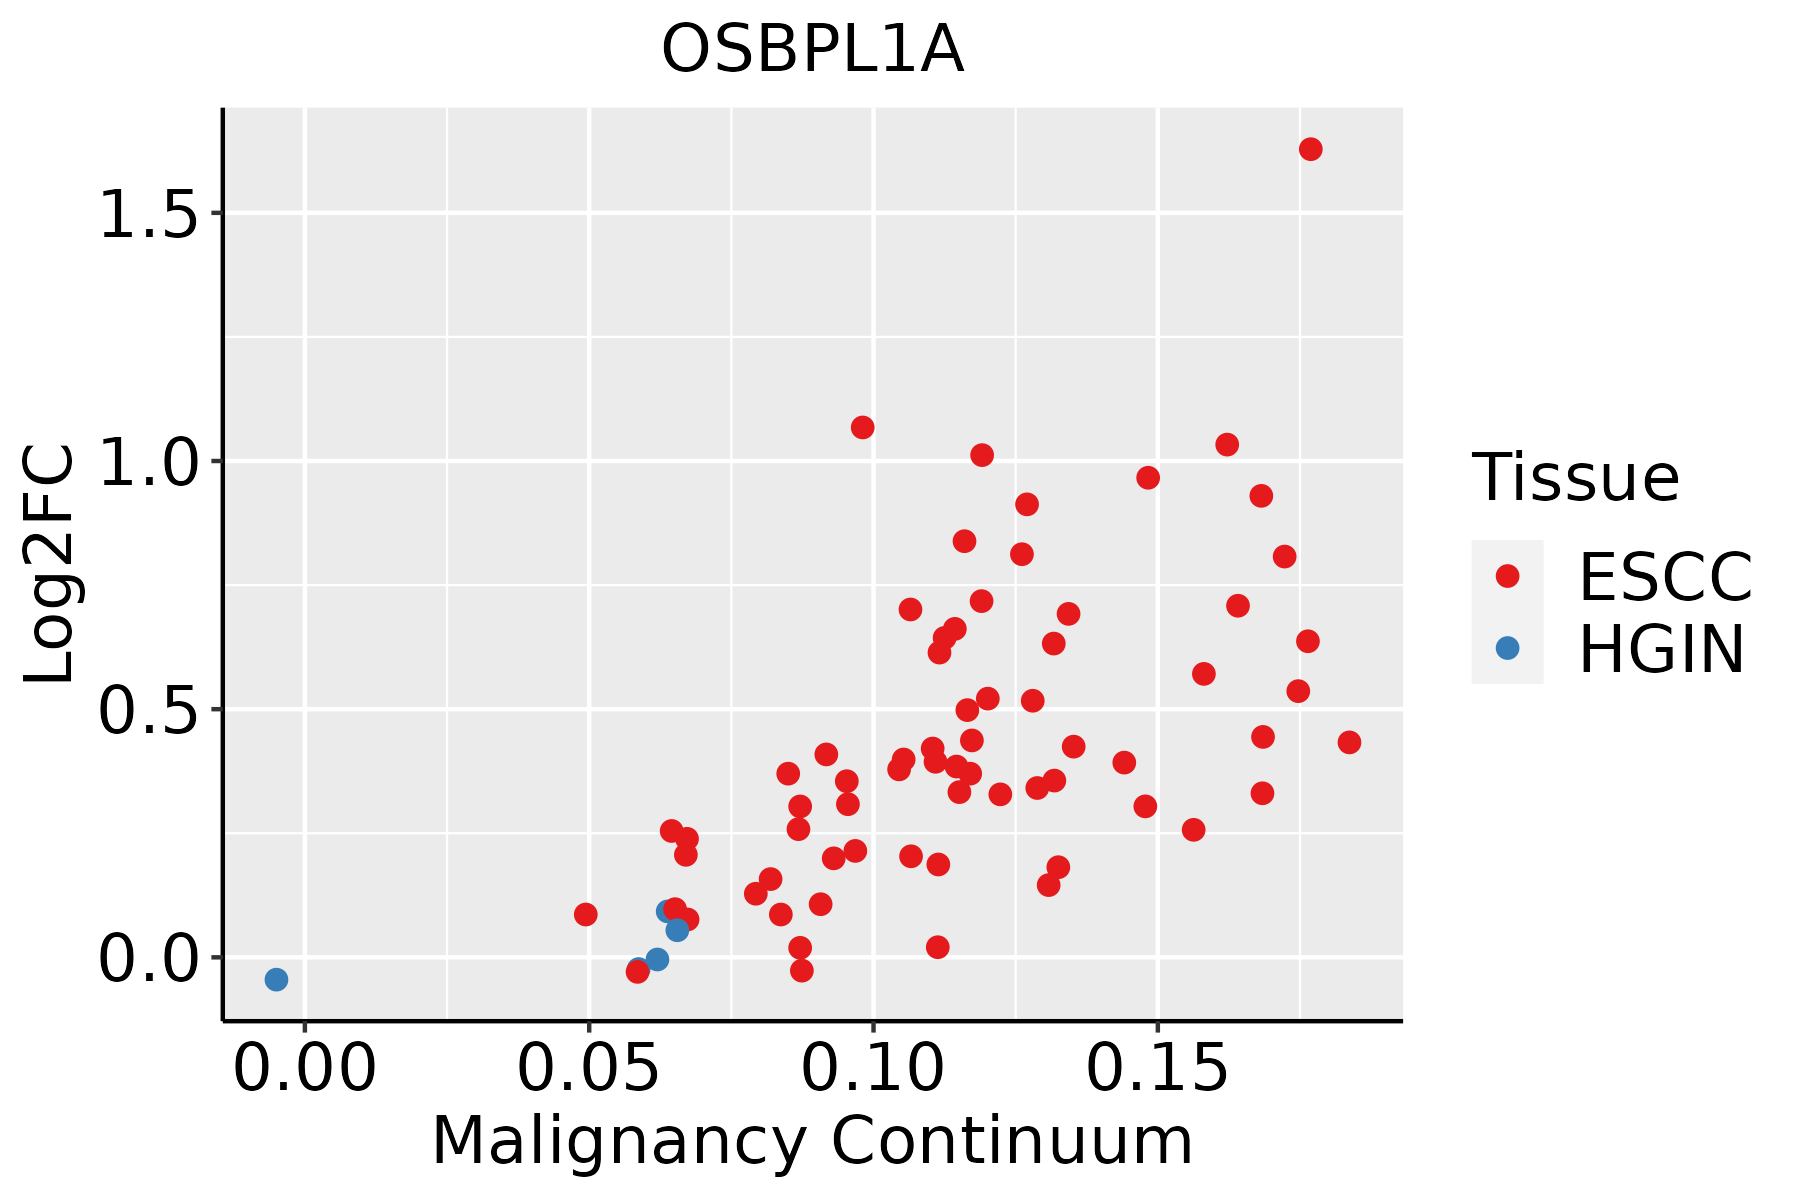 | ESCC: Esophageal squamous cell carcinoma |
| HGIN: High-grade intraepithelial neoplasias | ||
| LGIN: Low-grade intraepithelial neoplasias | ||
| Liver | 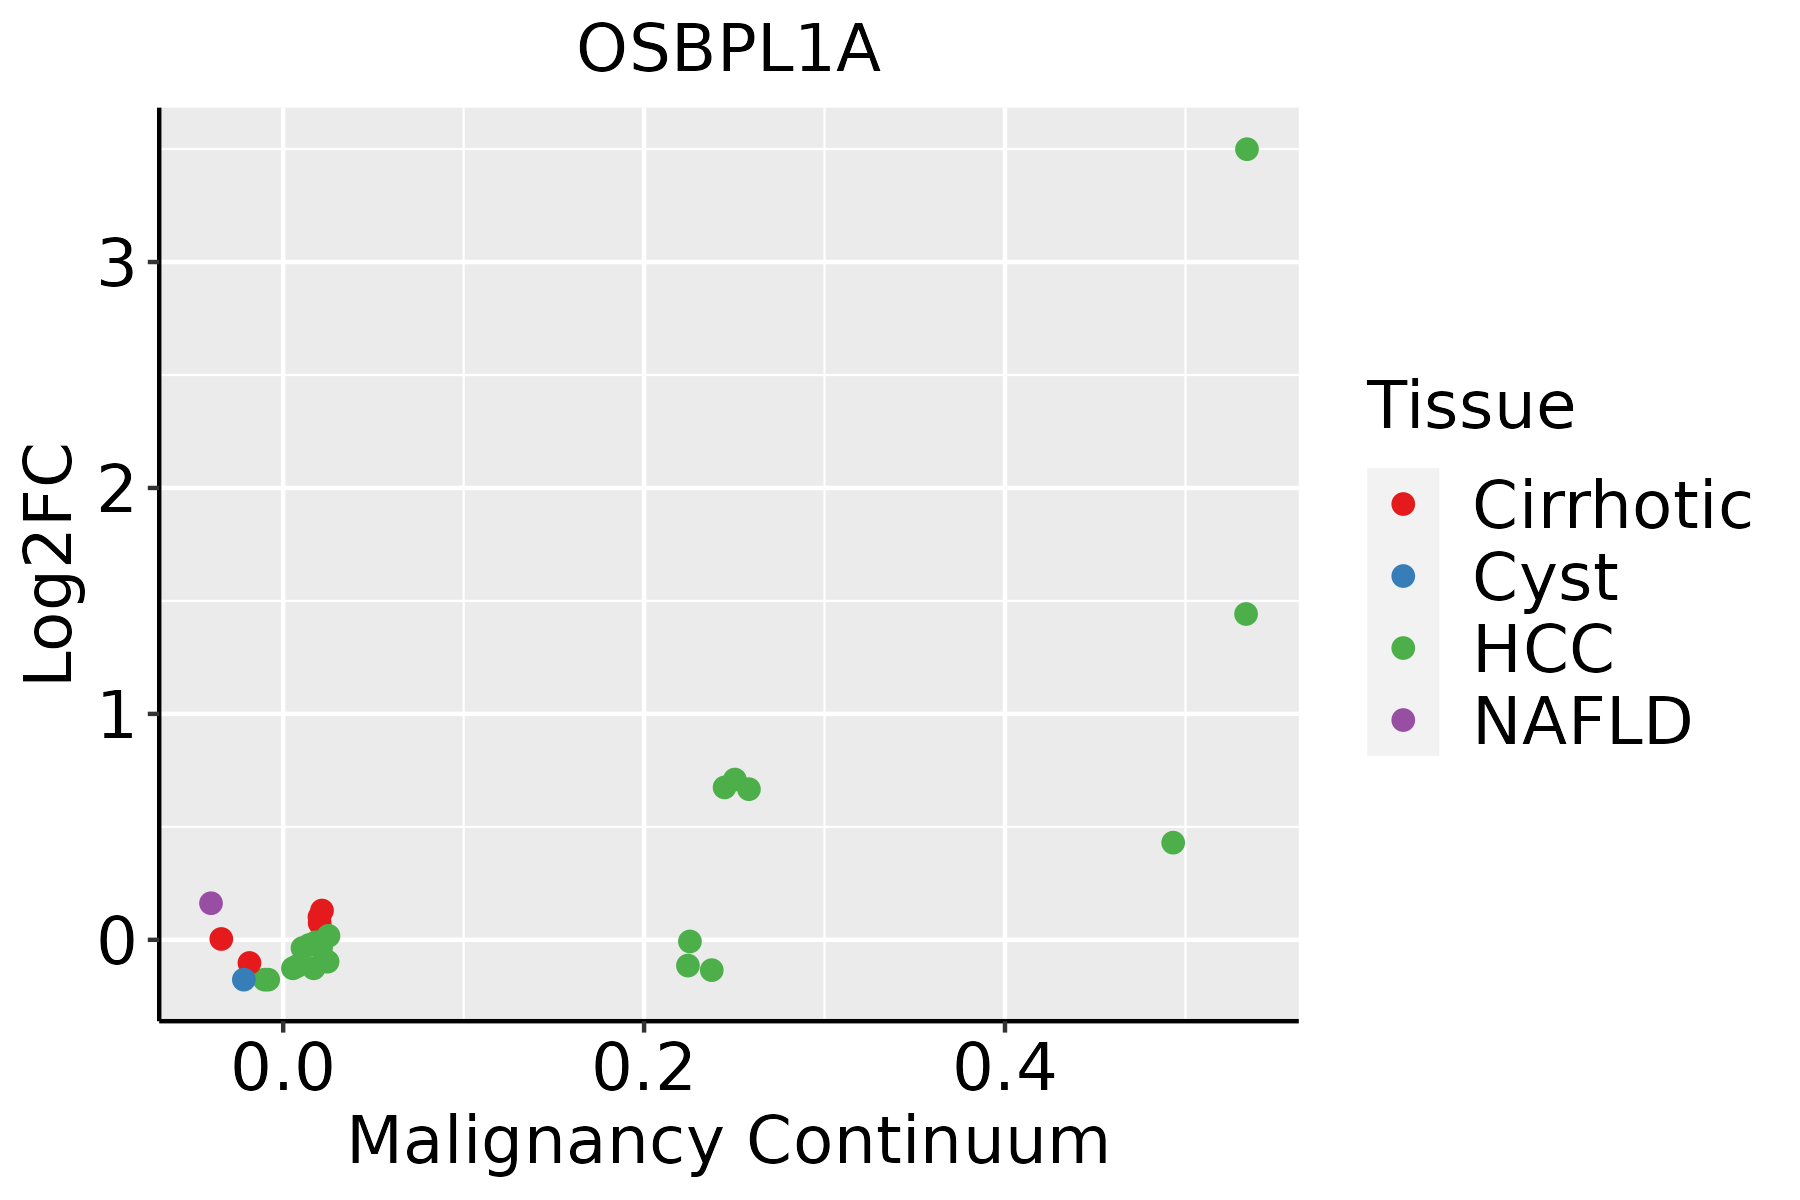 | HCC: Hepatocellular carcinoma |
| NAFLD: Non-alcoholic fatty liver disease | ||
| Oral Cavity |  | EOLP: Erosive Oral lichen planus |
| LP: leukoplakia | ||
| NEOLP: Non-erosive oral lichen planus | ||
| OSCC: Oral squamous cell carcinoma | ||
| Thyroid |  | ATC: Anaplastic thyroid cancer |
| HT: Hashimoto's thyroiditis | ||
| PTC: Papillary thyroid cancer |
| ∗log2FC in expression of this searched gene in stem-like cells from each diseased tissue sample relative to stem-like cells in normal samples in each tissue plotted against the malignancy continuum. Samples are colored based on if they are from different disease stage. |
Top |
Malignant transformation related pathway analysis |
| Find out the enriched GO biological processes and KEGG pathways involved in transition from healthy to precancer to cancer |
| Tissue | Disease Stage | Enriched GO biological Processes |
| Colorectum | AD |  |
| Colorectum | SER |  |
| Colorectum | MSS |  |
| Colorectum | MSI-H |  |
| Colorectum | FAP |  |
| ∗Top 15 enriched GO BP terms are showed in the bar plot of each disease state in each tissue. Each row represents a significant GO biological process which is colored according to the -log10(p.adjust). |
| Page: 1 2 3 4 5 6 7 8 9 |
| GO ID | Tissue | Disease Stage | Description | Gene Ratio | Bg Ratio | pvalue | p.adjust | Count |
| GO:0006066 | Colorectum | AD | alcohol metabolic process | 106/3918 | 353/18723 | 3.02e-05 | 5.57e-04 | 106 |
| GO:0010876 | Colorectum | AD | lipid localization | 120/3918 | 448/18723 | 1.59e-03 | 1.33e-02 | 120 |
| GO:0006869 | Colorectum | AD | lipid transport | 108/3918 | 398/18723 | 1.67e-03 | 1.39e-02 | 108 |
| GO:0008202 | Colorectum | AD | steroid metabolic process | 85/3918 | 319/18723 | 8.07e-03 | 4.75e-02 | 85 |
| GO:00060662 | Colorectum | MSS | alcohol metabolic process | 92/3467 | 353/18723 | 2.57e-04 | 3.46e-03 | 92 |
| GO:0046394 | Colorectum | MSS | carboxylic acid biosynthetic process | 76/3467 | 314/18723 | 6.71e-03 | 4.38e-02 | 76 |
| GO:00108761 | Colorectum | MSS | lipid localization | 104/3467 | 448/18723 | 6.76e-03 | 4.38e-02 | 104 |
| GO:0016053 | Colorectum | MSS | organic acid biosynthetic process | 76/3467 | 316/18723 | 7.88e-03 | 4.84e-02 | 76 |
| GO:00068691 | Colorectum | FAP | lipid transport | 81/2622 | 398/18723 | 2.84e-04 | 3.76e-03 | 81 |
| GO:00108762 | Colorectum | FAP | lipid localization | 85/2622 | 448/18723 | 1.92e-03 | 1.63e-02 | 85 |
| GO:00060663 | Colorectum | FAP | alcohol metabolic process | 69/2622 | 353/18723 | 2.29e-03 | 1.85e-02 | 69 |
| GO:00068692 | Colorectum | CRC | lipid transport | 63/2078 | 398/18723 | 2.36e-03 | 2.26e-02 | 63 |
| GO:00060664 | Colorectum | CRC | alcohol metabolic process | 57/2078 | 353/18723 | 2.37e-03 | 2.27e-02 | 57 |
| GO:00108763 | Colorectum | CRC | lipid localization | 68/2078 | 448/18723 | 4.60e-03 | 3.58e-02 | 68 |
| GO:00060668 | Esophagus | ESCC | alcohol metabolic process | 202/8552 | 353/18723 | 7.32e-06 | 7.26e-05 | 202 |
| GO:00463948 | Esophagus | ESCC | carboxylic acid biosynthetic process | 175/8552 | 314/18723 | 1.98e-04 | 1.26e-03 | 175 |
| GO:00160538 | Esophagus | ESCC | organic acid biosynthetic process | 175/8552 | 316/18723 | 3.04e-04 | 1.82e-03 | 175 |
| GO:19026524 | Esophagus | ESCC | secondary alcohol metabolic process | 87/8552 | 147/18723 | 6.58e-04 | 3.50e-03 | 87 |
| GO:00066946 | Esophagus | ESCC | steroid biosynthetic process | 98/8552 | 173/18723 | 2.34e-03 | 1.03e-02 | 98 |
| GO:00082034 | Esophagus | ESCC | cholesterol metabolic process | 79/8552 | 137/18723 | 3.11e-03 | 1.29e-02 | 79 |
| Page: 1 2 3 |
| Pathway ID | Tissue | Disease Stage | Description | Gene Ratio | Bg Ratio | pvalue | p.adjust | qvalue | Count |
| Page: 1 |
Top |
Cell-cell communication analysis |
| Identification of potential cell-cell interactions between two cell types and their ligand-receptor pairs for different disease states |
| Ligand | Receptor | LRpair | Pathway | Tissue | Disease Stage |
| Page: 1 |
Top |
Single-cell gene regulatory network inference analysis |
| Find out the significant the regulons (TFs) and the target genes of each regulon across cell types for different disease states |
| TF | Cell Type | Tissue | Disease Stage | Target Gene | RSS | Regulon Activity |
| ∗The dot plots of a searched regulon are shown for all cell subpopulations in each disease state of each tissue based on the regulon specific score inferred using pySCENIC and by calculating the average expression. |
| Page: 1 |
Top |
Somatic mutation of malignant transformation related genes |
| Annotation of somatic variants for genes involved in malignant transformation |
| Hugo Symbol | Variant Class | Variant Classification | dbSNP RS | HGVSc | HGVSp | HGVSp Short | SWISSPROT | BIOTYPE | SIFT | PolyPhen | Tumor Sample Barcode | Tissue | Histology | Sex | Age | Stage | Therapy Types | Drugs | Outcome |
| OSBPL1A | SNV | Missense_Mutation | novel | c.1245N>C | p.Leu415Phe | p.L415F | Q9BXW6 | protein_coding | tolerated(0.07) | probably_damaging(0.991) | TCGA-A1-A0SI-01 | Breast | breast invasive carcinoma | Female | <65 | I/II | Unknown | Unknown | SD |
| OSBPL1A | SNV | Missense_Mutation | novel | c.1526N>C | p.Ser509Thr | p.S509T | Q9BXW6 | protein_coding | tolerated(0.56) | benign(0) | TCGA-AR-A0U0-01 | Breast | breast invasive carcinoma | Female | >=65 | I/II | Unknown | Unknown | SD |
| OSBPL1A | SNV | Missense_Mutation | c.2736N>C | p.Glu912Asp | p.E912D | Q9BXW6 | protein_coding | tolerated(0.18) | benign(0.113) | TCGA-AR-A1AH-01 | Breast | breast invasive carcinoma | Female | <65 | I/II | Unspecific | PD | ||
| OSBPL1A | SNV | Missense_Mutation | rs758566297 | c.934N>T | p.Arg312Trp | p.R312W | Q9BXW6 | protein_coding | deleterious(0.01) | possibly_damaging(0.727) | TCGA-E9-A1R0-01 | Breast | breast invasive carcinoma | Female | <65 | I/II | Chemotherapy | cyclophosphamide | SD |
| OSBPL1A | SNV | Missense_Mutation | rs773613142 | c.426N>C | p.Glu142Asp | p.E142D | Q9BXW6 | protein_coding | deleterious(0.02) | probably_damaging(0.97) | TCGA-WT-AB44-01 | Breast | breast invasive carcinoma | Female | >=65 | I/II | Hormone Therapy | arimidex | SD |
| OSBPL1A | insertion | Frame_Shift_Ins | novel | c.1782_1783insGTGATGAAAACCATGGTTGGGAA | p.Ser595ValfsTer20 | p.S595Vfs*20 | Q9BXW6 | protein_coding | TCGA-A2-A04Y-01 | Breast | breast invasive carcinoma | Female | <65 | I/II | Chemotherapy | cytoxan | SD | ||
| OSBPL1A | insertion | In_Frame_Ins | novel | c.885_886insCAGTTATTCAGCTGGGCACGGTGGCTTACGCCTGTA | p.Asp295_Ser296insGlnLeuPheSerTrpAlaArgTrpLeuThrProVal | p.D295_S296insQLFSWARWLTPV | Q9BXW6 | protein_coding | TCGA-AO-A0JD-01 | Breast | breast invasive carcinoma | Female | <65 | III/IV | Chemotherapy | cyclophosphamide | SD | ||
| OSBPL1A | insertion | In_Frame_Ins | novel | c.1524_1525insTTAATAAAACCA | p.Gly508_Ser509insLeuIleLysPro | p.G508_S509insLIKP | Q9BXW6 | protein_coding | TCGA-AR-A0U0-01 | Breast | breast invasive carcinoma | Female | >=65 | I/II | Unknown | Unknown | SD | ||
| OSBPL1A | deletion | Frame_Shift_Del | c.2682delN | p.Lys894AsnfsTer71 | p.K894Nfs*71 | Q9BXW6 | protein_coding | TCGA-EW-A1IZ-01 | Breast | breast invasive carcinoma | Female | <65 | III/IV | Chemotherapy | taxotere | SD | |||
| OSBPL1A | SNV | Missense_Mutation | novel | c.1112N>C | p.Gln371Pro | p.Q371P | Q9BXW6 | protein_coding | deleterious(0.02) | probably_damaging(0.969) | TCGA-C5-A2LV-01 | Cervix | cervical & endocervical cancer | Female | <65 | I/II | Unknown | Unknown | SD |
| Page: 1 2 3 4 5 6 7 8 9 10 11 |
Top |
Related drugs of malignant transformation related genes |
| Identification of chemicals and drugs interact with genes involved in malignant transfromation |
| (DGIdb 4.0) |
| Entrez ID | Symbol | Category | Interaction Types | Drug Claim Name | Drug Name | PMIDs |
| Page: 1 |

Copyright 2023-Present -The University of Texas Health Science Center at Houston |