
|
|||||
|
 | |
| |
| |
| |
| |
| |
|
Gene: OSBPL10 |
Gene summary for OSBPL10 |
| Gene information | Species | Human | Gene symbol | OSBPL10 | Gene ID | 114884 |
| Gene name | oxysterol binding protein like 10 | |
| Gene Alias | ORP10 | |
| Cytomap | 3p23 | |
| Gene Type | protein-coding | GO ID | GO:0006575 | UniProtAcc | Q9BXB5 |
Top |
Malignant transformation analysis |
| Identification of the aberrant gene expression in precancerous and cancerous lesions by comparing the gene expression of stem-like cells in diseased tissues with normal stem cells |
| Entrez ID | Symbol | Replicates | Species | Organ | Tissue | Adj P-value | Log2FC | Malignancy |
| 114884 | OSBPL10 | CCI_1 | Human | Cervix | CC | 8.49e-04 | 7.41e-01 | 0.528 |
| 114884 | OSBPL10 | CCI_2 | Human | Cervix | CC | 2.46e-04 | 8.94e-01 | 0.5249 |
| 114884 | OSBPL10 | CCI_3 | Human | Cervix | CC | 3.65e-13 | 8.92e-01 | 0.516 |
| 114884 | OSBPL10 | HTA11_3410_2000001011 | Human | Colorectum | AD | 3.45e-05 | -2.59e-01 | 0.0155 |
| 114884 | OSBPL10 | A015-C-203 | Human | Colorectum | FAP | 6.91e-18 | -4.94e-01 | -0.1294 |
| 114884 | OSBPL10 | A014-C-040 | Human | Colorectum | FAP | 1.47e-02 | -4.24e-01 | -0.1184 |
| 114884 | OSBPL10 | A002-C-201 | Human | Colorectum | FAP | 7.79e-07 | -1.69e-01 | 0.0324 |
| 114884 | OSBPL10 | A001-C-119 | Human | Colorectum | FAP | 1.00e-07 | -4.72e-01 | -0.1557 |
| 114884 | OSBPL10 | A001-C-108 | Human | Colorectum | FAP | 4.42e-04 | -2.64e-01 | -0.0272 |
| 114884 | OSBPL10 | A002-C-205 | Human | Colorectum | FAP | 2.03e-14 | -3.11e-01 | -0.1236 |
| 114884 | OSBPL10 | A015-C-005 | Human | Colorectum | FAP | 1.55e-03 | -2.33e-01 | -0.0336 |
| 114884 | OSBPL10 | A015-C-006 | Human | Colorectum | FAP | 7.06e-10 | -3.45e-01 | -0.0994 |
| 114884 | OSBPL10 | A015-C-106 | Human | Colorectum | FAP | 7.66e-06 | -3.28e-01 | -0.0511 |
| 114884 | OSBPL10 | A002-C-114 | Human | Colorectum | FAP | 9.24e-20 | -5.65e-01 | -0.1561 |
| 114884 | OSBPL10 | A015-C-104 | Human | Colorectum | FAP | 1.82e-16 | -3.58e-01 | -0.1899 |
| 114884 | OSBPL10 | A001-C-014 | Human | Colorectum | FAP | 5.74e-04 | -2.61e-01 | 0.0135 |
| 114884 | OSBPL10 | A002-C-016 | Human | Colorectum | FAP | 4.31e-12 | -2.35e-01 | 0.0521 |
| 114884 | OSBPL10 | A015-C-002 | Human | Colorectum | FAP | 1.81e-08 | -3.26e-01 | -0.0763 |
| 114884 | OSBPL10 | A001-C-203 | Human | Colorectum | FAP | 7.28e-06 | -2.00e-01 | -0.0481 |
| 114884 | OSBPL10 | A002-C-116 | Human | Colorectum | FAP | 4.86e-16 | -3.56e-01 | -0.0452 |
| Page: 1 2 3 |
| Tissue | Expression Dynamics | Abbreviation |
| Cervix |  | CC: Cervix cancer |
| HSIL_HPV: HPV-infected high-grade squamous intraepithelial lesions | ||
| N_HPV: HPV-infected normal cervix | ||
| Colorectum (GSE201348) | 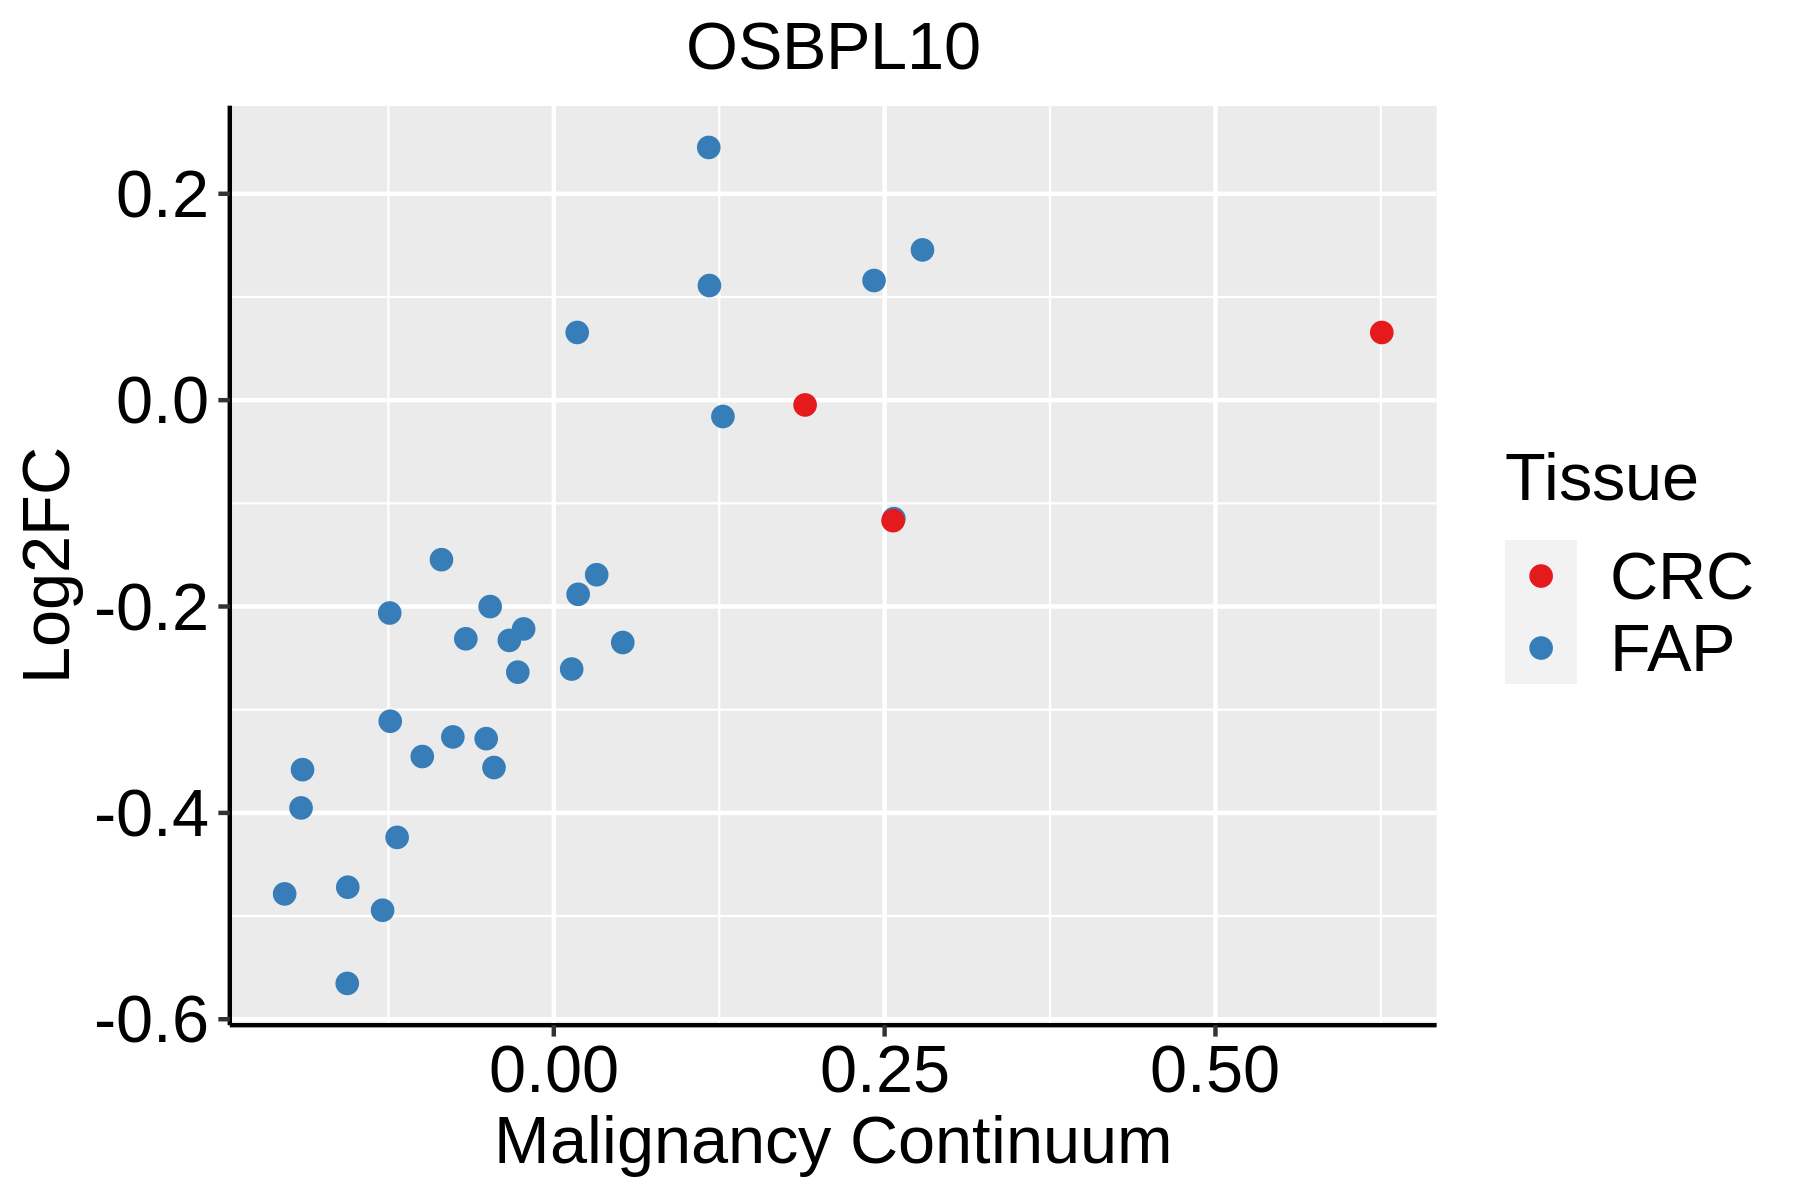 | FAP: Familial adenomatous polyposis |
| CRC: Colorectal cancer | ||
| Colorectum (HTA11) |  | AD: Adenomas |
| SER: Sessile serrated lesions | ||
| MSI-H: Microsatellite-high colorectal cancer | ||
| MSS: Microsatellite stable colorectal cancer | ||
| Endometrium |  | AEH: Atypical endometrial hyperplasia |
| EEC: Endometrioid Cancer | ||
| Lung |  | AAH: Atypical adenomatous hyperplasia |
| AIS: Adenocarcinoma in situ | ||
| IAC: Invasive lung adenocarcinoma | ||
| MIA: Minimally invasive adenocarcinoma | ||
| Prostate |  | BPH: Benign Prostatic Hyperplasia |
| ∗log2FC in expression of this searched gene in stem-like cells from each diseased tissue sample relative to stem-like cells in normal samples in each tissue plotted against the malignancy continuum. Samples are colored based on if they are from different disease stage. |
Top |
Malignant transformation related pathway analysis |
| Find out the enriched GO biological processes and KEGG pathways involved in transition from healthy to precancer to cancer |
| Tissue | Disease Stage | Enriched GO biological Processes |
| Colorectum | AD |  |
| Colorectum | SER |  |
| Colorectum | MSS |  |
| Colorectum | MSI-H |  |
| Colorectum | FAP |  |
| ∗Top 15 enriched GO BP terms are showed in the bar plot of each disease state in each tissue. Each row represents a significant GO biological process which is colored according to the -log10(p.adjust). |
| Page: 1 2 3 4 5 6 7 8 9 |
| GO ID | Tissue | Disease Stage | Description | Gene Ratio | Bg Ratio | pvalue | p.adjust | Count |
| GO:0006575 | Colorectum | AD | cellular modified amino acid metabolic process | 59/3918 | 188/18723 | 4.80e-04 | 5.27e-03 | 59 |
| GO:0010876 | Colorectum | AD | lipid localization | 120/3918 | 448/18723 | 1.59e-03 | 1.33e-02 | 120 |
| GO:0006869 | Colorectum | AD | lipid transport | 108/3918 | 398/18723 | 1.67e-03 | 1.39e-02 | 108 |
| GO:0006650 | Colorectum | AD | glycerophospholipid metabolic process | 83/3918 | 306/18723 | 5.40e-03 | 3.55e-02 | 83 |
| GO:0006644 | Colorectum | AD | phospholipid metabolic process | 101/3918 | 383/18723 | 5.80e-03 | 3.67e-02 | 101 |
| GO:0015748 | Colorectum | AD | organophosphate ester transport | 42/3918 | 140/18723 | 7.04e-03 | 4.31e-02 | 42 |
| GO:00068691 | Colorectum | FAP | lipid transport | 81/2622 | 398/18723 | 2.84e-04 | 3.76e-03 | 81 |
| GO:00066502 | Colorectum | FAP | glycerophospholipid metabolic process | 62/2622 | 306/18723 | 1.54e-03 | 1.38e-02 | 62 |
| GO:00108762 | Colorectum | FAP | lipid localization | 85/2622 | 448/18723 | 1.92e-03 | 1.63e-02 | 85 |
| GO:00066442 | Colorectum | FAP | phospholipid metabolic process | 74/2622 | 383/18723 | 2.24e-03 | 1.83e-02 | 74 |
| GO:0006658 | Colorectum | FAP | phosphatidylserine metabolic process | 9/2622 | 25/18723 | 5.01e-03 | 3.33e-02 | 9 |
| GO:0015914 | Colorectum | FAP | phospholipid transport | 23/2622 | 96/18723 | 6.09e-03 | 3.82e-02 | 23 |
| GO:00159142 | Lung | IAC | phospholipid transport | 20/2061 | 96/18723 | 3.58e-03 | 3.00e-02 | 20 |
| GO:00157482 | Lung | IAC | organophosphate ester transport | 26/2061 | 140/18723 | 5.22e-03 | 3.97e-02 | 26 |
| GO:001591411 | Lung | AIS | phospholipid transport | 18/1849 | 96/18723 | 5.64e-03 | 4.76e-02 | 18 |
| Page: 1 |
| Pathway ID | Tissue | Disease Stage | Description | Gene Ratio | Bg Ratio | pvalue | p.adjust | qvalue | Count |
| Page: 1 |
Top |
Cell-cell communication analysis |
| Identification of potential cell-cell interactions between two cell types and their ligand-receptor pairs for different disease states |
| Ligand | Receptor | LRpair | Pathway | Tissue | Disease Stage |
| Page: 1 |
Top |
Single-cell gene regulatory network inference analysis |
| Find out the significant the regulons (TFs) and the target genes of each regulon across cell types for different disease states |
| TF | Cell Type | Tissue | Disease Stage | Target Gene | RSS | Regulon Activity |
| ∗The dot plots of a searched regulon are shown for all cell subpopulations in each disease state of each tissue based on the regulon specific score inferred using pySCENIC and by calculating the average expression. |
| Page: 1 |
Top |
Somatic mutation of malignant transformation related genes |
| Annotation of somatic variants for genes involved in malignant transformation |
| Hugo Symbol | Variant Class | Variant Classification | dbSNP RS | HGVSc | HGVSp | HGVSp Short | SWISSPROT | BIOTYPE | SIFT | PolyPhen | Tumor Sample Barcode | Tissue | Histology | Sex | Age | Stage | Therapy Types | Drugs | Outcome |
| OSBPL10 | SNV | Missense_Mutation | novel | c.396C>A | p.Ser132Arg | p.S132R | Q9BXB5 | protein_coding | deleterious(0) | probably_damaging(0.999) | TCGA-A2-A1G1-01 | Breast | breast invasive carcinoma | Female | >=65 | I/II | Unknown | Unknown | SD |
| OSBPL10 | SNV | Missense_Mutation | c.1387N>T | p.Leu463Phe | p.L463F | Q9BXB5 | protein_coding | deleterious(0) | possibly_damaging(0.888) | TCGA-AC-A23H-01 | Breast | breast invasive carcinoma | Female | >=65 | I/II | Unknown | Unknown | PD | |
| OSBPL10 | SNV | Missense_Mutation | rs780338081 | c.560N>A | p.Arg187Gln | p.R187Q | Q9BXB5 | protein_coding | deleterious(0.01) | possibly_damaging(0.897) | TCGA-AN-A046-01 | Breast | breast invasive carcinoma | Female | >=65 | I/II | Unknown | Unknown | SD |
| OSBPL10 | SNV | Missense_Mutation | c.1798C>G | p.Leu600Val | p.L600V | Q9BXB5 | protein_coding | deleterious(0) | probably_damaging(0.998) | TCGA-C8-A12T-01 | Breast | breast invasive carcinoma | Female | <65 | I/II | Unknown | Unknown | SD | |
| OSBPL10 | SNV | Missense_Mutation | c.1361G>C | p.Arg454Thr | p.R454T | Q9BXB5 | protein_coding | deleterious(0) | probably_damaging(1) | TCGA-GM-A2D9-01 | Breast | breast invasive carcinoma | Female | >=65 | I/II | Hormone Therapy | arimidex | SD | |
| OSBPL10 | SNV | Missense_Mutation | rs267599767 | c.500N>A | p.Arg167Gln | p.R167Q | Q9BXB5 | protein_coding | tolerated(0.97) | benign(0.075) | TCGA-VS-A9UD-01 | Cervix | cervical & endocervical cancer | Female | >=65 | III/IV | Chemotherapy | cisplatin | CR |
| OSBPL10 | SNV | Missense_Mutation | c.1550N>T | p.Ala517Val | p.A517V | Q9BXB5 | protein_coding | tolerated(0.15) | benign(0.026) | TCGA-AA-3715-01 | Colorectum | colon adenocarcinoma | Male | >=65 | I/II | Unknown | Unknown | PD | |
| OSBPL10 | SNV | Missense_Mutation | rs74657729 | c.1277N>A | p.Arg426Gln | p.R426Q | Q9BXB5 | protein_coding | deleterious(0) | probably_damaging(0.997) | TCGA-AA-3984-01 | Colorectum | colon adenocarcinoma | Female | <65 | I/II | Unknown | Unknown | SD |
| OSBPL10 | SNV | Missense_Mutation | c.718N>A | p.Glu240Lys | p.E240K | Q9BXB5 | protein_coding | tolerated(0.07) | possibly_damaging(0.728) | TCGA-AA-A00N-01 | Colorectum | colon adenocarcinoma | Male | >=65 | I/II | Unknown | Unknown | PD | |
| OSBPL10 | SNV | Missense_Mutation | rs140782910 | c.1537G>A | p.Glu513Lys | p.E513K | Q9BXB5 | protein_coding | tolerated(0.37) | benign(0.014) | TCGA-AA-A010-01 | Colorectum | colon adenocarcinoma | Female | <65 | I/II | Chemotherapy | folinic | CR |
| Page: 1 2 3 4 5 6 7 8 9 |
Top |
Related drugs of malignant transformation related genes |
| Identification of chemicals and drugs interact with genes involved in malignant transfromation |
| (DGIdb 4.0) |
| Entrez ID | Symbol | Category | Interaction Types | Drug Claim Name | Drug Name | PMIDs |
| Page: 1 |

Copyright 2023-Present -The University of Texas Health Science Center at Houston |