Schematic overview of the cellular and molecular mechanisms involved in the cancer progression, including the proposed cellular and molecular mechanisms in cancer cells trajectory. AT1: alveolar type 1 cells; AT2: alveolar type 2 cells; AAH: atypical adenomatous hyperplasia; AIS: adenocarcinoma in situ; MIA: minimally invasive adenocarcinoma; IA: invasive adenocarcinoma; EMT: epithelial-mesenchymal transition

Home

Download

Statistics

Help

Contact

Center for Computational Systems Medicine
leaf

Gene summary

leaf

Malignant transformation analysis

leaf

Malignant transformation related pathway analysis

leaf

Cell-cell communication analysis

leaf

Single-cell gene regulatory network inference analysis

leaf

Somatic mutation of malignant transformation related genes

leaf

Related drugs of malignant transformation related genes

Gene: OSBP

Gene summary for OSBP

check button Gene summary.

Gene informationSpeciesHuman
Gene symbol

OSBP

Gene ID

5007

Gene nameoxysterol binding protein
Gene AliasOSBP1
Cytomap11q12.1
Gene Typeprotein-coding
GO ID

GO:0001678

UniProtAcc

P22059


Top

Malignant transformation analysis

check button Identification of the aberrant gene expression in precancerous and cancerous lesions by comparing the gene expression of stem-like cells in diseased tissues with normal stem cells
check button Malignant transformation involving gene list.
Entrez IDSymbolReplicatesSpeciesOrganTissueAdj P-valueLog2FCMalignancy
5007OSBPHTA11_347_2000001011HumanColorectumAD3.24e-073.84e-01-0.1954
5007OSBPHTA11_99999970781_79442HumanColorectumMSS4.97e-023.87e-010.294
5007OSBPHTA11_99999965104_69814HumanColorectumMSS6.45e-032.53e-010.281
5007OSBPHTA11_99999971662_82457HumanColorectumMSS3.80e-024.11e-010.3859
5007OSBPA015-C-203HumanColorectumFAP1.07e-08-1.67e-01-0.1294
5007OSBPA001-C-108HumanColorectumFAP3.31e-04-2.78e-03-0.0272
5007OSBPA002-C-205HumanColorectumFAP2.21e-04-1.52e-01-0.1236
5007OSBPA015-C-006HumanColorectumFAP2.70e-02-9.12e-02-0.0994
5007OSBPA002-C-114HumanColorectumFAP4.09e-03-9.21e-02-0.1561
5007OSBPA015-C-104HumanColorectumFAP2.06e-08-5.46e-02-0.1899
5007OSBPA001-C-014HumanColorectumFAP5.91e-06-1.63e-010.0135
5007OSBPA002-C-016HumanColorectumFAP1.74e-05-1.51e-010.0521
5007OSBPA002-C-116HumanColorectumFAP1.81e-08-9.00e-02-0.0452
5007OSBPA018-E-020HumanColorectumFAP3.18e-04-1.63e-01-0.2034
5007OSBPF034HumanColorectumFAP1.27e-04-1.35e-01-0.0665
5007OSBPF072BHumanColorectumFAP1.01e-02-1.24e-010.257
5007OSBPLZE4THumanEsophagusESCC6.27e-049.86e-020.0811
5007OSBPLZE7THumanEsophagusESCC3.98e-041.35e-010.0667
5007OSBPLZE24THumanEsophagusESCC1.28e-132.83e-010.0596
5007OSBPP2T-EHumanEsophagusESCC1.91e-111.31e-010.1177
Page: 1 2 3 4 5 6 7 

check button Transcriptomic changes along malignancy continuum.
TissueExpression DynamicsAbbreviation
Colorectum (GSE201348)The image shows the transcriptomic changes along malignancy continuum.log2FC in expression of this searched gene in stem-like cells from each diseased tissue sample relative to stem-like cells in normal samples in each tissue plotted against the malignancy continuum. Samples are colored based on if they are from different disease stage.FAP: Familial adenomatous polyposis
CRC: Colorectal cancer
Colorectum (HTA11)The image shows the transcriptomic changes along malignancy continuum.log2FC in expression of this searched gene in stem-like cells from each diseased tissue sample relative to stem-like cells in normal samples in each tissue plotted against the malignancy continuum. Samples are colored based on if they are from different disease stage.AD: Adenomas
SER: Sessile serrated lesions
MSI-H: Microsatellite-high colorectal cancer
MSS: Microsatellite stable colorectal cancer
EsophagusThe image shows the transcriptomic changes along malignancy continuum.log2FC in expression of this searched gene in stem-like cells from each diseased tissue sample relative to stem-like cells in normal samples in each tissue plotted against the malignancy continuum. Samples are colored based on if they are from different disease stage.ESCC: Esophageal squamous cell carcinoma
HGIN: High-grade intraepithelial neoplasias
LGIN: Low-grade intraepithelial neoplasias
LiverThe image shows the transcriptomic changes along malignancy continuum.log2FC in expression of this searched gene in stem-like cells from each diseased tissue sample relative to stem-like cells in normal samples in each tissue plotted against the malignancy continuum. Samples are colored based on if they are from different disease stage.
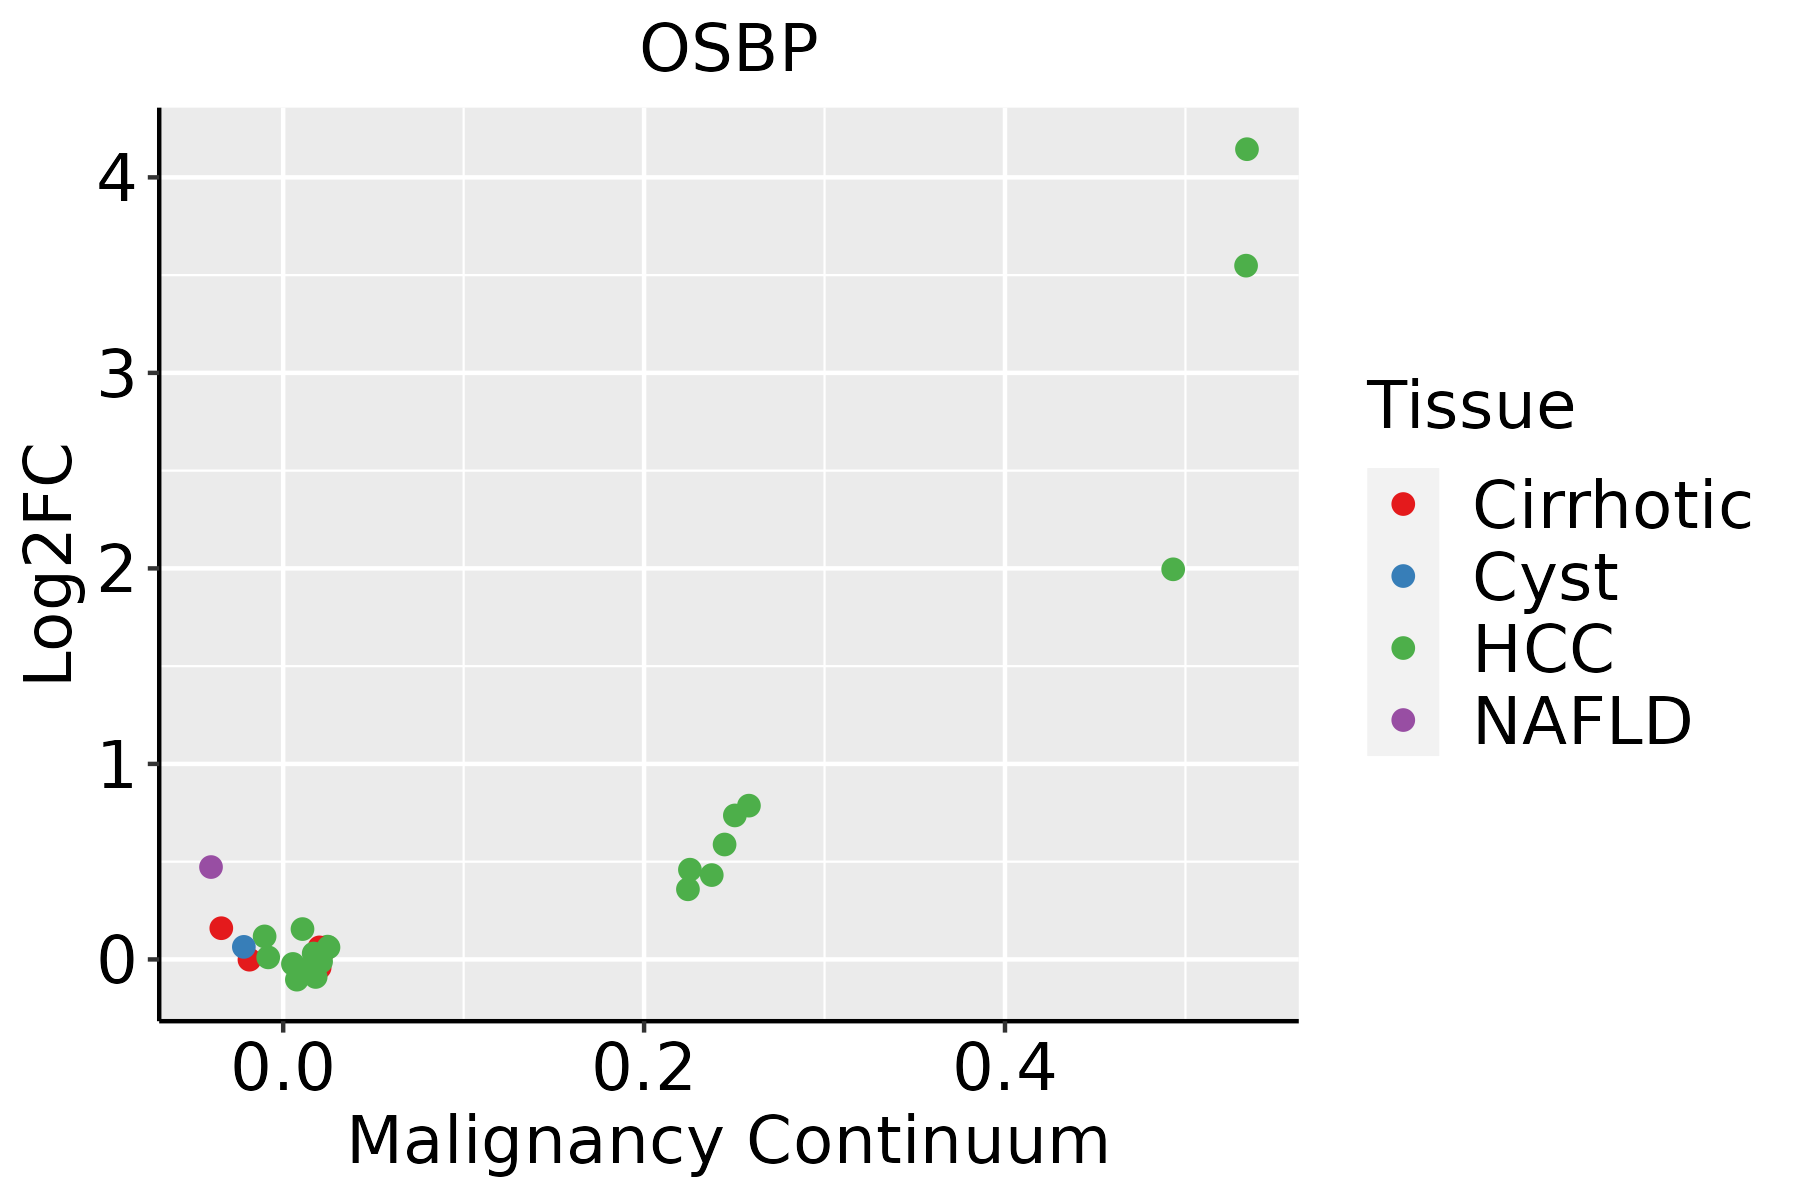
HCC: Hepatocellular carcinoma
NAFLD: Non-alcoholic fatty liver disease
Oral CavityThe image shows the transcriptomic changes along malignancy continuum.log2FC in expression of this searched gene in stem-like cells from each diseased tissue sample relative to stem-like cells in normal samples in each tissue plotted against the malignancy continuum. Samples are colored based on if they are from different disease stage.EOLP: Erosive Oral lichen planus
LP: leukoplakia
NEOLP: Non-erosive oral lichen planus
OSCC: Oral squamous cell carcinoma
ProstateThe image shows the transcriptomic changes along malignancy continuum.log2FC in expression of this searched gene in stem-like cells from each diseased tissue sample relative to stem-like cells in normal samples in each tissue plotted against the malignancy continuum. Samples are colored based on if they are from different disease stage.
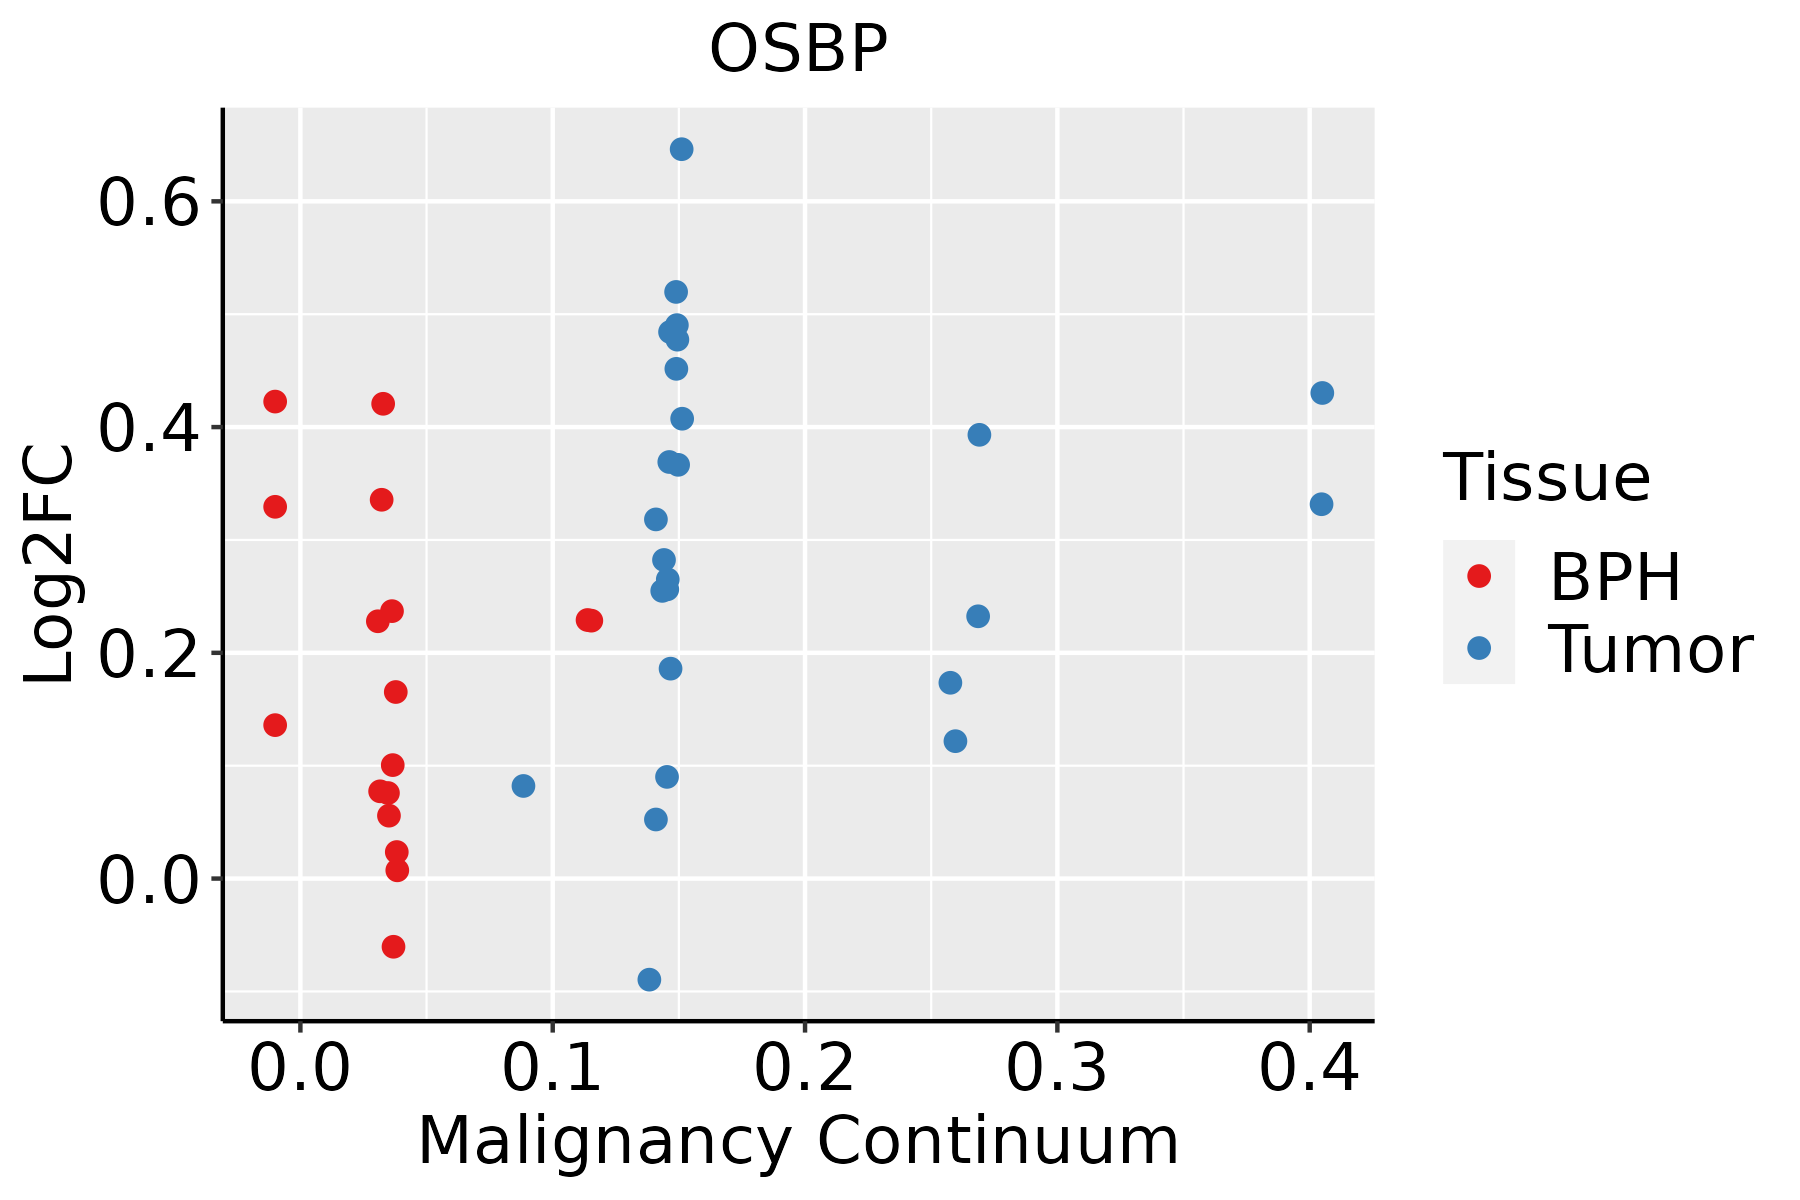
BPH: Benign Prostatic Hyperplasia
ThyroidThe image shows the transcriptomic changes along malignancy continuum.log2FC in expression of this searched gene in stem-like cells from each diseased tissue sample relative to stem-like cells in normal samples in each tissue plotted against the malignancy continuum. Samples are colored based on if they are from different disease stage.
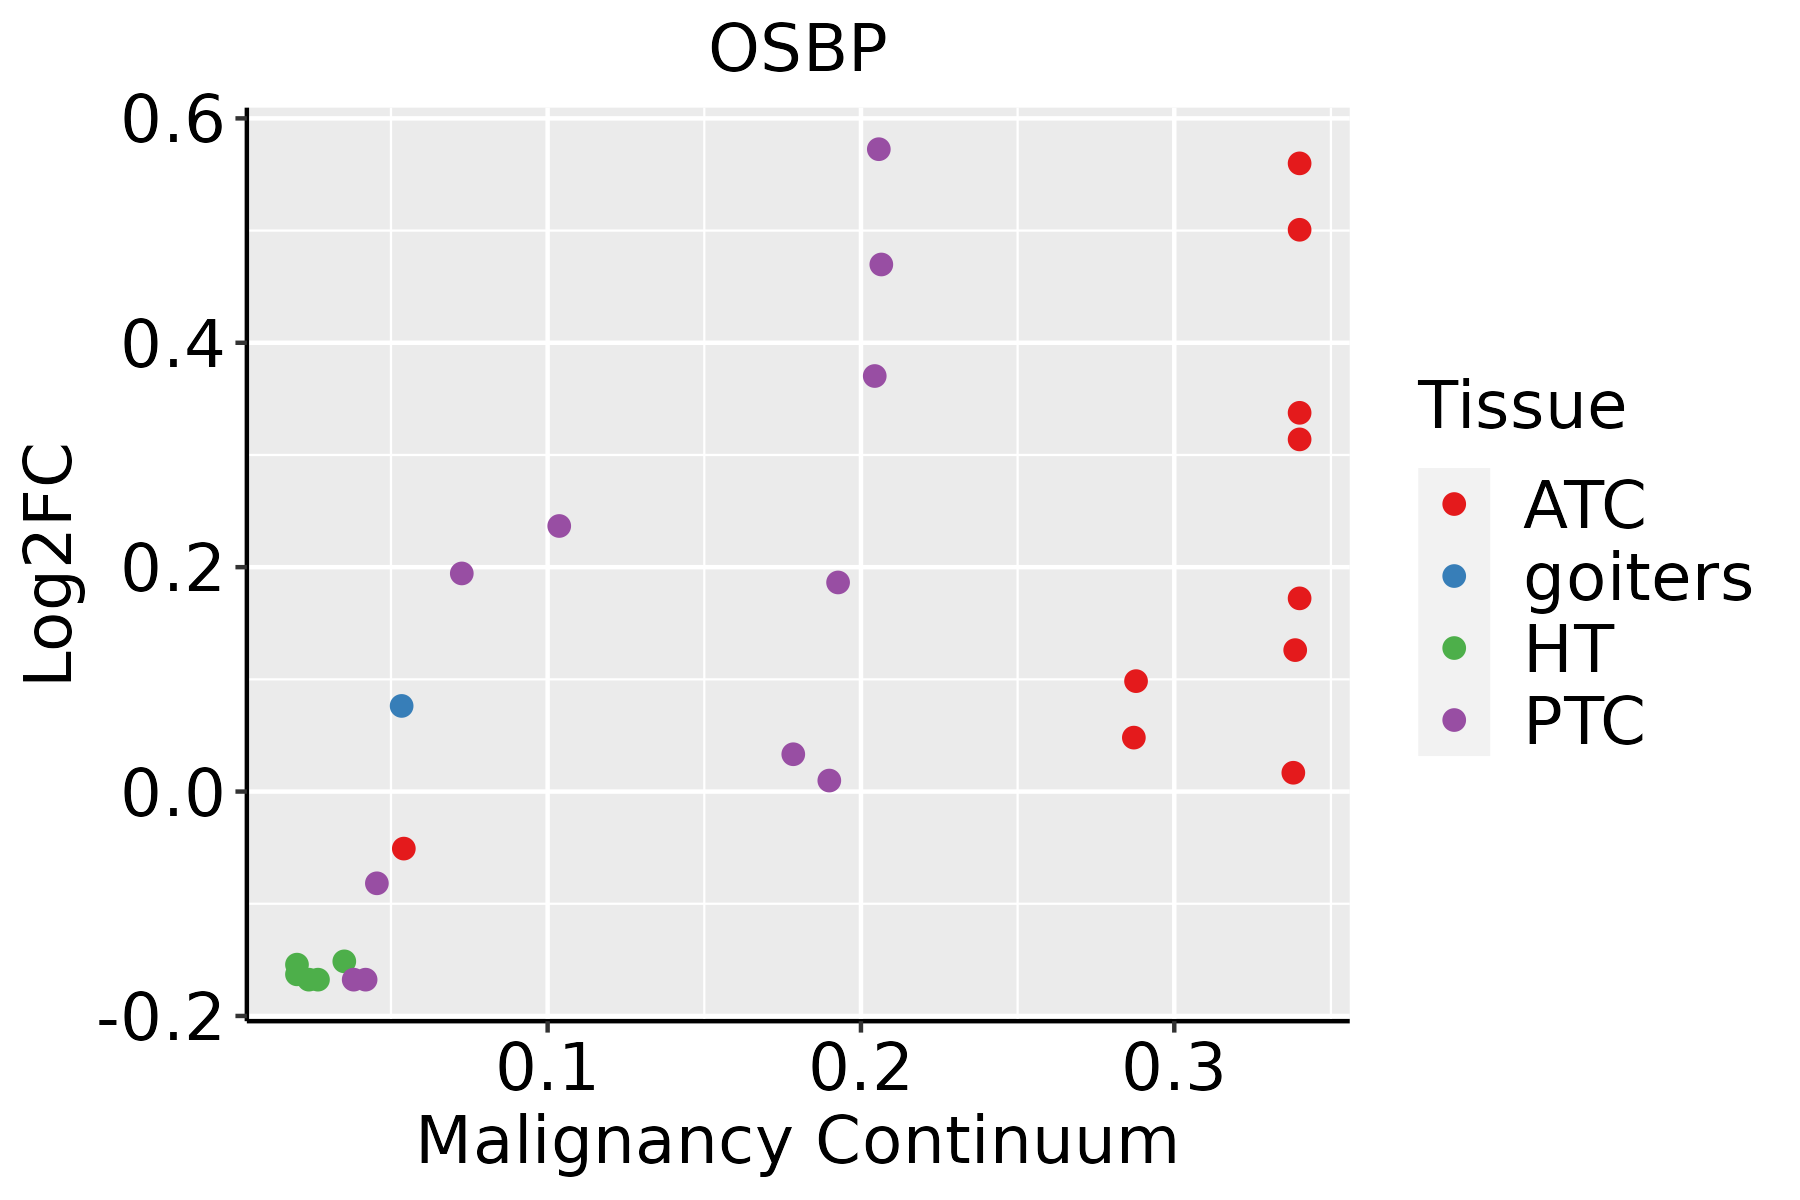
ATC: Anaplastic thyroid cancer
HT: Hashimoto's thyroiditis
PTC: Papillary thyroid cancer
∗log2FC in expression of this searched gene in stem-like cells from each diseased tissue sample relative to stem-like cells in normal samples in each tissue plotted against the malignancy continuum. Samples are colored based on if they are from different disease stage.

Top

Malignant transformation related pathway analysis

check buttonFind out the enriched GO biological processes and KEGG pathways involved in transition from healthy to precancer to cancer
check button Figure of enriched GO biological processes.
TissueDisease StageEnriched GO biological Processes
ColorectumADGO analysis - Figure of enriched GO biological processes: Top 15 enriched GO BP terms are showed in the bar plot of each disease state in each tissue. Each row represents a significant GO biological process which is colored according to the -log10(p.adjust).
ColorectumSERGO analysis - Figure of enriched GO biological processes: Top 15 enriched GO BP terms are showed in the bar plot of each disease state in each tissue. Each row represents a significant GO biological process which is colored according to the -log10(p.adjust).
ColorectumMSSGO analysis - Figure of enriched GO biological processes: Top 15 enriched GO BP terms are showed in the bar plot of each disease state in each tissue. Each row represents a significant GO biological process which is colored according to the -log10(p.adjust).
ColorectumMSI-HGO analysis - Figure of enriched GO biological processes: Top 15 enriched GO BP terms are showed in the bar plot of each disease state in each tissue. Each row represents a significant GO biological process which is colored according to the -log10(p.adjust).
ColorectumFAPGO analysis - Figure of enriched GO biological processes: Top 15 enriched GO BP terms are showed in the bar plot of each disease state in each tissue. Each row represents a significant GO biological process which is colored according to the -log10(p.adjust).
∗Top 15 enriched GO BP terms are showed in the bar plot of each disease state in each tissue. Each row represents a significant GO biological process which is colored according to the -log10(p.adjust).
Page: 1 2 3 4 5 6 7 8 9 

check button Enriched GO biological processes.
GO IDTissueDisease StageDescriptionGene RatioBg Ratiopvaluep.adjustCount
GO:00512359CervixCCmaintenance of location78/2311327/187235.18e-094.92e-0778
GO:003367410CervixCCpositive regulation of kinase activity101/2311467/187238.66e-097.22e-07101
GO:00458608CervixCCpositive regulation of protein kinase activity85/2311386/187235.61e-083.29e-0685
GO:00345048CervixCCprotein localization to nucleus68/2311290/187239.91e-085.25e-0668
GO:00454445CervixCCfat cell differentiation53/2311229/187233.72e-069.75e-0553
GO:19016538CervixCCcellular response to peptide72/2311359/187231.89e-053.48e-0472
GO:00512713CervixCCnegative regulation of cellular component movement73/2311367/187232.22e-053.95e-0473
GO:00400133CervixCCnegative regulation of locomotion76/2311391/187233.47e-055.60e-0476
GO:20001463CervixCCnegative regulation of cell motility71/2311359/187233.47e-055.60e-0471
GO:00303363CervixCCnegative regulation of cell migration68/2311344/187235.11e-057.70e-0468
GO:00434349CervixCCresponse to peptide hormone77/2311414/187231.40e-041.70e-0377
GO:00713757CervixCCcellular response to peptide hormone stimulus57/2311290/187232.32e-042.59e-0357
GO:00328698CervixCCcellular response to insulin stimulus42/2311203/187234.95e-044.83e-0342
GO:00518964CervixCCregulation of protein kinase B signaling39/2311185/187235.25e-045.10e-0339
GO:00518973CervixCCpositive regulation of protein kinase B signaling28/2311120/187235.90e-045.59e-0328
GO:00434913CervixCCprotein kinase B signaling43/2311211/187235.95e-045.60e-0343
GO:00328688CervixCCresponse to insulin50/2311264/187231.28e-031.02e-0250
GO:00108834CervixCCregulation of lipid storage15/231157/187233.13e-032.05e-0215
GO:00082865CervixCCinsulin receptor signaling pathway25/2311116/187233.59e-032.30e-0225
GO:00347645CervixCCpositive regulation of transmembrane transport40/2311219/187236.97e-033.76e-0240
Page: 1 2 3 4 5 6 7 8 9 10 11 12 13 14 15 16 17 18 19 20 21 22 23 24 25 26 27 28 29 30 31 32 33 34 35 36 37 

check button Enriched KEGG pathways.
Pathway IDTissueDisease StageDescriptionGene RatioBg Ratiopvaluep.adjustqvalueCount
Page: 1 

Top

Cell-cell communication analysis

check buttonIdentification of potential cell-cell interactions between two cell types and their ligand-receptor pairs for different disease states
LigandReceptorLRpairPathwayTissueDisease Stage
Page: 1 

Top

Single-cell gene regulatory network inference analysis

check buttonFind out the significant the regulons (TFs) and the target genes of each regulon across cell types for different disease states
TFCell TypeTissueDisease StageTarget GeneRSSRegulon Activity
∗The dot plots of a searched regulon are shown for all cell subpopulations in each disease state of each tissue based on the regulon specific score inferred using pySCENIC and by calculating the average expression.
Page: 1 

Top

Somatic mutation of malignant transformation related genes

check buttonAnnotation of somatic variants for genes involved in malignant transformation
Hugo SymbolVariant ClassVariant ClassificationdbSNP RSHGVScHGVSpHGVSp ShortSWISSPROTBIOTYPESIFTPolyPhenTumor Sample BarcodeTissueHistologySexAgeStageTherapy TypesDrugsOutcome
OSBPSNVMissense_Mutationc.1295N>Gp.Ser432Cysp.S432CP22059protein_codingdeleterious(0)probably_damaging(0.998)TCGA-A8-A095-01Breastbreast invasive carcinomaFemale<65I/IIChemotherapy5-fluorouracilCR
OSBPSNVMissense_Mutationrs765405208c.2255N>Tp.Ala752Valp.A752VP22059protein_codingtolerated(0.07)possibly_damaging(0.523)TCGA-2W-A8YY-01Cervixcervical & endocervical cancerFemale<65I/IIChemotherapycisplatinCR
OSBPSNVMissense_Mutationnovelc.1429N>Ap.Ala477Thrp.A477TP22059protein_codingdeleterious(0.03)probably_damaging(0.992)TCGA-2W-A8YY-01Cervixcervical & endocervical cancerFemale<65I/IIChemotherapycisplatinCR
OSBPSNVMissense_Mutationnovelc.866N>Cp.Lys289Thrp.K289TP22059protein_codingdeleterious(0)possibly_damaging(0.864)TCGA-2W-A8YY-01Cervixcervical & endocervical cancerFemale<65I/IIChemotherapycisplatinCR
OSBPSNVMissense_Mutationc.2163N>Tp.Gln721Hisp.Q721HP22059protein_codingdeleterious(0)probably_damaging(0.997)TCGA-C5-A1BQ-01Cervixcervical & endocervical cancerFemale>=65III/IVChemotherapycisplatinCR
OSBPSNVMissense_Mutationc.1618N>Tp.Arg540Cysp.R540CP22059protein_codingdeleterious(0)probably_damaging(0.959)TCGA-EK-A2PM-01Cervixcervical & endocervical cancerFemale>=65I/IIUnknownUnknownSD
OSBPSNVMissense_Mutationc.2163N>Cp.Gln721Hisp.Q721HP22059protein_codingdeleterious(0)probably_damaging(0.997)TCGA-Q1-A73O-01Cervixcervical & endocervical cancerFemale<65I/IIChemotherapycisplatinCR
OSBPSNVMissense_Mutationnovelc.209N>Gp.Pro70Argp.P70RP22059protein_codingtolerated_low_confidence(0.12)benign(0.02)TCGA-VS-A958-01Cervixcervical & endocervical cancerFemale<65I/IIChemotherapycisplatinCR
OSBPSNVMissense_Mutationnovelc.208N>Ap.Pro70Thrp.P70TP22059protein_codingtolerated_low_confidence(0.17)benign(0.007)TCGA-VS-A958-01Cervixcervical & endocervical cancerFemale<65I/IIChemotherapycisplatinCR
OSBPSNVMissense_Mutationnovelc.1567N>Tp.His523Tyrp.H523YP22059protein_codingdeleterious(0)probably_damaging(1)TCGA-VS-A9UO-01Cervixcervical & endocervical cancerFemale<65I/IIChemotherapycisplatinCR
Page: 1 2 3 4 5 6 7 8 

Top

Related drugs of malignant transformation related genes

check buttonIdentification of chemicals and drugs interact with genes involved in malignant transfromation
(DGIdb 4.0)
Entrez IDSymbolCategoryInteraction TypesDrug Claim NameDrug NamePMIDs
Page: 1