| Tissue | Expression Dynamics | Abbreviation |
| Endometrium | 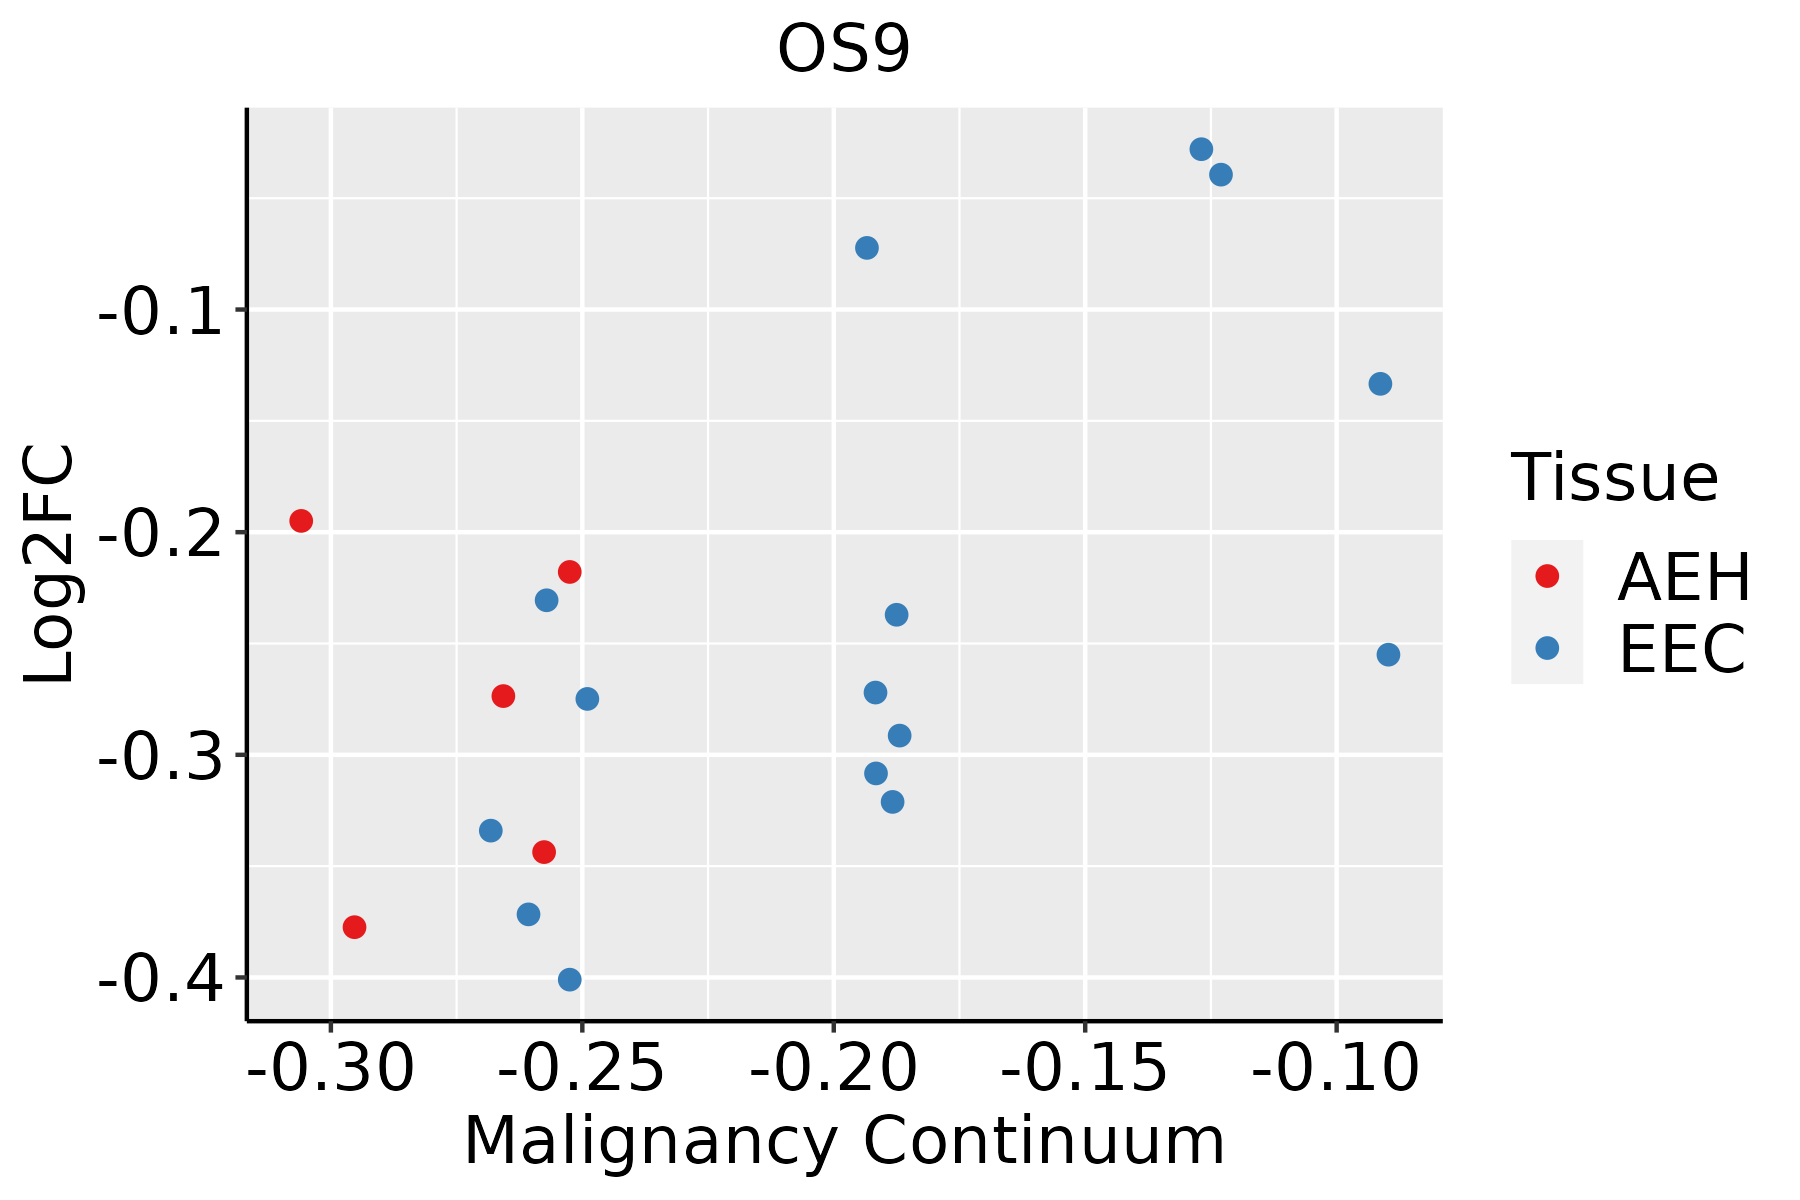 | AEH: Atypical endometrial hyperplasia |
| EEC: Endometrioid Cancer |
| Esophagus |  | ESCC: Esophageal squamous cell carcinoma |
| HGIN: High-grade intraepithelial neoplasias |
| LGIN: Low-grade intraepithelial neoplasias |
| Liver | 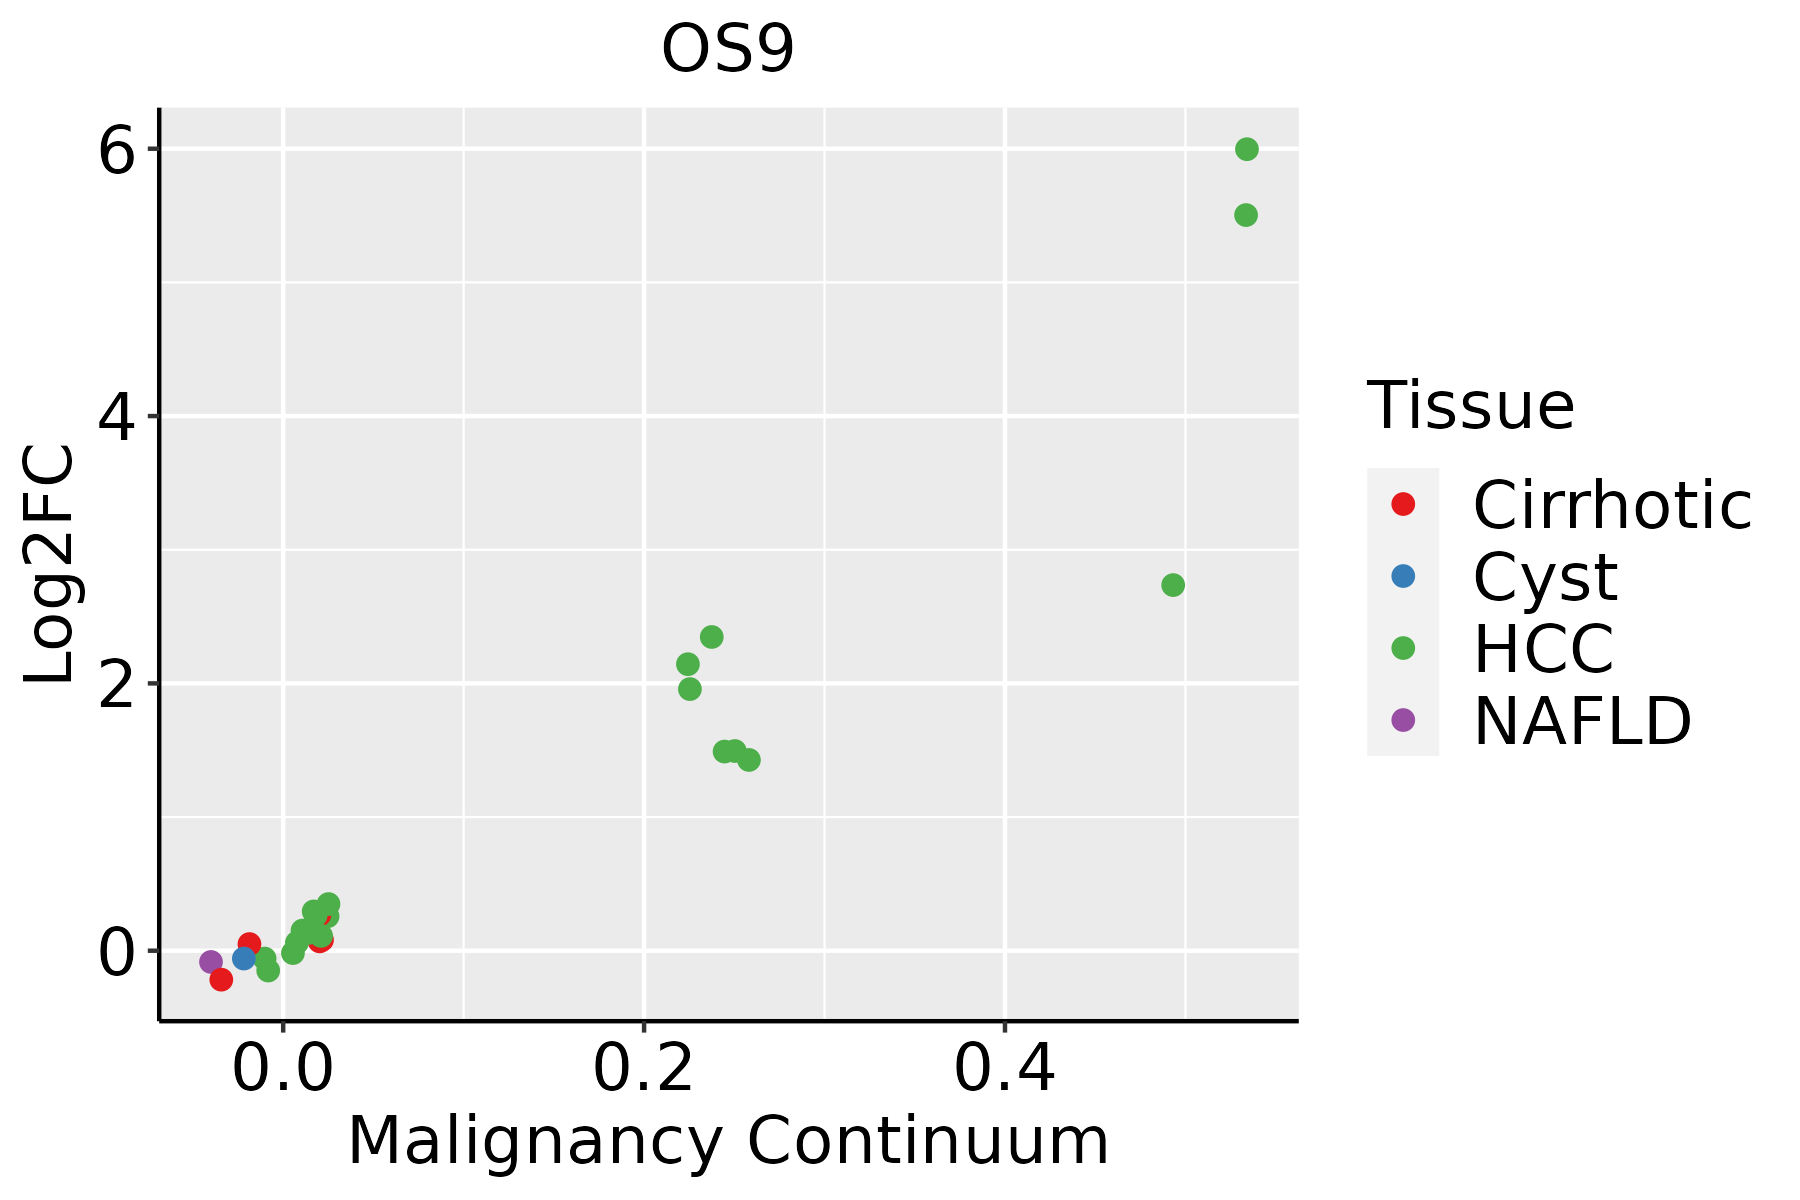 | HCC: Hepatocellular carcinoma |
| NAFLD: Non-alcoholic fatty liver disease |
| Oral Cavity | 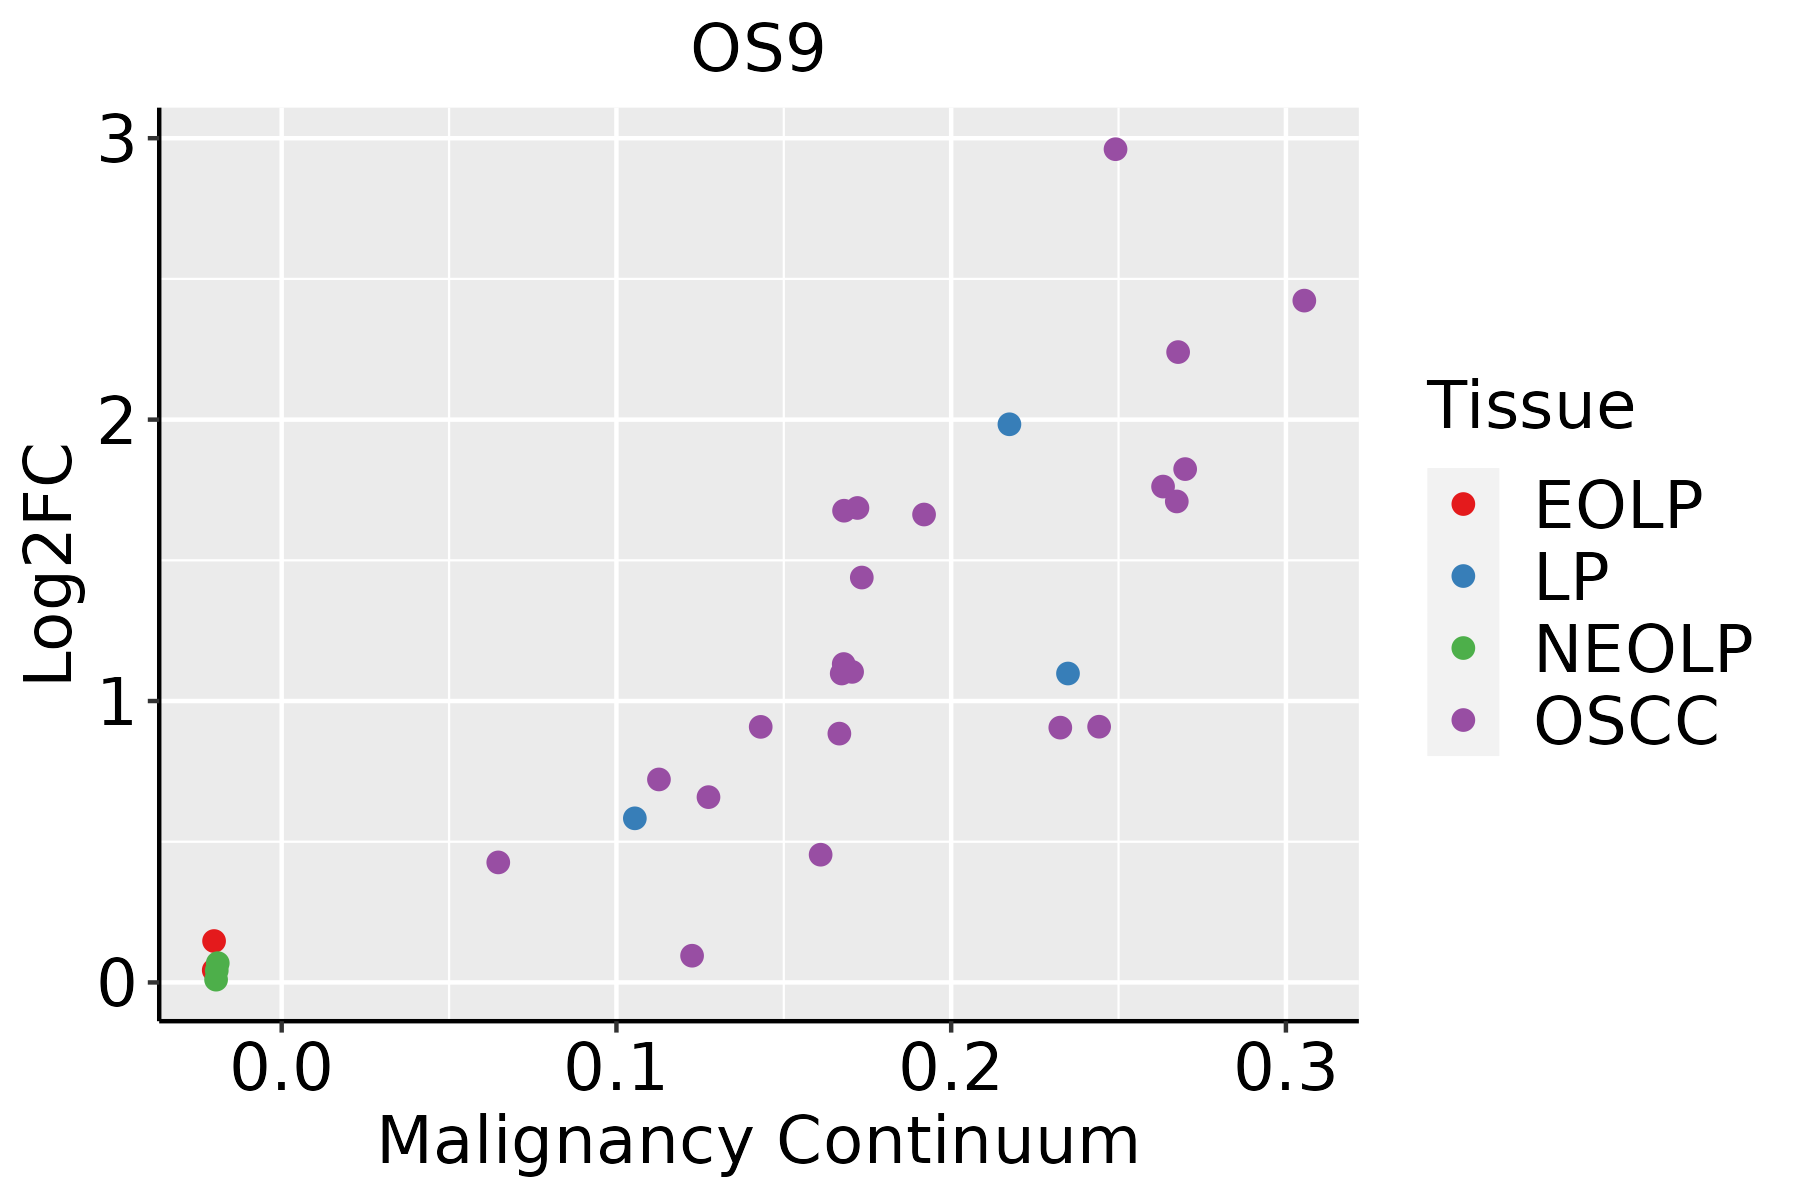 | EOLP: Erosive Oral lichen planus |
| LP: leukoplakia |
| NEOLP: Non-erosive oral lichen planus |
| OSCC: Oral squamous cell carcinoma |
| Prostate | 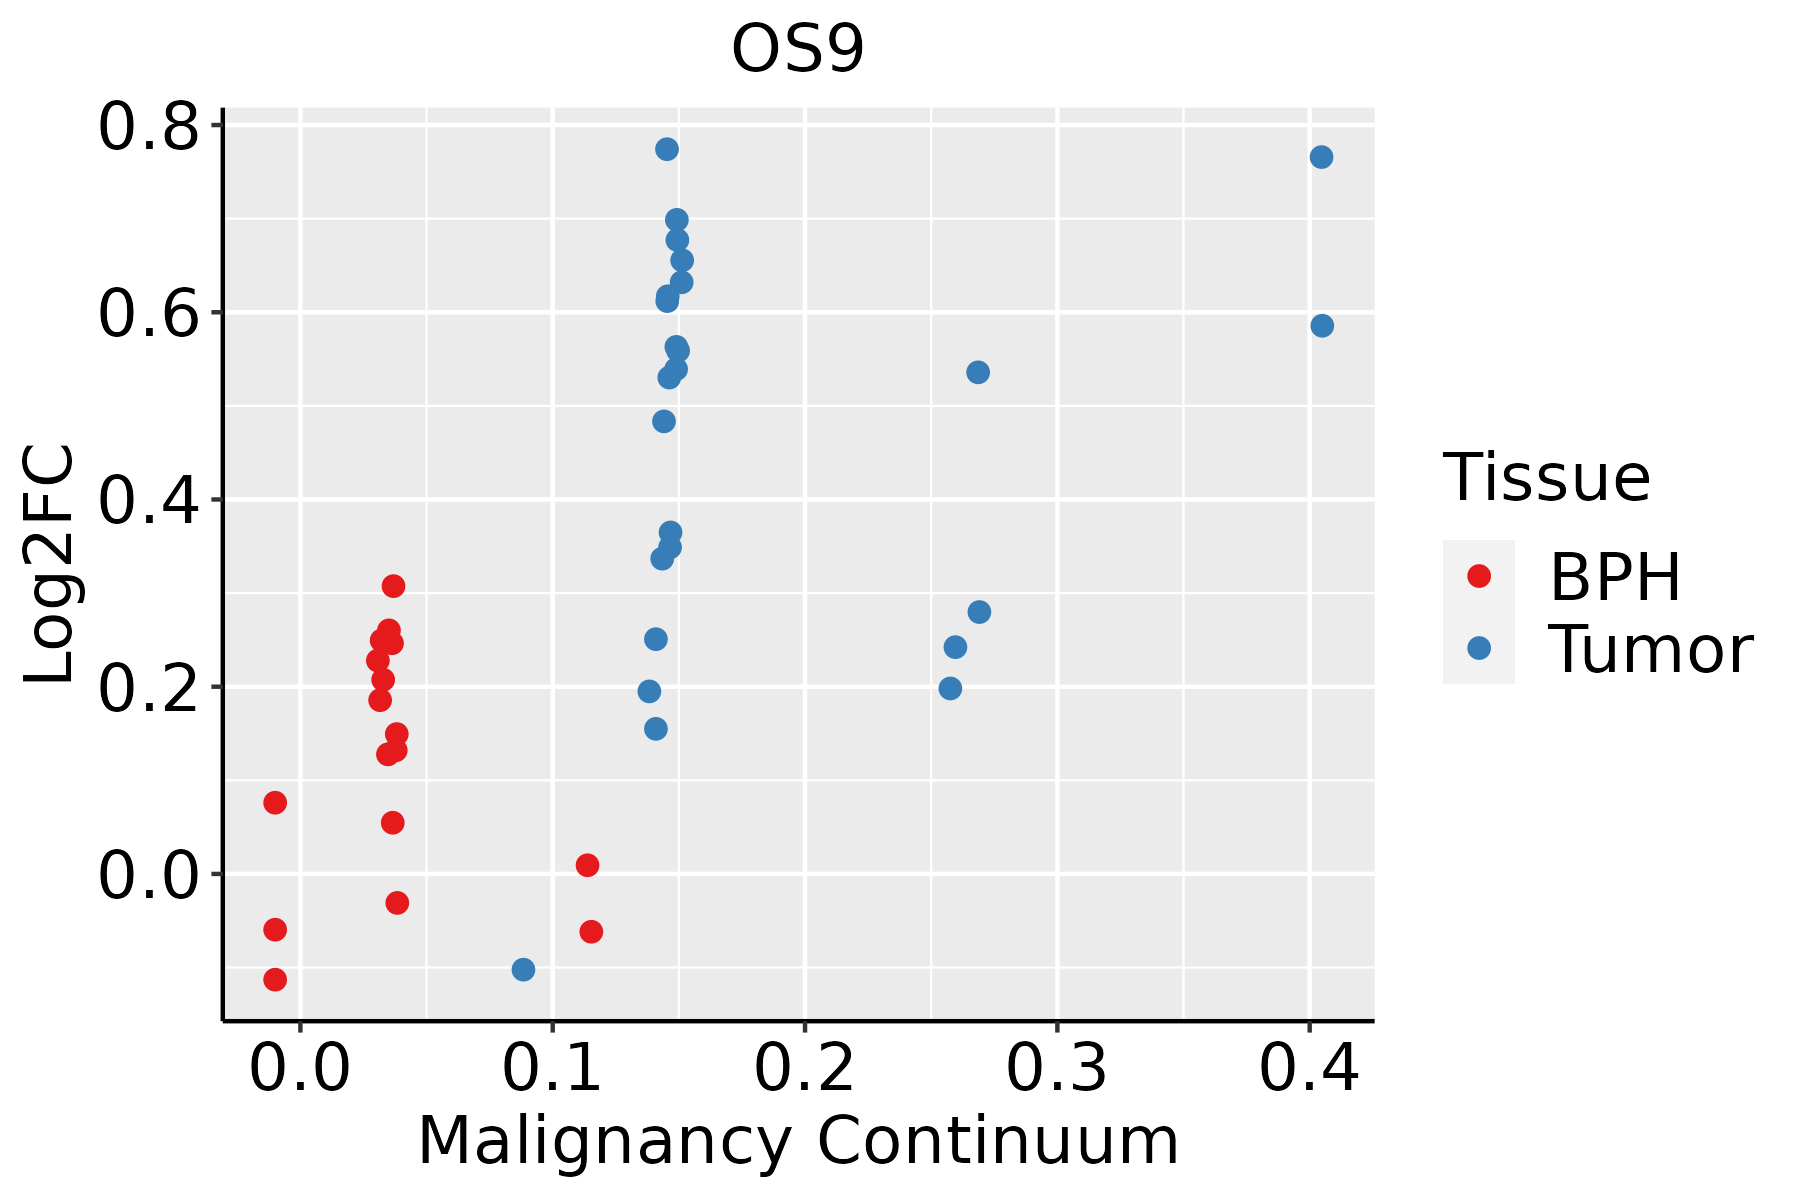 | BPH: Benign Prostatic Hyperplasia |
| Skin | 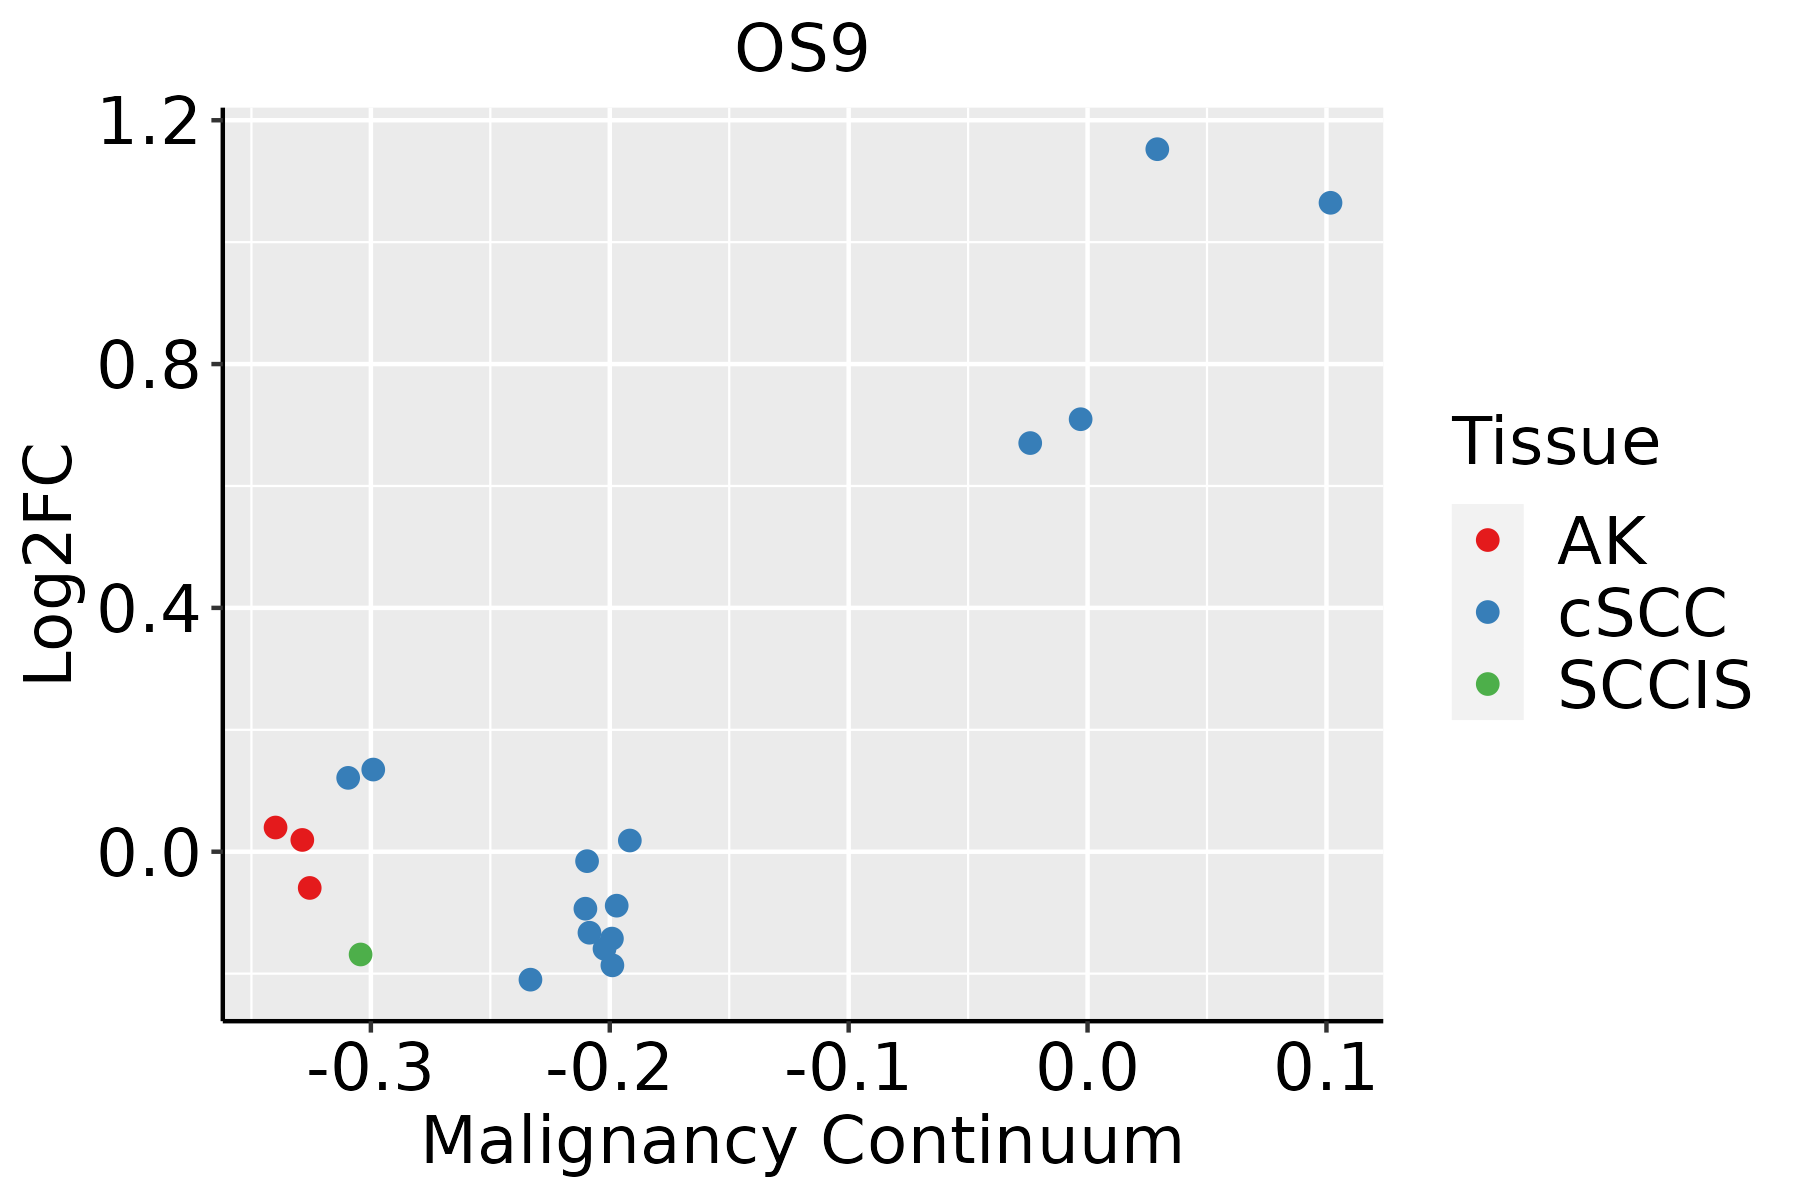 | AK: Actinic keratosis |
| cSCC: Cutaneous squamous cell carcinoma |
| SCCIS:squamous cell carcinoma in situ |
| Thyroid | 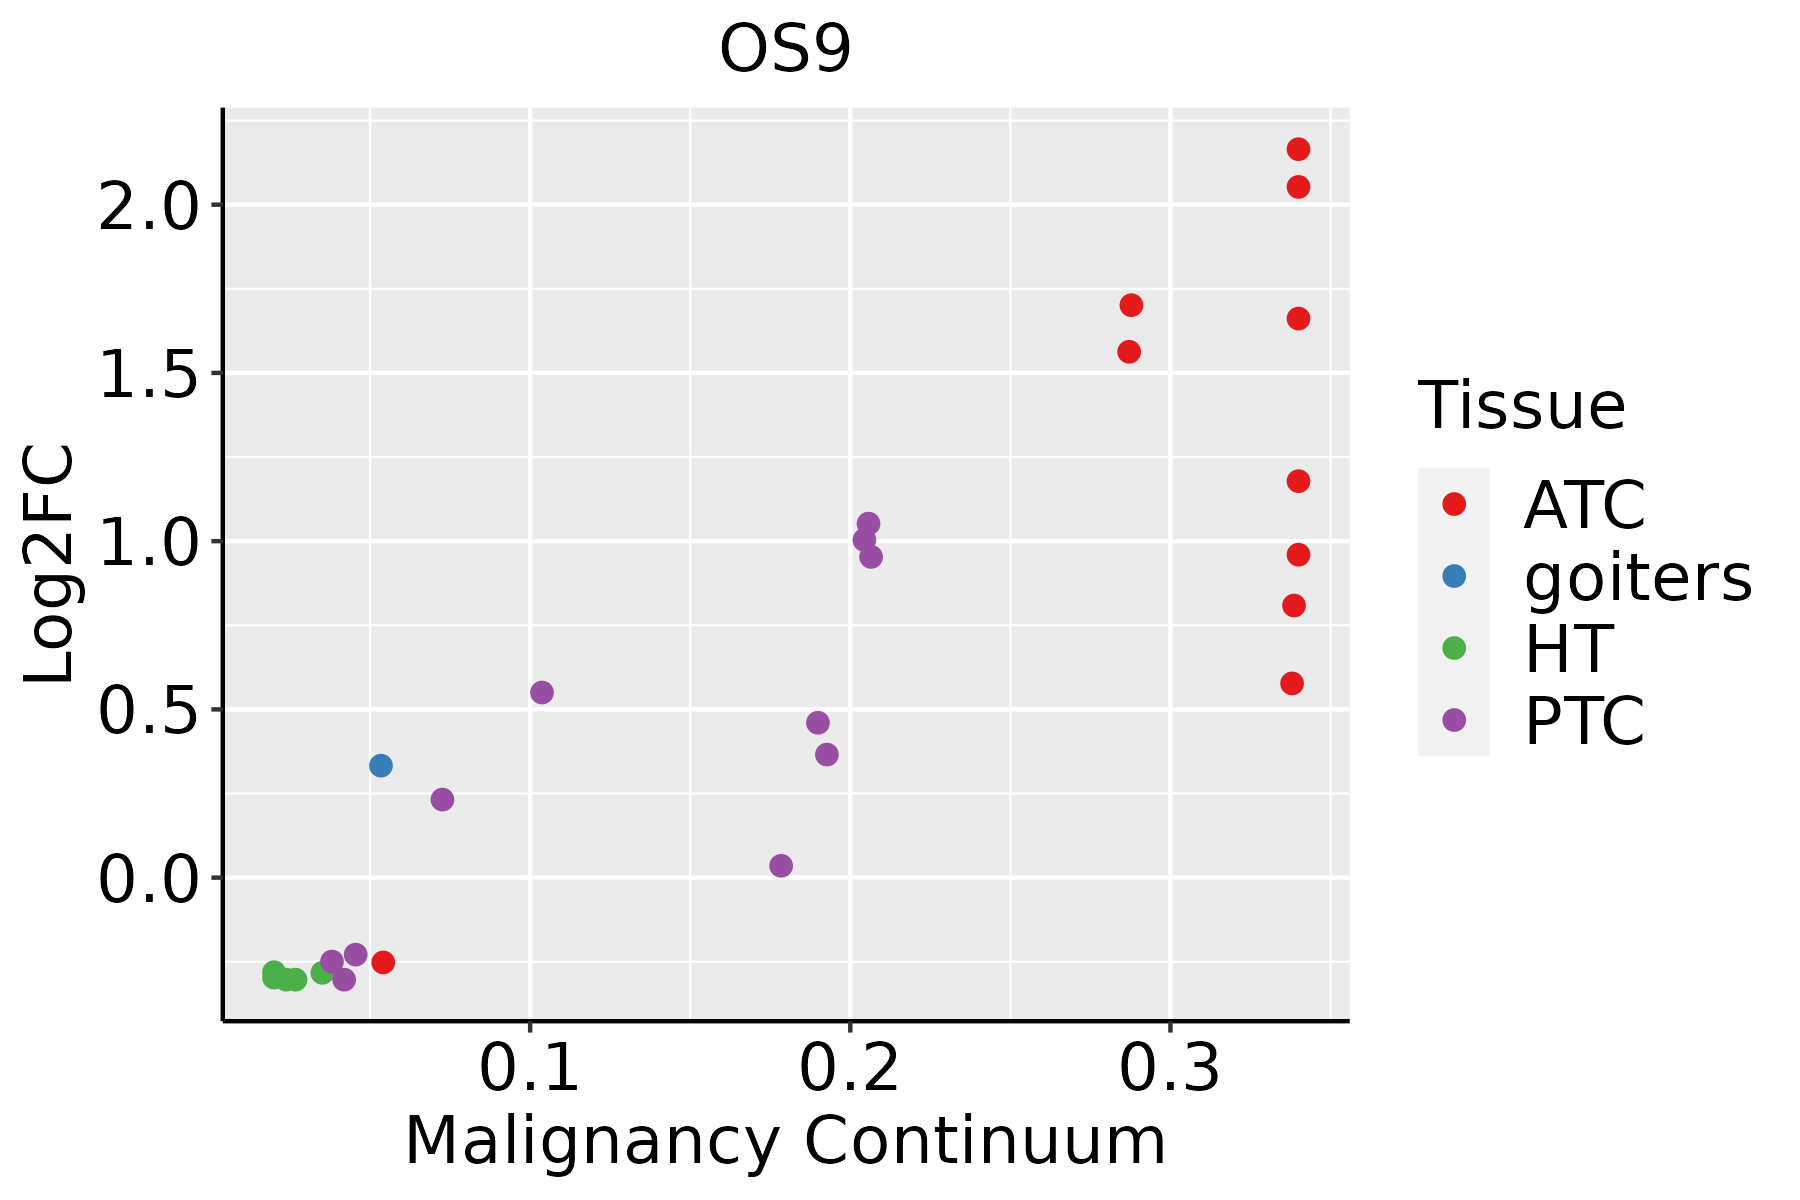 | ATC: Anaplastic thyroid cancer |
| HT: Hashimoto's thyroiditis |
| PTC: Papillary thyroid cancer |
| GO ID | Tissue | Disease Stage | Description | Gene Ratio | Bg Ratio | pvalue | p.adjust | Count |
| GO:001049816 | Endometrium | AEH | proteasomal protein catabolic process | 108/2100 | 490/18723 | 2.73e-12 | 4.67e-10 | 108 |
| GO:004316116 | Endometrium | AEH | proteasome-mediated ubiquitin-dependent protein catabolic process | 88/2100 | 412/18723 | 1.54e-09 | 1.36e-07 | 88 |
| GO:003497616 | Endometrium | AEH | response to endoplasmic reticulum stress | 62/2100 | 256/18723 | 2.88e-09 | 2.13e-07 | 62 |
| GO:000660516 | Endometrium | AEH | protein targeting | 68/2100 | 314/18723 | 6.30e-08 | 3.38e-06 | 68 |
| GO:003315710 | Endometrium | AEH | regulation of intracellular protein transport | 51/2100 | 229/18723 | 1.13e-06 | 3.75e-05 | 51 |
| GO:003596616 | Endometrium | AEH | response to topologically incorrect protein | 39/2100 | 159/18723 | 1.69e-06 | 5.23e-05 | 39 |
| GO:000698616 | Endometrium | AEH | response to unfolded protein | 35/2100 | 137/18723 | 2.09e-06 | 6.28e-05 | 35 |
| GO:004518516 | Endometrium | AEH | maintenance of protein location | 27/2100 | 94/18723 | 2.78e-06 | 7.89e-05 | 27 |
| GO:00709727 | Endometrium | AEH | protein localization to endoplasmic reticulum | 23/2100 | 74/18723 | 3.44e-06 | 9.24e-05 | 23 |
| GO:00323869 | Endometrium | AEH | regulation of intracellular transport | 66/2100 | 337/18723 | 4.18e-06 | 1.10e-04 | 66 |
| GO:00325078 | Endometrium | AEH | maintenance of protein location in cell | 21/2100 | 65/18723 | 4.56e-06 | 1.18e-04 | 21 |
| GO:003462015 | Endometrium | AEH | cellular response to unfolded protein | 25/2100 | 96/18723 | 4.07e-05 | 6.97e-04 | 25 |
| GO:005165116 | Endometrium | AEH | maintenance of location in cell | 44/2100 | 214/18723 | 4.84e-05 | 7.94e-04 | 44 |
| GO:003596716 | Endometrium | AEH | cellular response to topologically incorrect protein | 28/2100 | 116/18723 | 6.38e-05 | 9.94e-04 | 28 |
| GO:005123510 | Endometrium | AEH | maintenance of location | 60/2100 | 327/18723 | 8.19e-05 | 1.22e-03 | 60 |
| GO:00725956 | Endometrium | AEH | maintenance of protein localization in organelle | 14/2100 | 42/18723 | 1.20e-04 | 1.67e-03 | 14 |
| GO:00510515 | Endometrium | AEH | negative regulation of transport | 79/2100 | 470/18723 | 1.51e-04 | 1.99e-03 | 79 |
| GO:00365033 | Endometrium | AEH | ERAD pathway | 23/2100 | 107/18723 | 1.55e-03 | 1.27e-02 | 23 |
| GO:00354375 | Endometrium | AEH | maintenance of protein localization in endoplasmic reticulum | 6/2100 | 14/18723 | 2.67e-03 | 1.94e-02 | 6 |
| GO:00309689 | Endometrium | AEH | endoplasmic reticulum unfolded protein response | 17/2100 | 74/18723 | 2.92e-03 | 2.08e-02 | 17 |
| Pathway ID | Tissue | Disease Stage | Description | Gene Ratio | Bg Ratio | pvalue | p.adjust | qvalue | Count |
| hsa0414126 | Endometrium | AEH | Protein processing in endoplasmic reticulum | 62/1197 | 174/8465 | 5.97e-13 | 1.39e-11 | 1.01e-11 | 62 |
| hsa04141111 | Endometrium | AEH | Protein processing in endoplasmic reticulum | 62/1197 | 174/8465 | 5.97e-13 | 1.39e-11 | 1.01e-11 | 62 |
| hsa0414127 | Endometrium | EEC | Protein processing in endoplasmic reticulum | 64/1237 | 174/8465 | 2.17e-13 | 5.09e-12 | 3.80e-12 | 64 |
| hsa0414136 | Endometrium | EEC | Protein processing in endoplasmic reticulum | 64/1237 | 174/8465 | 2.17e-13 | 5.09e-12 | 3.80e-12 | 64 |
| hsa04141211 | Esophagus | ESCC | Protein processing in endoplasmic reticulum | 147/4205 | 174/8465 | 3.29e-22 | 1.10e-19 | 5.64e-20 | 147 |
| hsa04141310 | Esophagus | ESCC | Protein processing in endoplasmic reticulum | 147/4205 | 174/8465 | 3.29e-22 | 1.10e-19 | 5.64e-20 | 147 |
| hsa0414114 | Liver | Cirrhotic | Protein processing in endoplasmic reticulum | 114/2530 | 174/8465 | 1.16e-22 | 9.67e-21 | 5.96e-21 | 114 |
| hsa0414115 | Liver | Cirrhotic | Protein processing in endoplasmic reticulum | 114/2530 | 174/8465 | 1.16e-22 | 9.67e-21 | 5.96e-21 | 114 |
| hsa0414122 | Liver | HCC | Protein processing in endoplasmic reticulum | 146/4020 | 174/8465 | 7.34e-24 | 2.46e-21 | 1.37e-21 | 146 |
| hsa0414132 | Liver | HCC | Protein processing in endoplasmic reticulum | 146/4020 | 174/8465 | 7.34e-24 | 2.46e-21 | 1.37e-21 | 146 |
| hsa0414130 | Oral cavity | OSCC | Protein processing in endoplasmic reticulum | 143/3704 | 174/8465 | 6.82e-26 | 2.28e-23 | 1.16e-23 | 143 |
| hsa04141113 | Oral cavity | OSCC | Protein processing in endoplasmic reticulum | 143/3704 | 174/8465 | 6.82e-26 | 2.28e-23 | 1.16e-23 | 143 |
| hsa04141210 | Oral cavity | LP | Protein processing in endoplasmic reticulum | 113/2418 | 174/8465 | 8.74e-24 | 5.82e-22 | 3.76e-22 | 113 |
| hsa0414138 | Oral cavity | LP | Protein processing in endoplasmic reticulum | 113/2418 | 174/8465 | 8.74e-24 | 5.82e-22 | 3.76e-22 | 113 |
| hsa0414145 | Oral cavity | EOLP | Protein processing in endoplasmic reticulum | 70/1218 | 174/8465 | 2.84e-17 | 3.06e-15 | 1.81e-15 | 70 |
| hsa0414155 | Oral cavity | EOLP | Protein processing in endoplasmic reticulum | 70/1218 | 174/8465 | 2.84e-17 | 3.06e-15 | 1.81e-15 | 70 |
| hsa0414128 | Prostate | BPH | Protein processing in endoplasmic reticulum | 97/1718 | 174/8465 | 2.37e-25 | 1.30e-23 | 8.07e-24 | 97 |
| hsa04141112 | Prostate | BPH | Protein processing in endoplasmic reticulum | 97/1718 | 174/8465 | 2.37e-25 | 1.30e-23 | 8.07e-24 | 97 |
| hsa0414129 | Prostate | Tumor | Protein processing in endoplasmic reticulum | 99/1791 | 174/8465 | 2.58e-25 | 1.71e-23 | 1.06e-23 | 99 |
| hsa0414137 | Prostate | Tumor | Protein processing in endoplasmic reticulum | 99/1791 | 174/8465 | 2.58e-25 | 1.71e-23 | 1.06e-23 | 99 |
| Hugo Symbol | Variant Class | Variant Classification | dbSNP RS | HGVSc | HGVSp | HGVSp Short | SWISSPROT | BIOTYPE | SIFT | PolyPhen | Tumor Sample Barcode | Tissue | Histology | Sex | Age | Stage | Therapy Types | Drugs | Outcome |
| OS9 | SNV | Missense_Mutation | | c.451G>A | p.Ala151Thr | p.A151T | Q13438 | protein_coding | tolerated(0.07) | benign(0.037) | TCGA-AN-A0AK-01 | Breast | breast invasive carcinoma | Female | >=65 | I/II | Unknown | Unknown | SD |
| OS9 | SNV | Missense_Mutation | novel | c.74C>G | p.Thr25Ser | p.T25S | Q13438 | protein_coding | tolerated(0.82) | benign(0.197) | TCGA-AQ-A54O-01 | Breast | breast invasive carcinoma | Male | <65 | I/II | Chemotherapy | adriamycin | CR |
| OS9 | SNV | Missense_Mutation | | c.1261N>A | p.Glu421Lys | p.E421K | Q13438 | protein_coding | tolerated(0.22) | benign(0.034) | TCGA-E2-A159-01 | Breast | breast invasive carcinoma | Female | <65 | I/II | Chemotherapy | cyclophosphamide | SD |
| OS9 | insertion | Frame_Shift_Ins | novel | c.1757_1758insCACTCTCAACAAACTCATCAAA | p.Ala587ThrfsTer13 | p.A587Tfs*13 | Q13438 | protein_coding | | | TCGA-A2-A04Y-01 | Breast | breast invasive carcinoma | Female | <65 | I/II | Chemotherapy | cytoxan | SD |
| OS9 | insertion | In_Frame_Ins | novel | c.1979_1980insTAAATTATTTCTTCTTCTTGTATCCCCTTGTGTCCATTTCATAGT | p.Gly660_Asp661insLysLeuPheLeuLeuLeuValSerProCysValHisPheIleVal | p.G660_D661insKLFLLLVSPCVHFIV | Q13438 | protein_coding | | | TCGA-A2-A0CP-01 | Breast | breast invasive carcinoma | Female | <65 | I/II | Chemotherapy | cytoxan | SD |
| OS9 | insertion | Nonsense_Mutation | novel | c.1744_1745insCAGTAGAAGGCCTGGAACTGAATAAACTAAATGGTTAATATTTGT | p.Arg582delinsThrValGluGlyLeuGluLeuAsnLysLeuAsnGlyTerTyrLeuTrp | p.R582delinsTVEGLELNKLNG*YLW | Q13438 | protein_coding | | | TCGA-A8-A079-01 | Breast | breast invasive carcinoma | Female | >=65 | III/IV | Chemotherapy | 5-fluorouracil | SD |
| OS9 | insertion | Frame_Shift_Ins | novel | c.1994_1995insGGGA | p.Phe665LeufsTer3 | p.F665Lfs*3 | Q13438 | protein_coding | | | TCGA-AN-A0FL-01 | Breast | breast invasive carcinoma | Female | <65 | I/II | Unknown | Unknown | SD |
| OS9 | insertion | Nonsense_Mutation | novel | c.1996_1997insGAGGGGAGAGCTAAGCCTGGGAGGGAGGTTGGGT | p.Asp666GlyfsTer5 | p.D666Gfs*5 | Q13438 | protein_coding | | | TCGA-AN-A0FL-01 | Breast | breast invasive carcinoma | Female | <65 | I/II | Unknown | Unknown | SD |
| OS9 | SNV | Missense_Mutation | rs770299465 | c.497N>A | p.Arg166His | p.R166H | Q13438 | protein_coding | deleterious(0) | probably_damaging(0.996) | TCGA-2W-A8YY-01 | Cervix | cervical & endocervical cancer | Female | <65 | I/II | Chemotherapy | cisplatin | CR |
| OS9 | SNV | Missense_Mutation | novel | c.1789N>T | p.Arg597Cys | p.R597C | Q13438 | protein_coding | deleterious(0.01) | possibly_damaging(0.828) | TCGA-2W-A8YY-01 | Cervix | cervical & endocervical cancer | Female | <65 | I/II | Chemotherapy | cisplatin | CR |


