Schematic overview of the cellular and molecular mechanisms involved in the cancer progression, including the proposed cellular and molecular mechanisms in cancer cells trajectory. AT1: alveolar type 1 cells; AT2: alveolar type 2 cells; AAH: atypical adenomatous hyperplasia; AIS: adenocarcinoma in situ; MIA: minimally invasive adenocarcinoma; IA: invasive adenocarcinoma; EMT: epithelial-mesenchymal transition

Home

Download

Statistics

Help

Contact

Center for Computational Systems Medicine
leaf

Gene summary

leaf

Malignant transformation analysis

leaf

Malignant transformation related pathway analysis

leaf

Cell-cell communication analysis

leaf

Single-cell gene regulatory network inference analysis

leaf

Somatic mutation of malignant transformation related genes

leaf

Related drugs of malignant transformation related genes

Gene: ORMDL3

Gene summary for ORMDL3

check button Gene summary.

Gene informationSpeciesHuman
Gene symbol

ORMDL3

Gene ID

94103

Gene nameORMDL sphingolipid biosynthesis regulator 3
Gene AliasORMDL3
Cytomap17q21.1
Gene Typeprotein-coding
GO ID

GO:0001783

UniProtAcc

A0A024R1W6


Top

Malignant transformation analysis

check button Identification of the aberrant gene expression in precancerous and cancerous lesions by comparing the gene expression of stem-like cells in diseased tissues with normal stem cells
check button Malignant transformation involving gene list.
Entrez IDSymbolReplicatesSpeciesOrganTissueAdj P-valueLog2FCMalignancy
94103ORMDL3GSM4909282HumanBreastIDC1.93e-02-8.32e-02-0.0288
94103ORMDL3GSM4909290HumanBreastIDC7.80e-104.03e-010.2096
94103ORMDL3GSM4909291HumanBreastIDC1.20e-501.07e+000.1753
94103ORMDL3GSM4909292HumanBreastIDC8.53e-129.14e-010.1236
94103ORMDL3GSM4909294HumanBreastIDC3.01e-104.55e-010.2022
94103ORMDL3GSM4909296HumanBreastIDC2.80e-02-1.03e-010.1524
94103ORMDL3GSM4909319HumanBreastIDC3.47e-05-5.03e-020.1563
94103ORMDL3NCCBC14HumanBreastDCIS3.25e-361.00e+000.2021
94103ORMDL3NCCBC5HumanBreastDCIS1.00e-094.30e-010.2046
94103ORMDL3P1HumanBreastIDC6.70e-04-1.11e-020.1527
94103ORMDL3DCIS2HumanBreastDCIS7.52e-351.57e-010.0085
94103ORMDL3HTA11_3410_2000001011HumanColorectumAD2.93e-061.99e-010.0155
94103ORMDL3HTA11_2487_2000001011HumanColorectumSER3.20e-114.05e-01-0.1808
94103ORMDL3HTA11_2951_2000001011HumanColorectumAD9.45e-033.08e-010.0216
94103ORMDL3HTA11_1938_2000001011HumanColorectumAD5.57e-093.74e-01-0.0811
94103ORMDL3HTA11_347_2000001011HumanColorectumAD6.20e-183.98e-01-0.1954
94103ORMDL3HTA11_411_2000001011HumanColorectumSER1.21e-077.18e-01-0.2602
94103ORMDL3HTA11_3361_2000001011HumanColorectumAD4.61e-053.12e-01-0.1207
94103ORMDL3HTA11_83_2000001011HumanColorectumSER3.74e-022.03e-01-0.1526
94103ORMDL3HTA11_696_2000001011HumanColorectumAD5.62e-184.48e-01-0.1464
Page: 1 2 3 4 5 6 7 

check button Transcriptomic changes along malignancy continuum.
TissueExpression DynamicsAbbreviation
BreastThe image shows the transcriptomic changes along malignancy continuum.log2FC in expression of this searched gene in stem-like cells from each diseased tissue sample relative to stem-like cells in normal samples in each tissue plotted against the malignancy continuum. Samples are colored based on if they are from different disease stage.
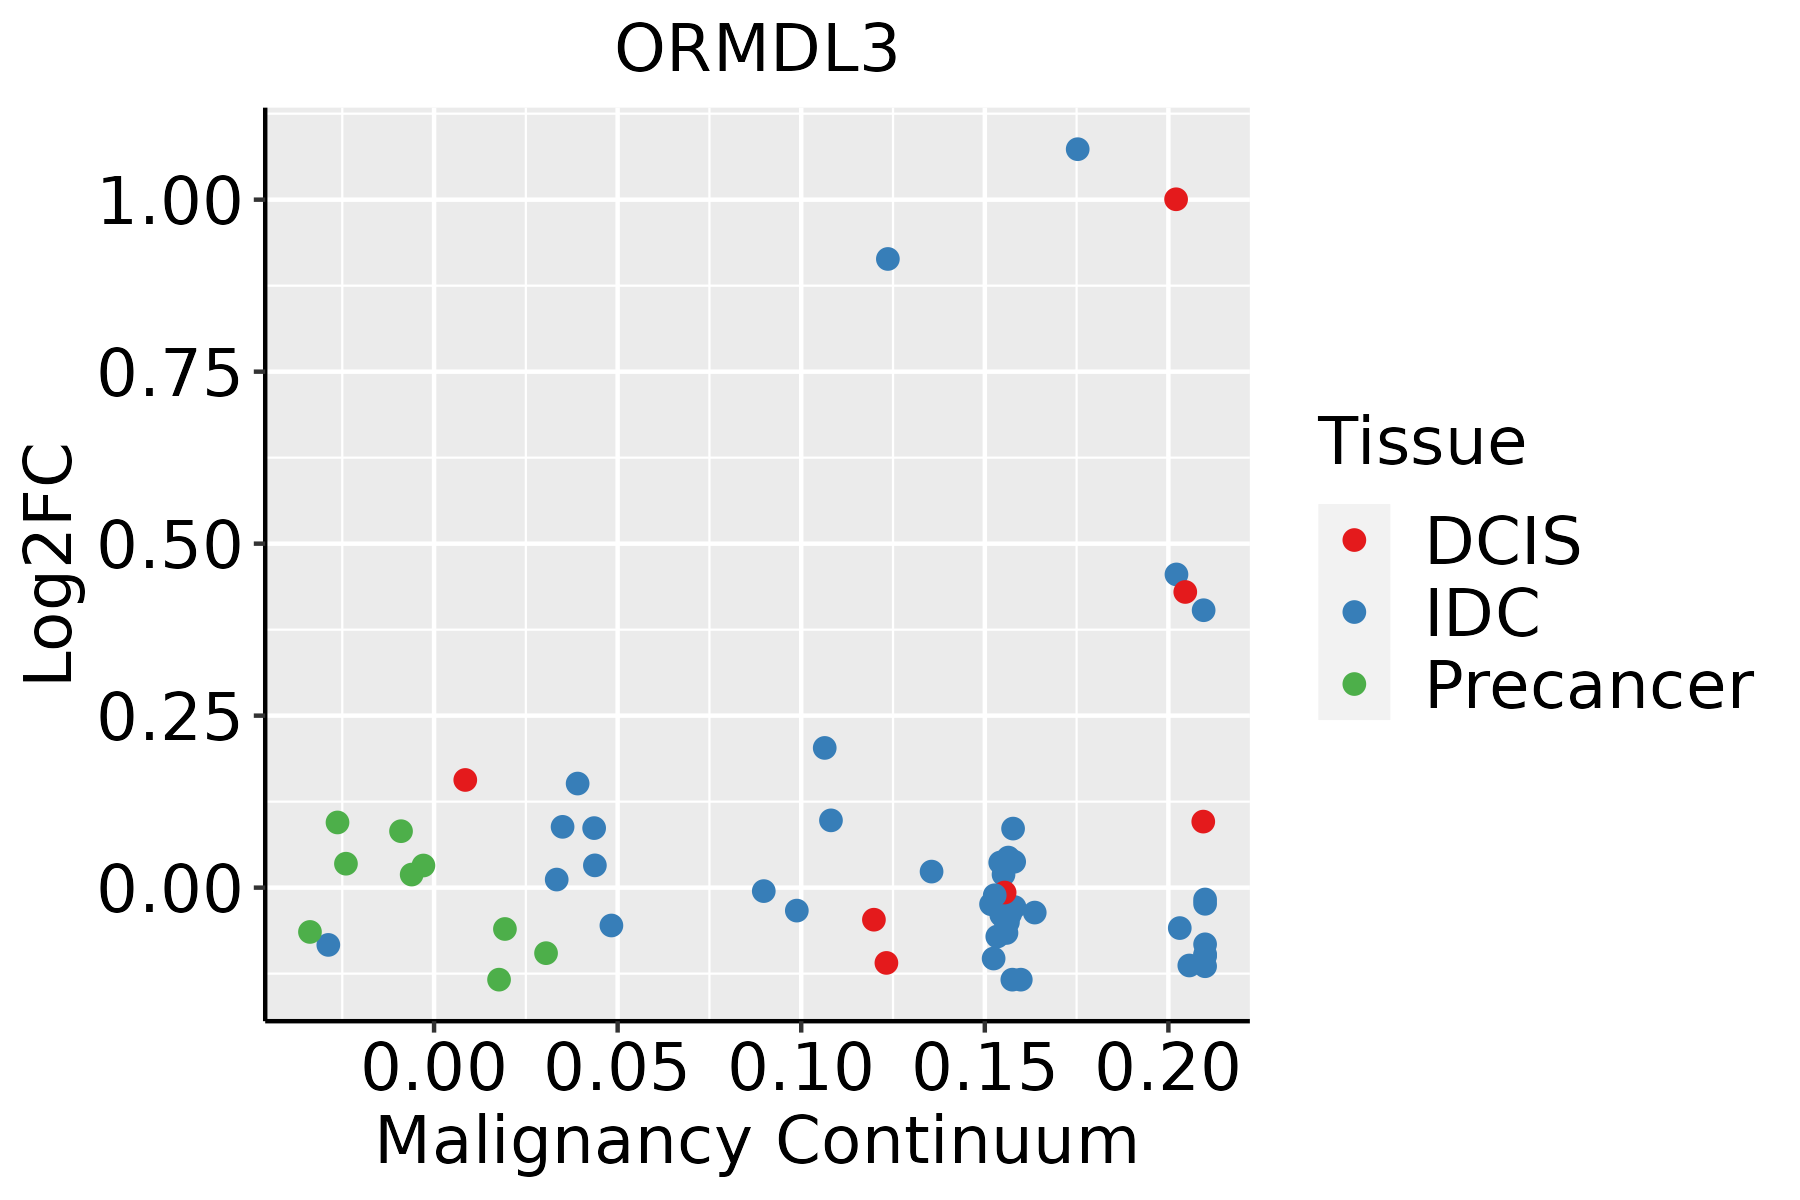
IDC: Invasive ductal carcinoma
DCIS: Ductal carcinoma in situ
Precancer(BRCA1-mut): Precancerous lesion from BRCA1 mutation carriers
Colorectum (GSE201348)The image shows the transcriptomic changes along malignancy continuum.log2FC in expression of this searched gene in stem-like cells from each diseased tissue sample relative to stem-like cells in normal samples in each tissue plotted against the malignancy continuum. Samples are colored based on if they are from different disease stage.FAP: Familial adenomatous polyposis
CRC: Colorectal cancer
Colorectum (HTA11)The image shows the transcriptomic changes along malignancy continuum.log2FC in expression of this searched gene in stem-like cells from each diseased tissue sample relative to stem-like cells in normal samples in each tissue plotted against the malignancy continuum. Samples are colored based on if they are from different disease stage.AD: Adenomas
SER: Sessile serrated lesions
MSI-H: Microsatellite-high colorectal cancer
MSS: Microsatellite stable colorectal cancer
EsophagusThe image shows the transcriptomic changes along malignancy continuum.log2FC in expression of this searched gene in stem-like cells from each diseased tissue sample relative to stem-like cells in normal samples in each tissue plotted against the malignancy continuum. Samples are colored based on if they are from different disease stage.ESCC: Esophageal squamous cell carcinoma
HGIN: High-grade intraepithelial neoplasias
LGIN: Low-grade intraepithelial neoplasias
LiverThe image shows the transcriptomic changes along malignancy continuum.log2FC in expression of this searched gene in stem-like cells from each diseased tissue sample relative to stem-like cells in normal samples in each tissue plotted against the malignancy continuum. Samples are colored based on if they are from different disease stage.
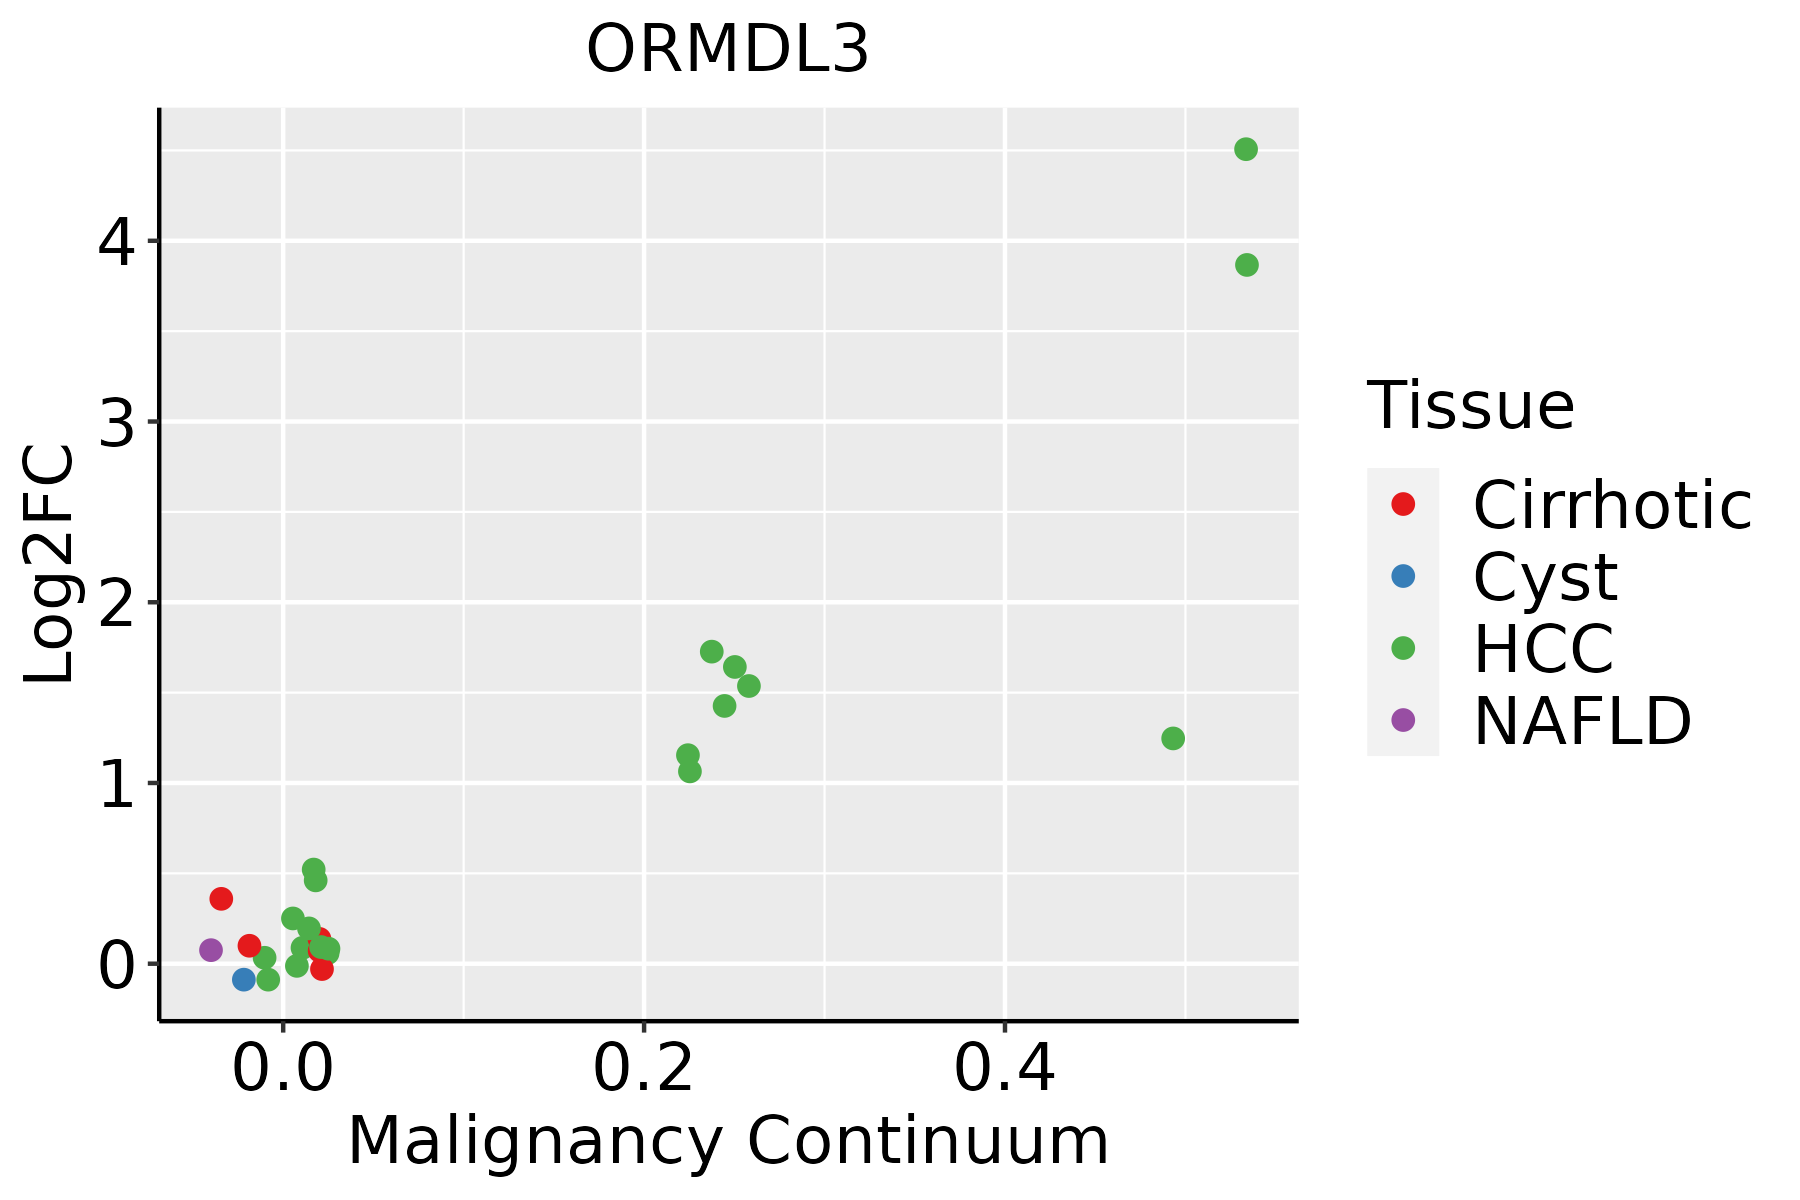
HCC: Hepatocellular carcinoma
NAFLD: Non-alcoholic fatty liver disease
Oral CavityThe image shows the transcriptomic changes along malignancy continuum.log2FC in expression of this searched gene in stem-like cells from each diseased tissue sample relative to stem-like cells in normal samples in each tissue plotted against the malignancy continuum. Samples are colored based on if they are from different disease stage.
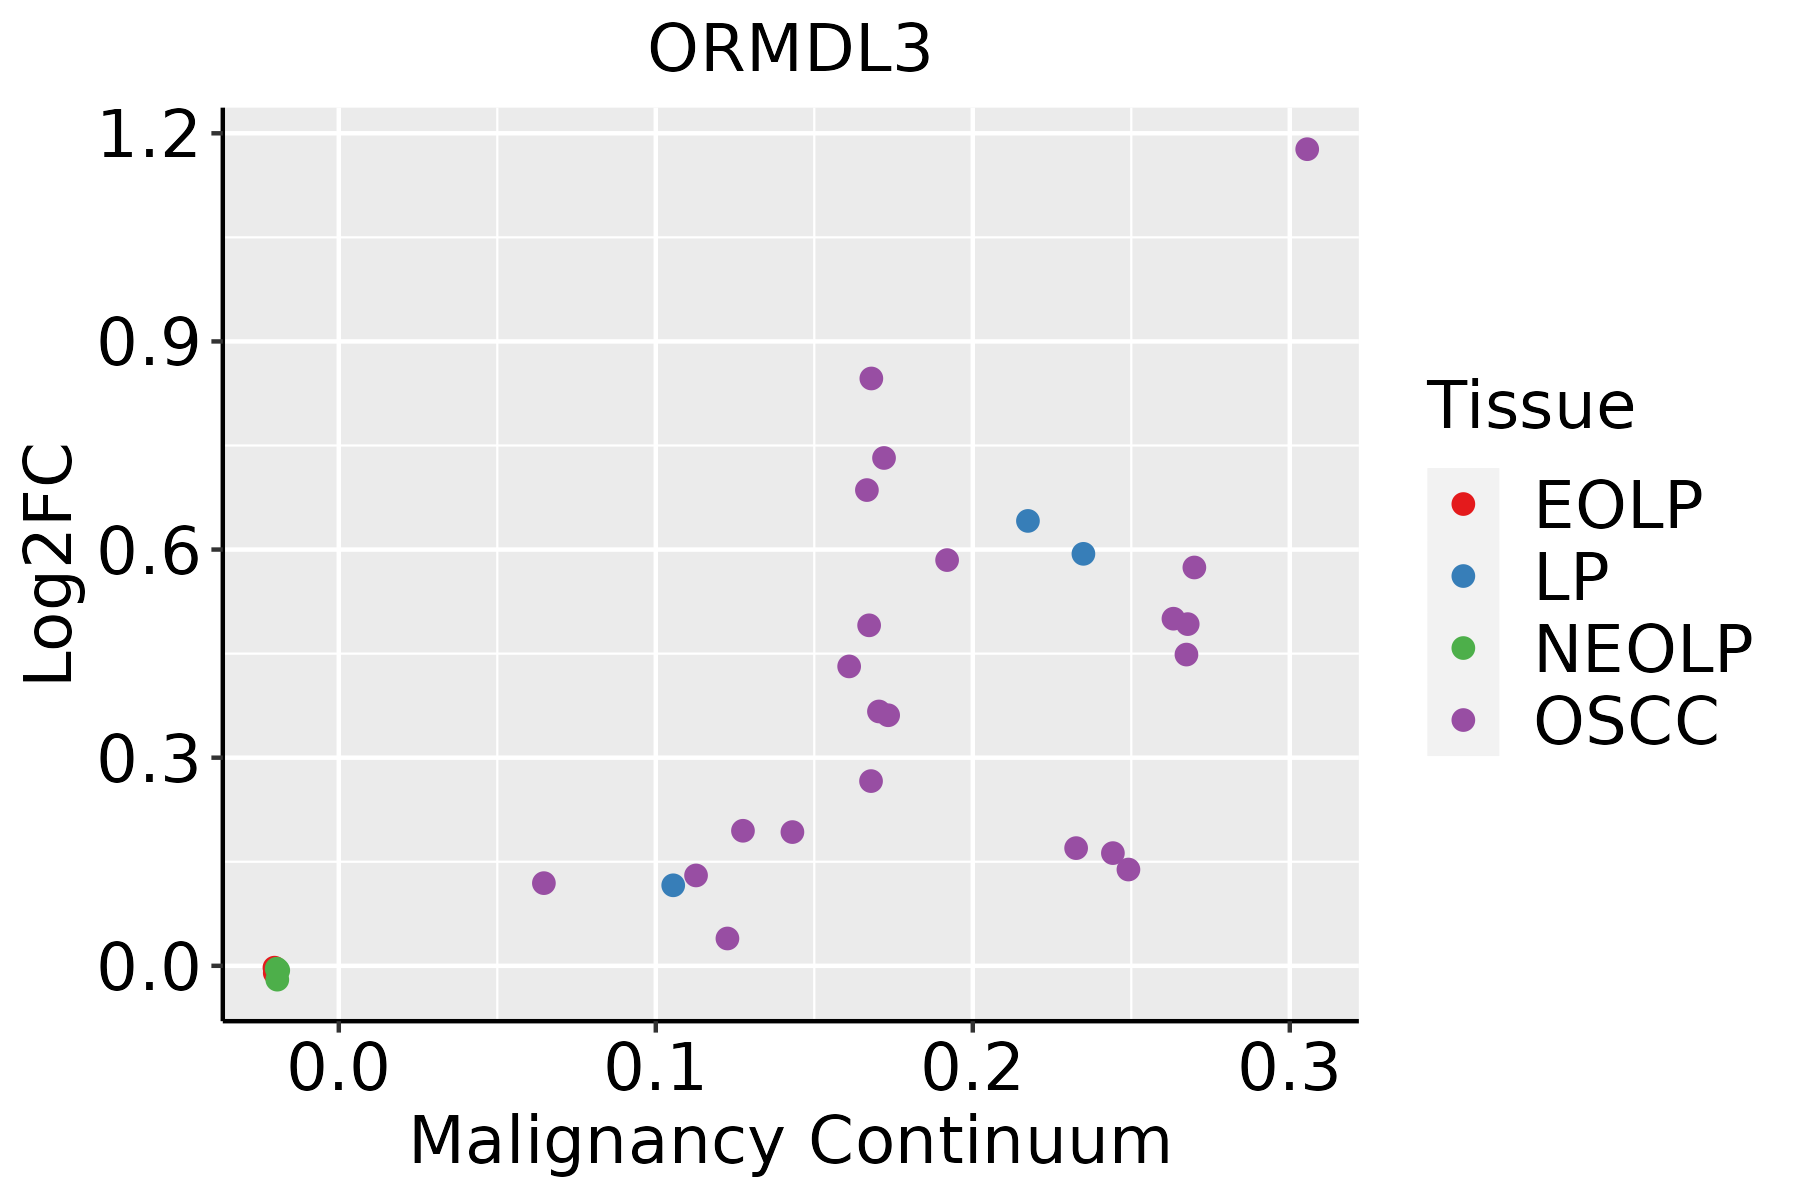
EOLP: Erosive Oral lichen planus
LP: leukoplakia
NEOLP: Non-erosive oral lichen planus
OSCC: Oral squamous cell carcinoma
ThyroidThe image shows the transcriptomic changes along malignancy continuum.log2FC in expression of this searched gene in stem-like cells from each diseased tissue sample relative to stem-like cells in normal samples in each tissue plotted against the malignancy continuum. Samples are colored based on if they are from different disease stage.
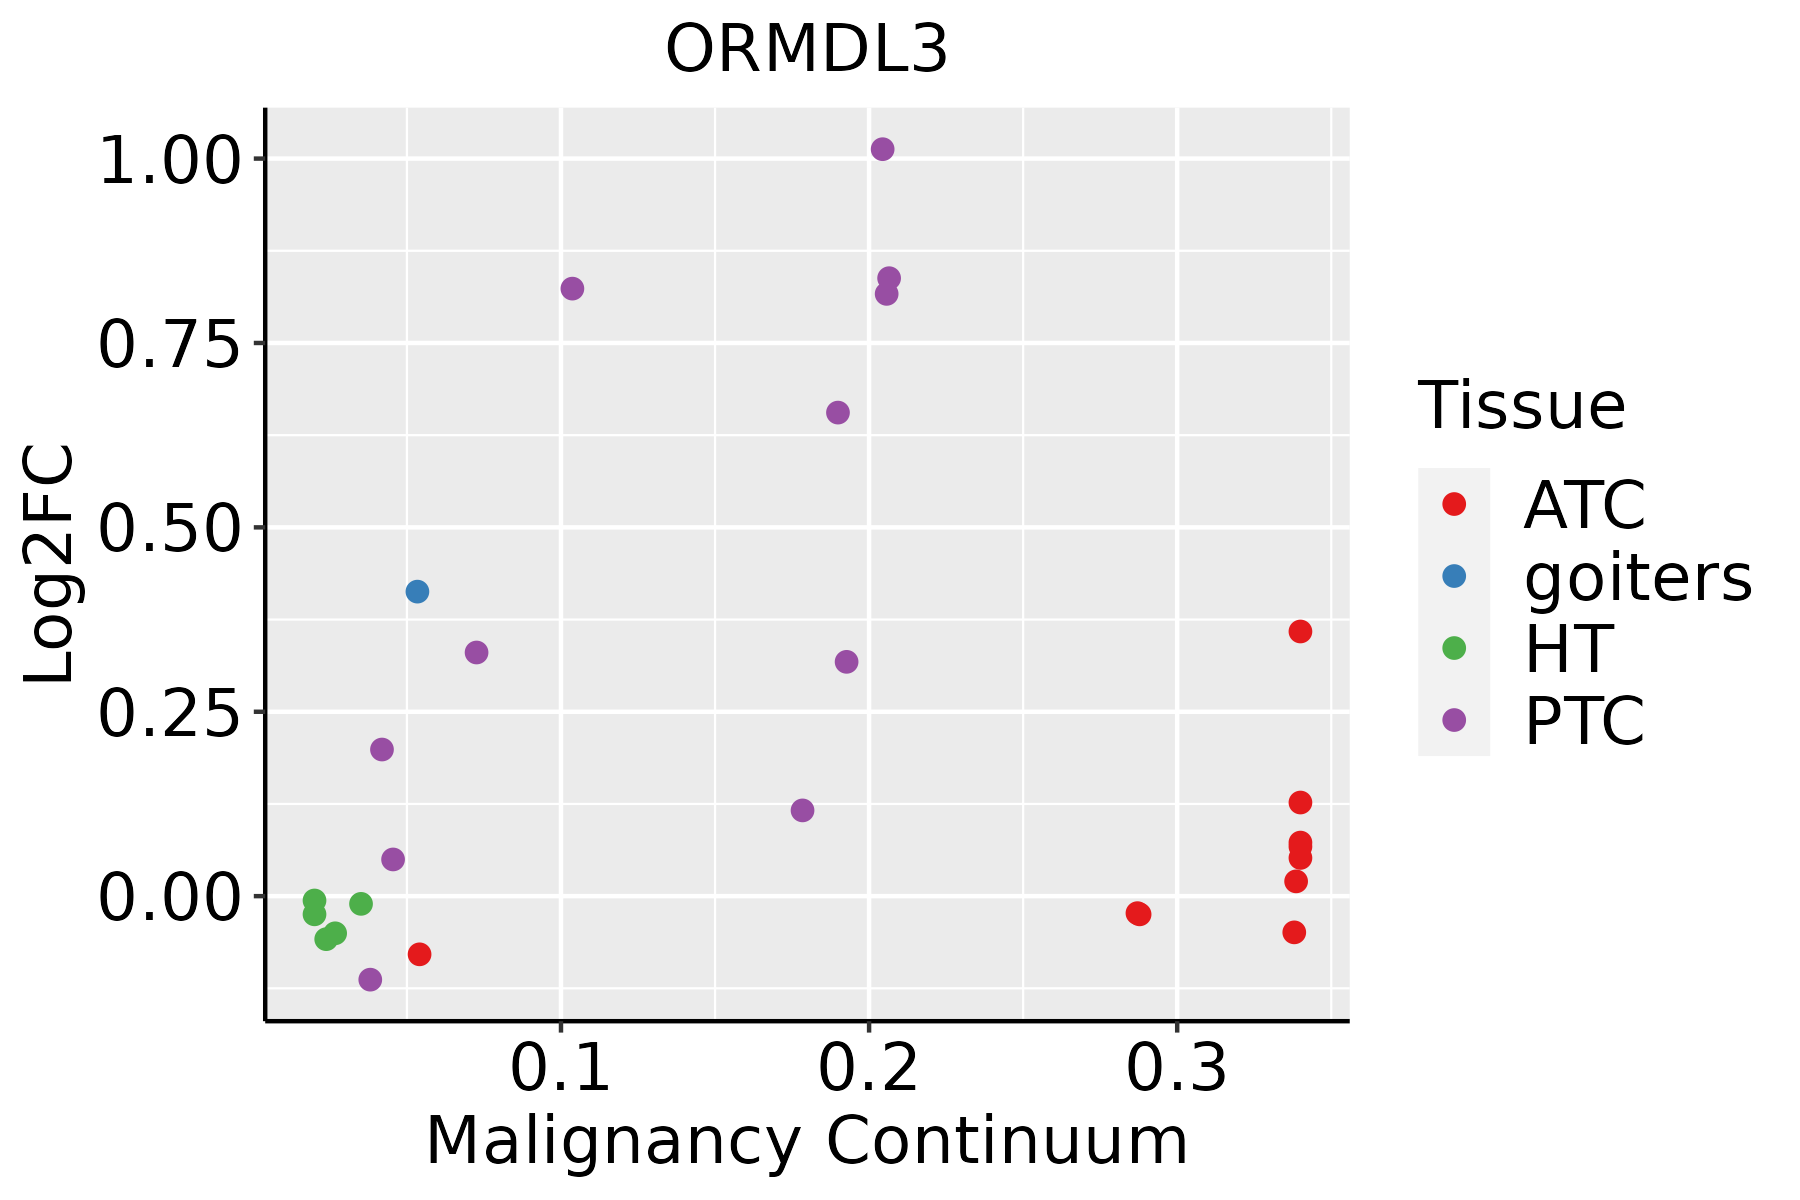
ATC: Anaplastic thyroid cancer
HT: Hashimoto's thyroiditis
PTC: Papillary thyroid cancer
∗log2FC in expression of this searched gene in stem-like cells from each diseased tissue sample relative to stem-like cells in normal samples in each tissue plotted against the malignancy continuum. Samples are colored based on if they are from different disease stage.

Top

Malignant transformation related pathway analysis

check buttonFind out the enriched GO biological processes and KEGG pathways involved in transition from healthy to precancer to cancer
check button Figure of enriched GO biological processes.
TissueDisease StageEnriched GO biological Processes
ColorectumADGO analysis - Figure of enriched GO biological processes: Top 15 enriched GO BP terms are showed in the bar plot of each disease state in each tissue. Each row represents a significant GO biological process which is colored according to the -log10(p.adjust).
ColorectumSERGO analysis - Figure of enriched GO biological processes: Top 15 enriched GO BP terms are showed in the bar plot of each disease state in each tissue. Each row represents a significant GO biological process which is colored according to the -log10(p.adjust).
ColorectumMSSGO analysis - Figure of enriched GO biological processes: Top 15 enriched GO BP terms are showed in the bar plot of each disease state in each tissue. Each row represents a significant GO biological process which is colored according to the -log10(p.adjust).
ColorectumMSI-HGO analysis - Figure of enriched GO biological processes: Top 15 enriched GO BP terms are showed in the bar plot of each disease state in each tissue. Each row represents a significant GO biological process which is colored according to the -log10(p.adjust).
ColorectumFAPGO analysis - Figure of enriched GO biological processes: Top 15 enriched GO BP terms are showed in the bar plot of each disease state in each tissue. Each row represents a significant GO biological process which is colored according to the -log10(p.adjust).
∗Top 15 enriched GO BP terms are showed in the bar plot of each disease state in each tissue. Each row represents a significant GO biological process which is colored according to the -log10(p.adjust).
Page: 1 2 3 4 5 6 7 8 9 

check button Enriched GO biological processes.
GO IDTissueDisease StageDescriptionGene RatioBg Ratiopvaluep.adjustCount
GO:000989614BreastIDCpositive regulation of catabolic process62/1434492/187237.06e-051.42e-0362
GO:005134814BreastIDCnegative regulation of transferase activity39/1434268/187237.89e-051.56e-0339
GO:001921612BreastIDCregulation of lipid metabolic process45/1434331/187231.21e-042.24e-0345
GO:003133114BreastIDCpositive regulation of cellular catabolic process54/1434427/187231.85e-043.07e-0354
GO:00468904BreastIDCregulation of lipid biosynthetic process26/1434171/187235.92e-047.50e-0326
GO:190382914BreastIDCpositive regulation of cellular protein localization36/1434276/187231.19e-031.28e-0236
GO:00030125BreastIDCmuscle system process50/1434452/187235.52e-034.05e-0250
GO:0070229BreastIDCnegative regulation of lymphocyte apoptotic process7/143430/187236.48e-034.56e-027
GO:005134824BreastDCISnegative regulation of transferase activity39/1390268/187234.02e-058.60e-0439
GO:000989624BreastDCISpositive regulation of catabolic process61/1390492/187235.32e-051.09e-0361
GO:003133124BreastDCISpositive regulation of cellular catabolic process54/1390427/187238.34e-051.58e-0354
GO:001921621BreastDCISregulation of lipid metabolic process43/1390331/187232.37e-043.71e-0343
GO:190382924BreastDCISpositive regulation of cellular protein localization37/1390276/187233.40e-044.87e-0337
GO:004689012BreastDCISregulation of lipid biosynthetic process24/1390171/187231.89e-031.81e-0224
GO:000301212BreastDCISmuscle system process50/1390452/187233.02e-032.57e-0250
GO:0009896ColorectumADpositive regulation of catabolic process180/3918492/187234.33e-161.94e-13180
GO:0031331ColorectumADpositive regulation of cellular catabolic process156/3918427/187234.68e-141.05e-11156
GO:1903829ColorectumADpositive regulation of cellular protein localization110/3918276/187234.58e-138.44e-11110
GO:0010506ColorectumADregulation of autophagy111/3918317/187233.57e-092.35e-07111
GO:1900180ColorectumADregulation of protein localization to nucleus55/3918136/187231.70e-077.34e-0655
Page: 1 2 3 4 5 6 7 8 9 10 

check button Enriched KEGG pathways.
Pathway IDTissueDisease StageDescriptionGene RatioBg Ratiopvaluep.adjustqvalueCount
Page: 1 

Top

Cell-cell communication analysis

check buttonIdentification of potential cell-cell interactions between two cell types and their ligand-receptor pairs for different disease states
LigandReceptorLRpairPathwayTissueDisease Stage
Page: 1 

Top

Single-cell gene regulatory network inference analysis

check buttonFind out the significant the regulons (TFs) and the target genes of each regulon across cell types for different disease states
TFCell TypeTissueDisease StageTarget GeneRSSRegulon Activity
∗The dot plots of a searched regulon are shown for all cell subpopulations in each disease state of each tissue based on the regulon specific score inferred using pySCENIC and by calculating the average expression.
Page: 1 

Top

Somatic mutation of malignant transformation related genes

check buttonAnnotation of somatic variants for genes involved in malignant transformation
Hugo SymbolVariant ClassVariant ClassificationdbSNP RSHGVScHGVSpHGVSp ShortSWISSPROTBIOTYPESIFTPolyPhenTumor Sample BarcodeTissueHistologySexAgeStageTherapy TypesDrugsOutcome
ORMDL3SNVMissense_Mutationc.221N>Tp.Thr74Ilep.T74IQ8N138protein_codingdeleterious(0)probably_damaging(0.998)TCGA-A7-A0CD-01Breastbreast invasive carcinomaFemale>=65I/IIHormone TherapyarimidexSD
ORMDL3SNVMissense_Mutationnovelc.373N>Ap.Val125Metp.V125MQ8N138protein_codingtolerated(0.05)benign(0.021)TCGA-A7-A3J0-01Breastbreast invasive carcinomaFemale<65I/IIHormone TherapyanastrazoleSD
ORMDL3SNVMissense_Mutationc.398G>Ap.Ser133Asnp.S133NQ8N138protein_codingdeleterious(0.04)benign(0.171)TCGA-AP-A0LI-01Endometriumuterine corpus endometrioid carcinomaFemale>=65III/IVChemotherapypaclitaxelSD
ORMDL3SNVMissense_Mutationnovelc.79G>Ap.Val27Metp.V27MQ8N138protein_codingtolerated(0.07)benign(0.214)TCGA-AX-A2HG-01Endometriumuterine corpus endometrioid carcinomaFemale<65I/IIUnknownUnknownSD
ORMDL3SNVMissense_Mutationrs759149603c.142G>Ap.Val48Ilep.V48IQ8N138protein_codingtolerated(0.11)benign(0.339)TCGA-B5-A1MX-01Endometriumuterine corpus endometrioid carcinomaFemale<65I/IIHormone TherapymegaceSD
ORMDL3SNVMissense_Mutationnovelc.260A>Cp.Glu87Alap.E87AQ8N138protein_codingdeleterious(0)possibly_damaging(0.779)TCGA-B5-A3FA-01Endometriumuterine corpus endometrioid carcinomaFemale>=65I/IIUnknownUnknownSD
ORMDL3SNVMissense_Mutationnovelc.62N>Ap.Gly21Aspp.G21DQ8N138protein_codingdeleterious(0)probably_damaging(1)TCGA-SJ-A6ZI-01Endometriumuterine corpus endometrioid carcinomaFemale<65I/IIUnknownUnknownSD
ORMDL3SNVMissense_Mutationnovelc.286A>Tp.Thr96Serp.T96SQ8N138protein_codingtolerated(0.11)probably_damaging(0.992)TCGA-95-7043-01Lunglung adenocarcinomaFemale<65I/IIUnknownUnknownPD
ORMDL3SNVMissense_Mutationnovelc.223N>Ap.Pro75Thrp.P75TQ8N138protein_codingtolerated(0.51)probably_damaging(0.999)TCGA-43-3920-01Lunglung squamous cell carcinomaMale>=65I/IIUnknownUnknownSD
ORMDL3SNVMissense_Mutationrs139204234c.197N>Tp.Thr66Metp.T66MQ8N138protein_codingtolerated(0.24)possibly_damaging(0.885)TCGA-BA-6869-01Oral cavityhead & neck squamous cell carcinomaMale<65III/IVUnknownUnknownSD
Page: 1 2 

Top

Related drugs of malignant transformation related genes

check buttonIdentification of chemicals and drugs interact with genes involved in malignant transfromation
(DGIdb 4.0)
Entrez IDSymbolCategoryInteraction TypesDrug Claim NameDrug NamePMIDs
Page: 1