
|
|||||
|
 | |
| |
| |
| |
| |
| |
|
Gene: ORMDL1 |
Gene summary for ORMDL1 |
| Gene information | Species | Human | Gene symbol | ORMDL1 | Gene ID | 94101 |
| Gene name | ORMDL sphingolipid biosynthesis regulator 1 | |
| Gene Alias | ORMDL1 | |
| Cytomap | 2q32.2 | |
| Gene Type | protein-coding | GO ID | GO:0006629 | UniProtAcc | Q9P0S3 |
Top |
Malignant transformation analysis |
| Identification of the aberrant gene expression in precancerous and cancerous lesions by comparing the gene expression of stem-like cells in diseased tissues with normal stem cells |
| Entrez ID | Symbol | Replicates | Species | Organ | Tissue | Adj P-value | Log2FC | Malignancy |
| 94101 | ORMDL1 | LZE2T | Human | Esophagus | ESCC | 1.14e-02 | 1.00e+00 | 0.082 |
| 94101 | ORMDL1 | LZE4T | Human | Esophagus | ESCC | 6.61e-05 | 1.53e-01 | 0.0811 |
| 94101 | ORMDL1 | LZE7T | Human | Esophagus | ESCC | 3.80e-06 | 7.93e-01 | 0.0667 |
| 94101 | ORMDL1 | LZE8T | Human | Esophagus | ESCC | 1.93e-03 | 1.17e-01 | 0.067 |
| 94101 | ORMDL1 | LZE24T | Human | Esophagus | ESCC | 1.74e-18 | 8.13e-01 | 0.0596 |
| 94101 | ORMDL1 | LZE6T | Human | Esophagus | ESCC | 1.58e-02 | 6.12e-02 | 0.0845 |
| 94101 | ORMDL1 | P1T-E | Human | Esophagus | ESCC | 8.26e-03 | 1.36e-01 | 0.0875 |
| 94101 | ORMDL1 | P2T-E | Human | Esophagus | ESCC | 2.31e-22 | 4.38e-01 | 0.1177 |
| 94101 | ORMDL1 | P4T-E | Human | Esophagus | ESCC | 1.24e-28 | 9.97e-01 | 0.1323 |
| 94101 | ORMDL1 | P5T-E | Human | Esophagus | ESCC | 2.19e-19 | 4.86e-01 | 0.1327 |
| 94101 | ORMDL1 | P8T-E | Human | Esophagus | ESCC | 1.97e-23 | 4.49e-01 | 0.0889 |
| 94101 | ORMDL1 | P9T-E | Human | Esophagus | ESCC | 1.31e-14 | 4.19e-01 | 0.1131 |
| 94101 | ORMDL1 | P10T-E | Human | Esophagus | ESCC | 4.20e-38 | 6.12e-01 | 0.116 |
| 94101 | ORMDL1 | P11T-E | Human | Esophagus | ESCC | 6.03e-10 | 5.48e-01 | 0.1426 |
| 94101 | ORMDL1 | P12T-E | Human | Esophagus | ESCC | 5.49e-34 | 7.33e-01 | 0.1122 |
| 94101 | ORMDL1 | P15T-E | Human | Esophagus | ESCC | 2.45e-22 | 6.25e-01 | 0.1149 |
| 94101 | ORMDL1 | P16T-E | Human | Esophagus | ESCC | 5.58e-27 | 4.99e-01 | 0.1153 |
| 94101 | ORMDL1 | P17T-E | Human | Esophagus | ESCC | 3.49e-02 | 1.08e-01 | 0.1278 |
| 94101 | ORMDL1 | P19T-E | Human | Esophagus | ESCC | 8.91e-04 | 5.56e-01 | 0.1662 |
| 94101 | ORMDL1 | P20T-E | Human | Esophagus | ESCC | 3.84e-12 | 3.92e-01 | 0.1124 |
| Page: 1 2 3 4 5 6 7 |
| Tissue | Expression Dynamics | Abbreviation |
| Esophagus | 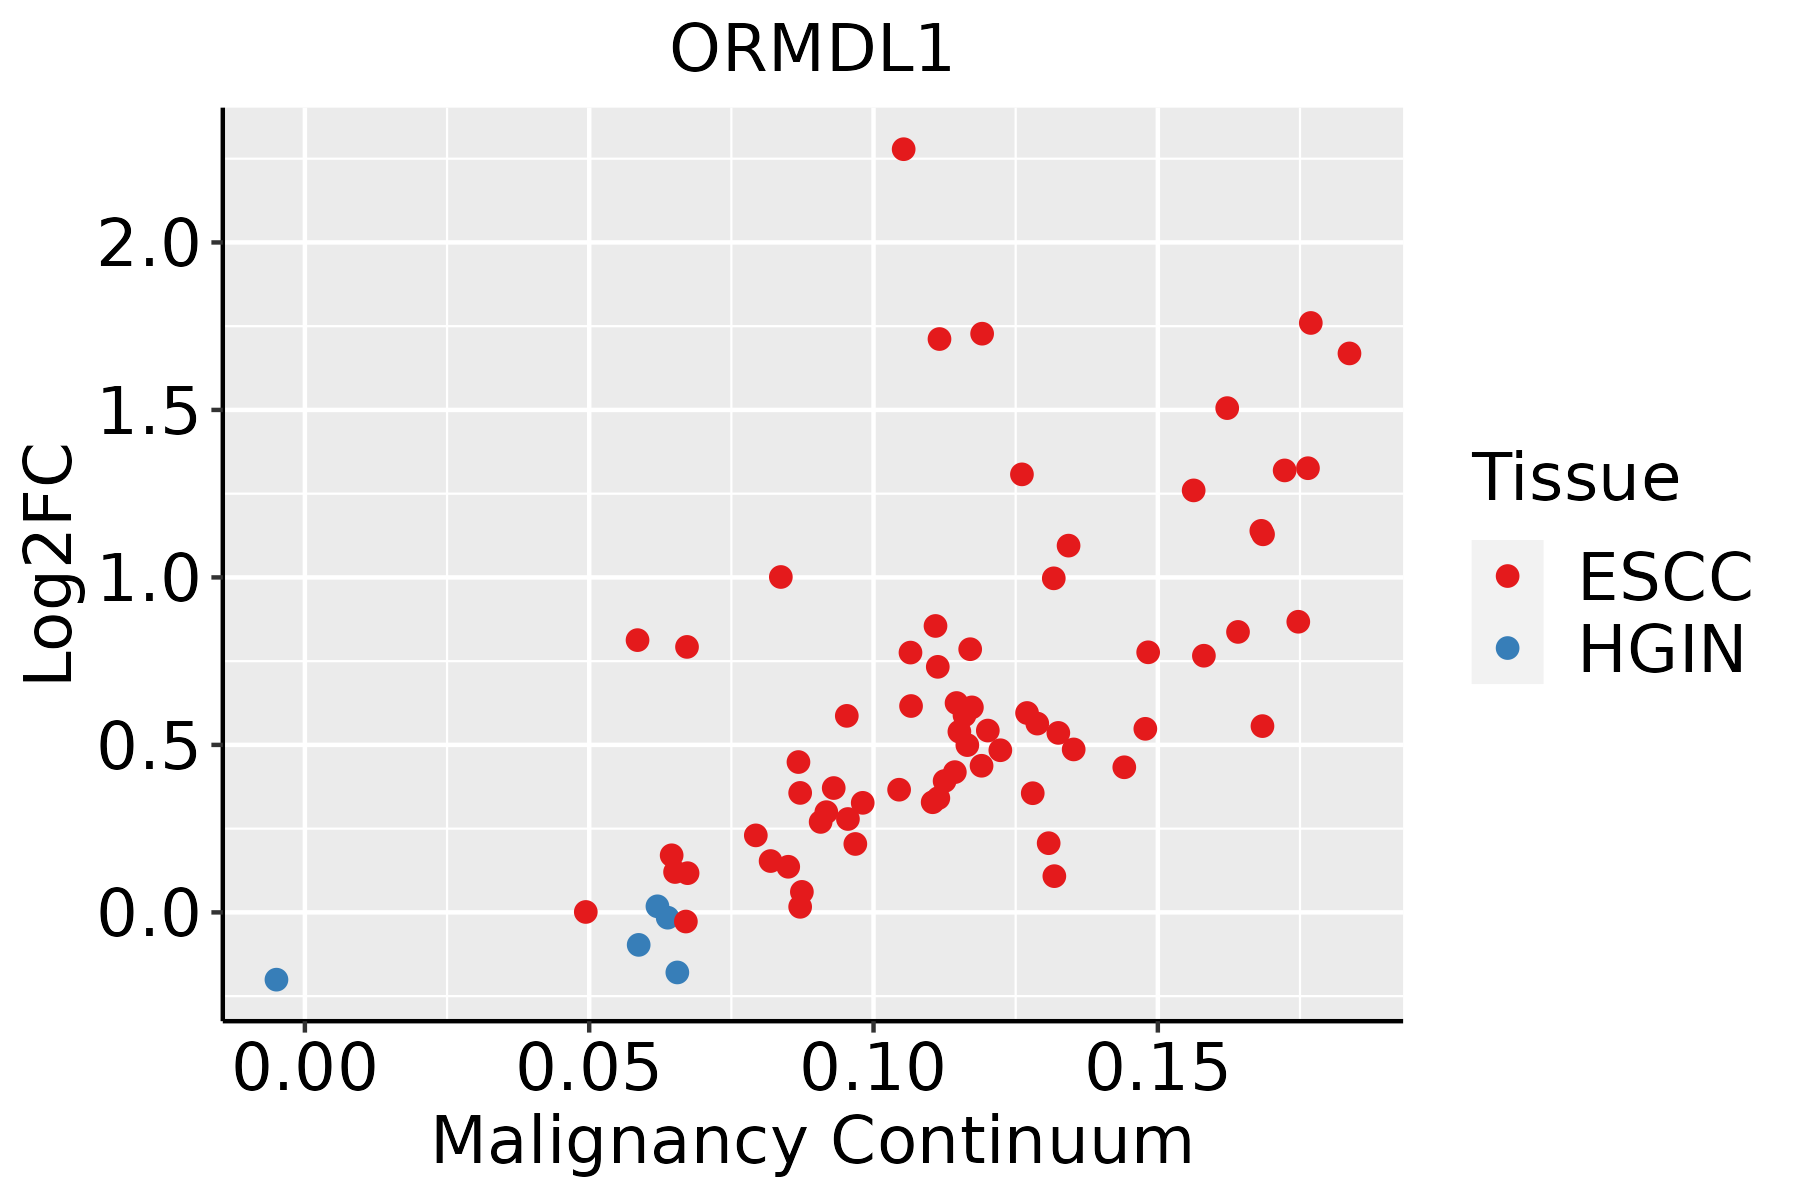 | ESCC: Esophageal squamous cell carcinoma |
| HGIN: High-grade intraepithelial neoplasias | ||
| LGIN: Low-grade intraepithelial neoplasias | ||
| Liver | 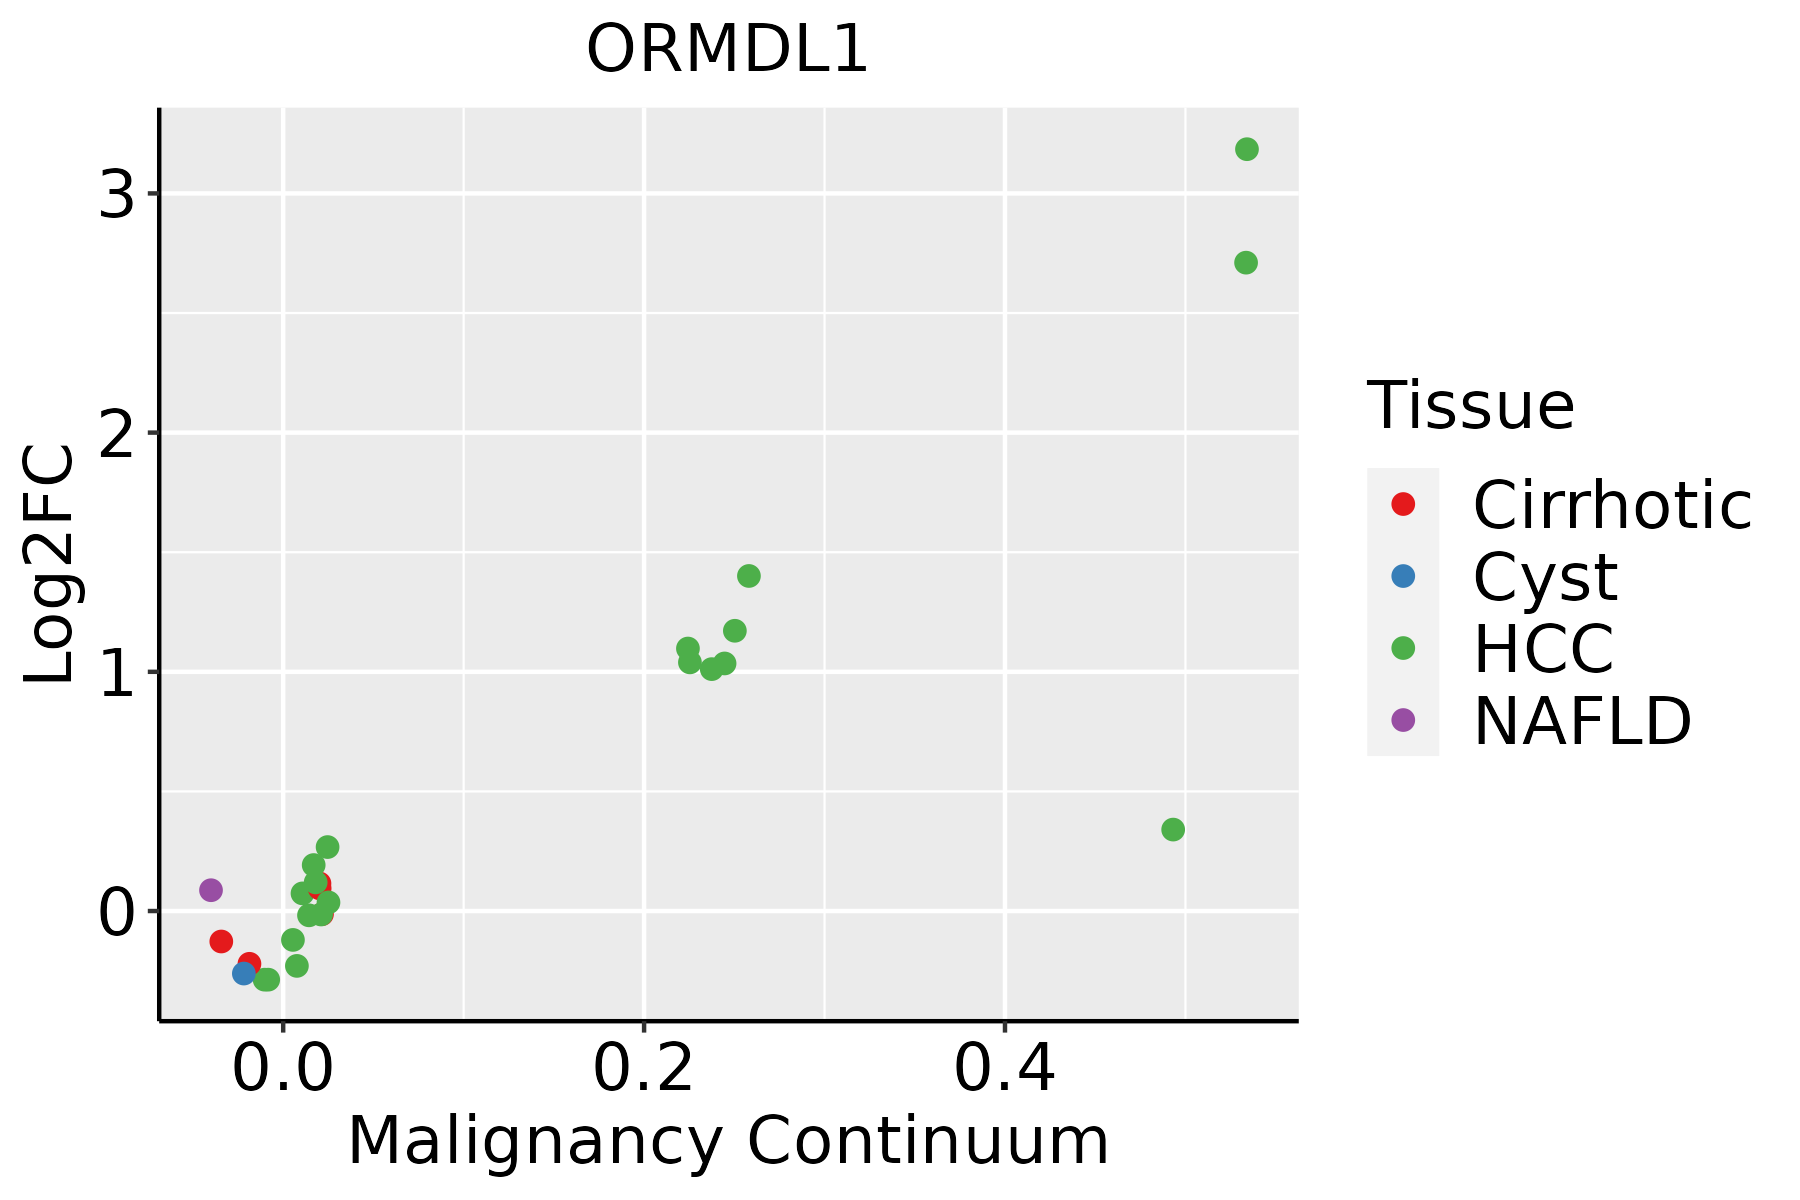 | HCC: Hepatocellular carcinoma |
| NAFLD: Non-alcoholic fatty liver disease | ||
| Oral Cavity | 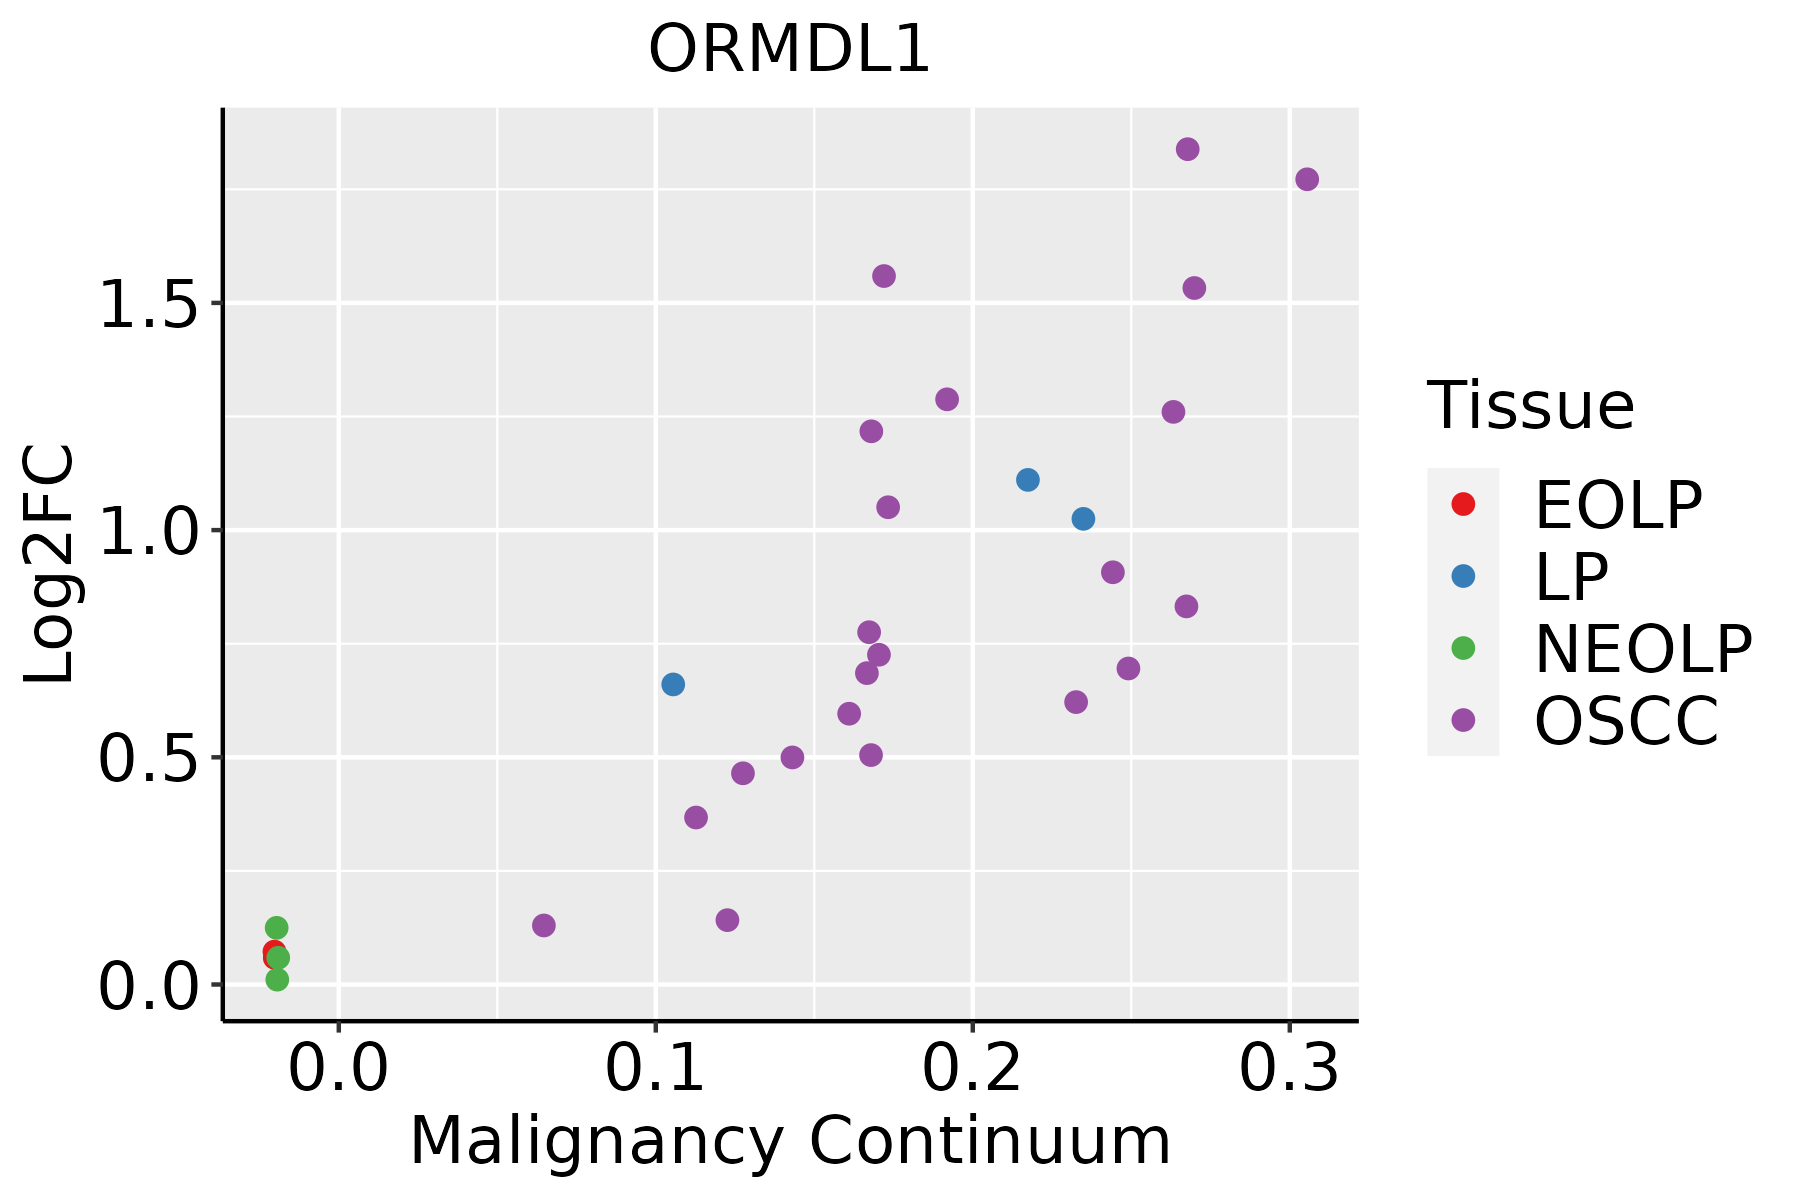 | EOLP: Erosive Oral lichen planus |
| LP: leukoplakia | ||
| NEOLP: Non-erosive oral lichen planus | ||
| OSCC: Oral squamous cell carcinoma | ||
| Prostate | 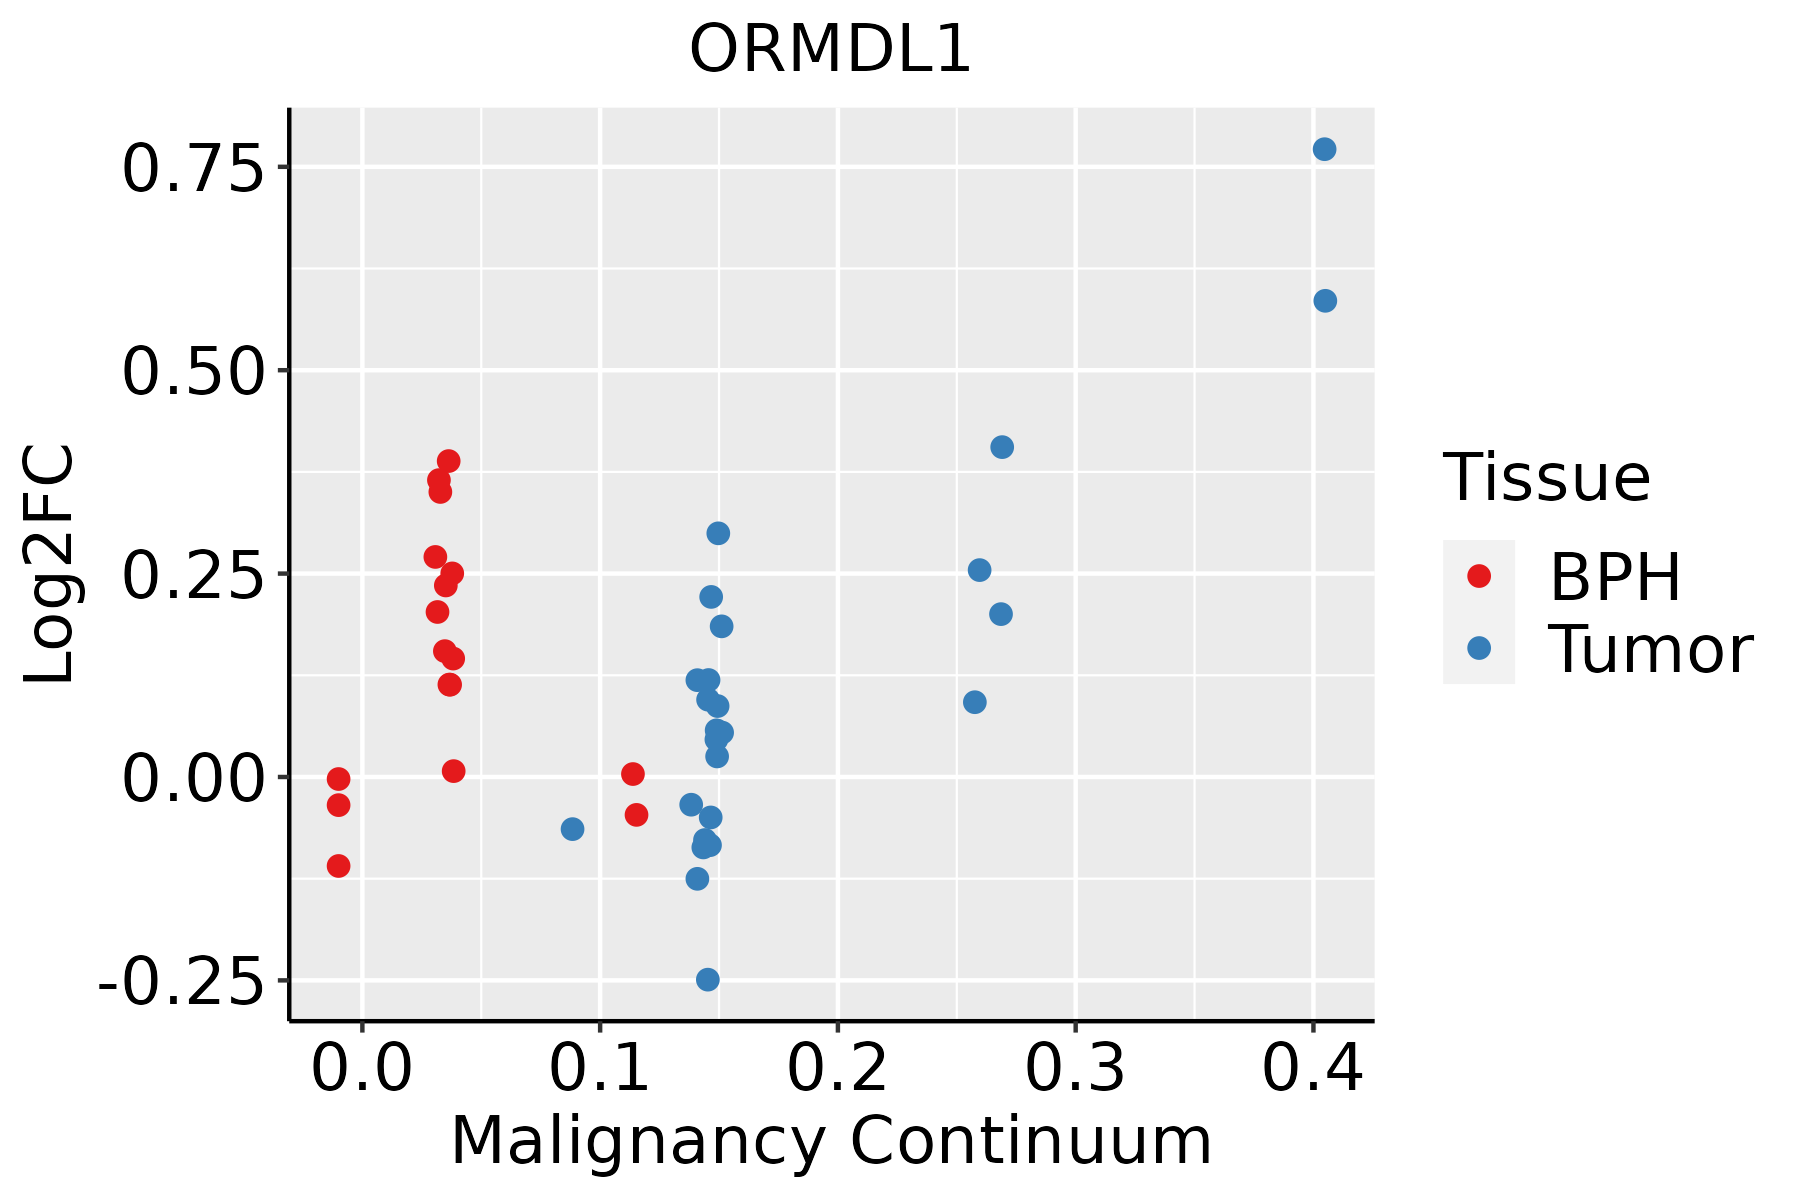 | BPH: Benign Prostatic Hyperplasia |
| Skin |  | AK: Actinic keratosis |
| cSCC: Cutaneous squamous cell carcinoma | ||
| SCCIS:squamous cell carcinoma in situ | ||
| Thyroid |  | ATC: Anaplastic thyroid cancer |
| HT: Hashimoto's thyroiditis | ||
| PTC: Papillary thyroid cancer |
| ∗log2FC in expression of this searched gene in stem-like cells from each diseased tissue sample relative to stem-like cells in normal samples in each tissue plotted against the malignancy continuum. Samples are colored based on if they are from different disease stage. |
Top |
Malignant transformation related pathway analysis |
| Find out the enriched GO biological processes and KEGG pathways involved in transition from healthy to precancer to cancer |
| Tissue | Disease Stage | Enriched GO biological Processes |
| Colorectum | AD |  |
| Colorectum | SER |  |
| Colorectum | MSS |  |
| Colorectum | MSI-H |  |
| Colorectum | FAP |  |
| ∗Top 15 enriched GO BP terms are showed in the bar plot of each disease state in each tissue. Each row represents a significant GO biological process which is colored according to the -log10(p.adjust). |
| Page: 1 2 3 4 5 6 7 8 9 |
| GO ID | Tissue | Disease Stage | Description | Gene Ratio | Bg Ratio | pvalue | p.adjust | Count |
| GO:00066433 | Esophagus | ESCC | membrane lipid metabolic process | 130/8552 | 203/18723 | 9.29e-08 | 1.54e-06 | 130 |
| GO:00464673 | Esophagus | ESCC | membrane lipid biosynthetic process | 91/8552 | 142/18723 | 7.19e-06 | 7.19e-05 | 91 |
| GO:00066652 | Esophagus | ESCC | sphingolipid metabolic process | 96/8552 | 155/18723 | 3.21e-05 | 2.66e-04 | 96 |
| GO:00301481 | Esophagus | ESCC | sphingolipid biosynthetic process | 62/8552 | 103/18723 | 2.10e-03 | 9.38e-03 | 62 |
| GO:00066721 | Esophagus | ESCC | ceramide metabolic process | 61/8552 | 102/18723 | 2.82e-03 | 1.19e-02 | 61 |
| GO:0046513 | Esophagus | ESCC | ceramide biosynthetic process | 40/8552 | 65/18723 | 7.25e-03 | 2.63e-02 | 40 |
| GO:003424914 | Esophagus | ESCC | negative regulation of cellular amide metabolic process | 144/8552 | 273/18723 | 1.08e-02 | 3.67e-02 | 144 |
| GO:00192168 | Esophagus | ESCC | regulation of lipid metabolic process | 172/8552 | 331/18723 | 1.20e-02 | 4.02e-02 | 172 |
| GO:005508811 | Liver | Cirrhotic | lipid homeostasis | 74/4634 | 167/18723 | 2.46e-08 | 8.51e-07 | 74 |
| GO:001921611 | Liver | Cirrhotic | regulation of lipid metabolic process | 119/4634 | 331/18723 | 3.05e-06 | 5.39e-05 | 119 |
| GO:003424911 | Liver | Cirrhotic | negative regulation of cellular amide metabolic process | 100/4634 | 273/18723 | 7.34e-06 | 1.13e-04 | 100 |
| GO:004689011 | Liver | Cirrhotic | regulation of lipid biosynthetic process | 67/4634 | 171/18723 | 2.00e-05 | 2.65e-04 | 67 |
| GO:0006643 | Liver | Cirrhotic | membrane lipid metabolic process | 69/4634 | 203/18723 | 1.89e-03 | 1.19e-02 | 69 |
| GO:00550882 | Liver | HCC | lipid homeostasis | 103/7958 | 167/18723 | 4.27e-07 | 7.18e-06 | 103 |
| GO:00192162 | Liver | HCC | regulation of lipid metabolic process | 181/7958 | 331/18723 | 4.58e-06 | 5.79e-05 | 181 |
| GO:00066431 | Liver | HCC | membrane lipid metabolic process | 115/7958 | 203/18723 | 3.17e-05 | 3.22e-04 | 115 |
| GO:00468902 | Liver | HCC | regulation of lipid biosynthetic process | 96/7958 | 171/18723 | 2.14e-04 | 1.63e-03 | 96 |
| GO:003424921 | Liver | HCC | negative regulation of cellular amide metabolic process | 144/7958 | 273/18723 | 3.80e-04 | 2.61e-03 | 144 |
| GO:0006665 | Liver | HCC | sphingolipid metabolic process | 85/7958 | 155/18723 | 1.27e-03 | 6.92e-03 | 85 |
| GO:0046467 | Liver | HCC | membrane lipid biosynthetic process | 78/7958 | 142/18723 | 1.85e-03 | 9.46e-03 | 78 |
| Page: 1 2 |
| Pathway ID | Tissue | Disease Stage | Description | Gene Ratio | Bg Ratio | pvalue | p.adjust | qvalue | Count |
| Page: 1 |
Top |
Cell-cell communication analysis |
| Identification of potential cell-cell interactions between two cell types and their ligand-receptor pairs for different disease states |
| Ligand | Receptor | LRpair | Pathway | Tissue | Disease Stage |
| Page: 1 |
Top |
Single-cell gene regulatory network inference analysis |
| Find out the significant the regulons (TFs) and the target genes of each regulon across cell types for different disease states |
| TF | Cell Type | Tissue | Disease Stage | Target Gene | RSS | Regulon Activity |
| ∗The dot plots of a searched regulon are shown for all cell subpopulations in each disease state of each tissue based on the regulon specific score inferred using pySCENIC and by calculating the average expression. |
| Page: 1 |
Top |
Somatic mutation of malignant transformation related genes |
| Annotation of somatic variants for genes involved in malignant transformation |
| Hugo Symbol | Variant Class | Variant Classification | dbSNP RS | HGVSc | HGVSp | HGVSp Short | SWISSPROT | BIOTYPE | SIFT | PolyPhen | Tumor Sample Barcode | Tissue | Histology | Sex | Age | Stage | Therapy Types | Drugs | Outcome |
| ORMDL1 | SNV | Missense_Mutation | c.172N>G | p.Leu58Val | p.L58V | Q9P0S3 | protein_coding | tolerated(0.44) | benign(0.055) | TCGA-AR-A24Q-01 | Breast | breast invasive carcinoma | Female | <65 | I/II | Chemotherapy | doxorubicin | SD | |
| ORMDL1 | SNV | Missense_Mutation | c.163N>G | p.Ile55Val | p.I55V | Q9P0S3 | protein_coding | tolerated(0.39) | possibly_damaging(0.881) | TCGA-EW-A1IZ-01 | Breast | breast invasive carcinoma | Female | <65 | III/IV | Chemotherapy | taxotere | SD | |
| ORMDL1 | insertion | Nonsense_Mutation | novel | c.364_365insTGTAAATACTT | p.Thr122MetfsTer2 | p.T122Mfs*2 | Q9P0S3 | protein_coding | TCGA-AM-5820-01 | Colorectum | colon adenocarcinoma | Female | <65 | I/II | Unknown | Unknown | SD | ||
| ORMDL1 | SNV | Missense_Mutation | novel | c.385N>T | p.Ala129Ser | p.A129S | Q9P0S3 | protein_coding | tolerated(0.42) | benign(0.322) | TCGA-A5-A0G2-01 | Endometrium | uterine corpus endometrioid carcinoma | Female | <65 | III/IV | Unknown | Unknown | SD |
| ORMDL1 | SNV | Missense_Mutation | novel | c.238N>A | p.Ala80Thr | p.A80T | Q9P0S3 | protein_coding | tolerated(0.28) | probably_damaging(0.995) | TCGA-A5-A0G2-01 | Endometrium | uterine corpus endometrioid carcinoma | Female | <65 | III/IV | Unknown | Unknown | SD |
| ORMDL1 | SNV | Missense_Mutation | novel | c.322A>G | p.Ile108Val | p.I108V | Q9P0S3 | protein_coding | tolerated(1) | benign(0.003) | TCGA-AP-A5FX-01 | Endometrium | uterine corpus endometrioid carcinoma | Female | >=65 | III/IV | Chemotherapy | carboplatin | PD |
| ORMDL1 | SNV | Missense_Mutation | novel | c.232N>A | p.Gly78Ser | p.G78S | Q9P0S3 | protein_coding | deleterious(0.05) | probably_damaging(0.998) | TCGA-B5-A3FA-01 | Endometrium | uterine corpus endometrioid carcinoma | Female | >=65 | I/II | Unknown | Unknown | SD |
| ORMDL1 | SNV | Missense_Mutation | novel | c.337N>A | p.Ala113Thr | p.A113T | Q9P0S3 | protein_coding | tolerated(1) | benign(0.007) | TCGA-DD-AADV-01 | Liver | liver hepatocellular carcinoma | Male | <65 | I/II | Unknown | Unknown | SD |
| ORMDL1 | SNV | Missense_Mutation | c.223N>A | p.Pro75Thr | p.P75T | Q9P0S3 | protein_coding | tolerated(0.52) | probably_damaging(0.998) | TCGA-HC-7749-01 | Prostate | prostate adenocarcinoma | Male | >=65 | 7 | Unknown | Unknown | SD | |
| ORMDL1 | SNV | Missense_Mutation | novel | c.337N>A | p.Ala113Thr | p.A113T | Q9P0S3 | protein_coding | tolerated(1) | benign(0.007) | TCGA-J4-A83I-01 | Prostate | prostate adenocarcinoma | Male | <65 | 7 | Unknown | Unknown | SD |
| Page: 1 2 |
Top |
Related drugs of malignant transformation related genes |
| Identification of chemicals and drugs interact with genes involved in malignant transfromation |
| (DGIdb 4.0) |
| Entrez ID | Symbol | Category | Interaction Types | Drug Claim Name | Drug Name | PMIDs |
| Page: 1 |

Copyright 2023-Present -The University of Texas Health Science Center at Houston |