
|
|||||
|
 | |
| |
| |
| |
| |
| |
|
Gene: ORM2 |
Gene summary for ORM2 |
| Gene information | Species | Human | Gene symbol | ORM2 | Gene ID | 5005 |
| Gene name | orosomucoid 2 | |
| Gene Alias | AGP-B | |
| Cytomap | 9q32 | |
| Gene Type | protein-coding | GO ID | GO:0001816 | UniProtAcc | P19652 |
Top |
Malignant transformation analysis |
| Identification of the aberrant gene expression in precancerous and cancerous lesions by comparing the gene expression of stem-like cells in diseased tissues with normal stem cells |
| Entrez ID | Symbol | Replicates | Species | Organ | Tissue | Adj P-value | Log2FC | Malignancy |
| 5005 | ORM2 | HCC1_Meng | Human | Liver | HCC | 1.55e-105 | 6.70e-01 | 0.0246 |
| 5005 | ORM2 | HCC2_Meng | Human | Liver | HCC | 2.32e-08 | -4.08e-01 | 0.0107 |
| 5005 | ORM2 | cirrhotic2 | Human | Liver | Cirrhotic | 1.54e-05 | -1.95e-01 | 0.0201 |
| 5005 | ORM2 | cirrhotic3 | Human | Liver | Cirrhotic | 8.20e-04 | -2.38e-01 | 0.0215 |
| 5005 | ORM2 | HCC1 | Human | Liver | HCC | 6.42e-09 | 3.71e+00 | 0.5336 |
| 5005 | ORM2 | HCC2 | Human | Liver | HCC | 1.84e-07 | 4.94e+00 | 0.5341 |
| 5005 | ORM2 | Pt13.a | Human | Liver | HCC | 2.71e-58 | 8.44e-01 | 0.021 |
| 5005 | ORM2 | Pt13.b | Human | Liver | HCC | 2.07e-78 | 8.41e-01 | 0.0251 |
| 5005 | ORM2 | Pt13.c | Human | Liver | HCC | 2.26e-03 | 3.45e-01 | 0.0076 |
| 5005 | ORM2 | Pt14.a | Human | Liver | HCC | 6.96e-09 | 1.81e-01 | 0.0169 |
| 5005 | ORM2 | Pt14.b | Human | Liver | HCC | 2.38e-20 | 5.30e-01 | 0.018 |
| 5005 | ORM2 | Pt14.d | Human | Liver | HCC | 3.08e-18 | 3.50e-01 | 0.0143 |
| 5005 | ORM2 | S027 | Human | Liver | HCC | 1.10e-11 | 1.65e+00 | 0.2446 |
| 5005 | ORM2 | S028 | Human | Liver | HCC | 2.72e-26 | 1.49e+00 | 0.2503 |
| 5005 | ORM2 | S029 | Human | Liver | HCC | 1.96e-47 | 2.95e+00 | 0.2581 |
| Page: 1 |
| Tissue | Expression Dynamics | Abbreviation |
| Liver | 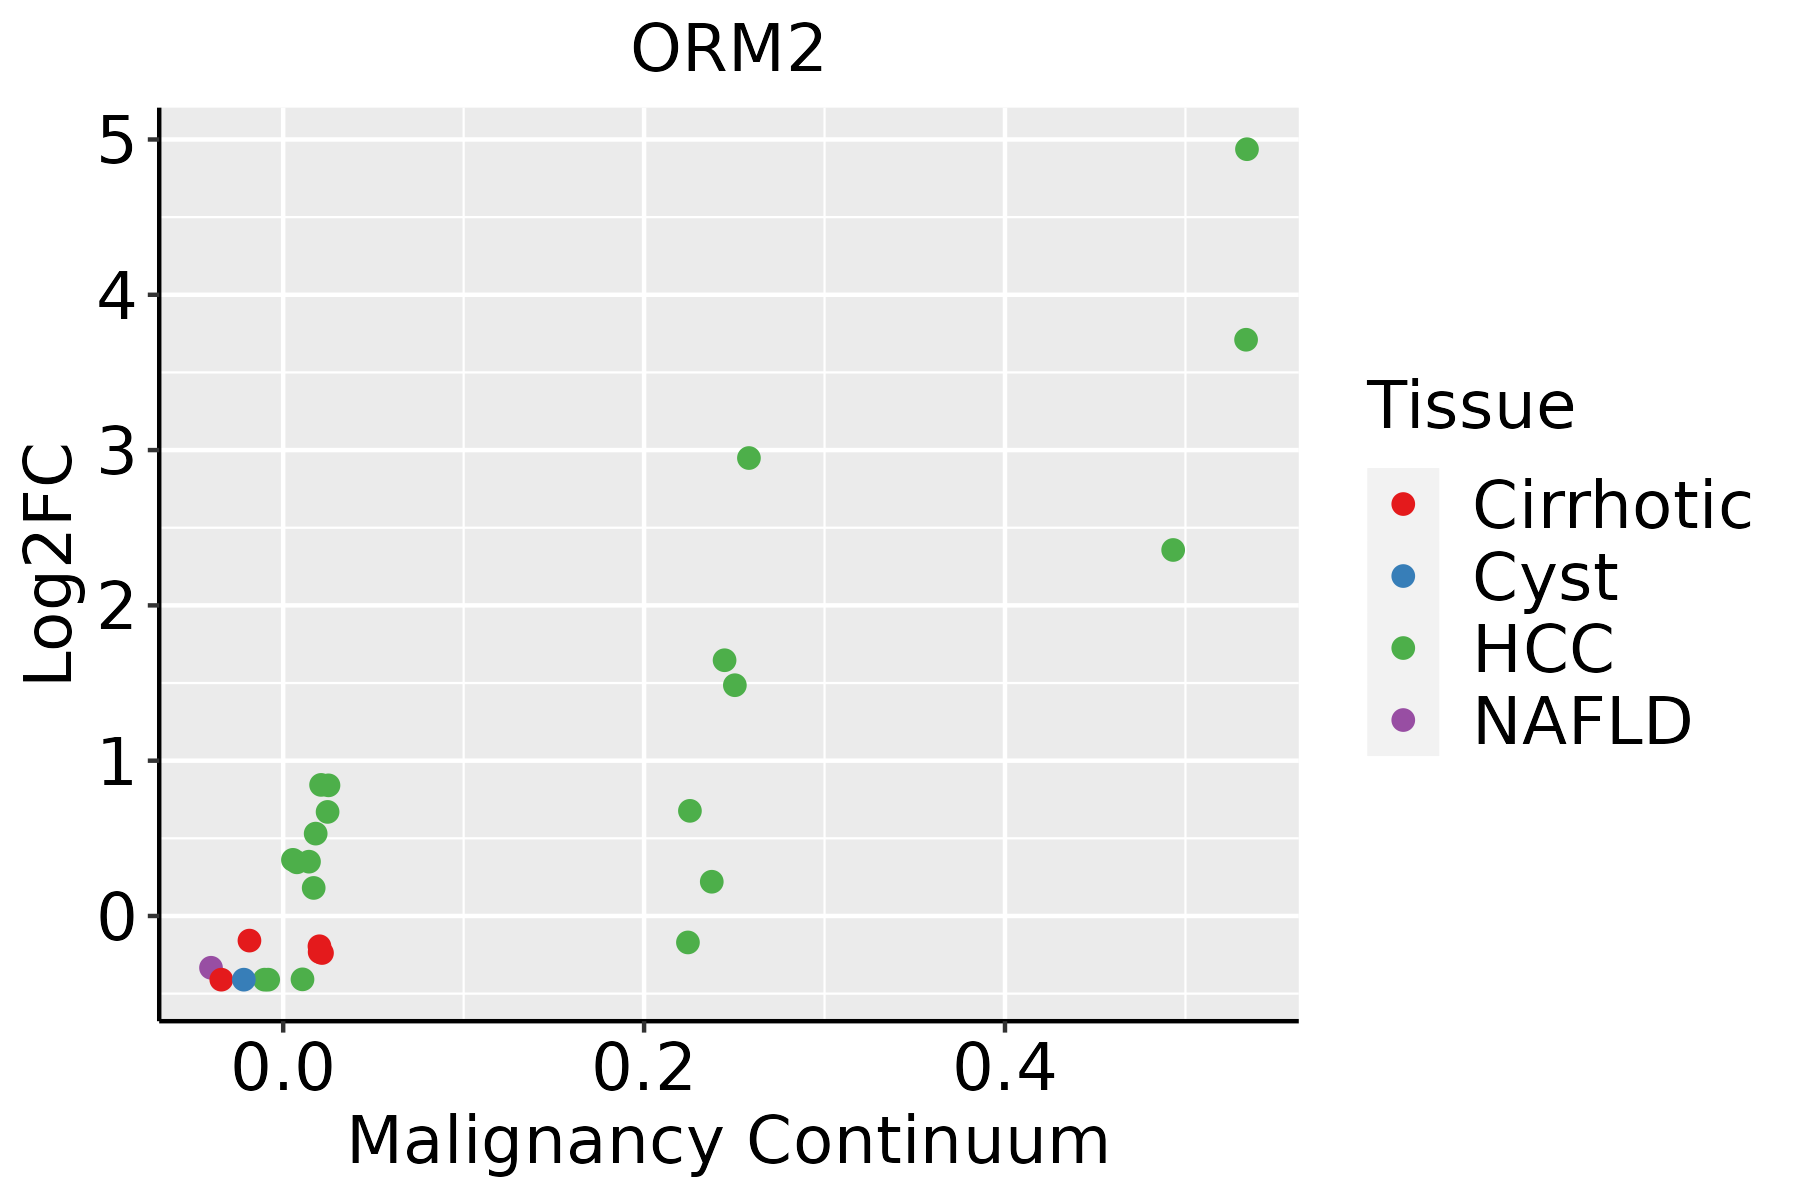 | HCC: Hepatocellular carcinoma |
| NAFLD: Non-alcoholic fatty liver disease |
| ∗log2FC in expression of this searched gene in stem-like cells from each diseased tissue sample relative to stem-like cells in normal samples in each tissue plotted against the malignancy continuum. Samples are colored based on if they are from different disease stage. |
Top |
Malignant transformation related pathway analysis |
| Find out the enriched GO biological processes and KEGG pathways involved in transition from healthy to precancer to cancer |
| Tissue | Disease Stage | Enriched GO biological Processes |
| Colorectum | AD |  |
| Colorectum | SER |  |
| Colorectum | MSS |  |
| Colorectum | MSI-H |  |
| Colorectum | FAP |  |
| ∗Top 15 enriched GO BP terms are showed in the bar plot of each disease state in each tissue. Each row represents a significant GO biological process which is colored according to the -log10(p.adjust). |
| Page: 1 2 3 4 5 6 7 8 9 |
| GO ID | Tissue | Disease Stage | Description | Gene Ratio | Bg Ratio | pvalue | p.adjust | Count |
| GO:00069531 | Liver | Cirrhotic | acute-phase response | 23/4634 | 49/18723 | 6.06e-04 | 4.67e-03 | 23 |
| GO:00025261 | Liver | Cirrhotic | acute inflammatory response | 40/4634 | 112/18723 | 6.16e-03 | 3.06e-02 | 40 |
| GO:00025262 | Liver | HCC | acute inflammatory response | 62/7958 | 112/18723 | 4.06e-03 | 1.77e-02 | 62 |
| GO:00069532 | Liver | HCC | acute-phase response | 30/7958 | 49/18723 | 6.31e-03 | 2.57e-02 | 30 |
| Page: 1 |
| Pathway ID | Tissue | Disease Stage | Description | Gene Ratio | Bg Ratio | pvalue | p.adjust | qvalue | Count |
| Page: 1 |
Top |
Cell-cell communication analysis |
| Identification of potential cell-cell interactions between two cell types and their ligand-receptor pairs for different disease states |
| Ligand | Receptor | LRpair | Pathway | Tissue | Disease Stage |
| Page: 1 |
Top |
Single-cell gene regulatory network inference analysis |
| Find out the significant the regulons (TFs) and the target genes of each regulon across cell types for different disease states |
| TF | Cell Type | Tissue | Disease Stage | Target Gene | RSS | Regulon Activity |
| ∗The dot plots of a searched regulon are shown for all cell subpopulations in each disease state of each tissue based on the regulon specific score inferred using pySCENIC and by calculating the average expression. |
| Page: 1 |
Top |
Somatic mutation of malignant transformation related genes |
| Annotation of somatic variants for genes involved in malignant transformation |
| Hugo Symbol | Variant Class | Variant Classification | dbSNP RS | HGVSc | HGVSp | HGVSp Short | SWISSPROT | BIOTYPE | SIFT | PolyPhen | Tumor Sample Barcode | Tissue | Histology | Sex | Age | Stage | Therapy Types | Drugs | Outcome |
| ORM2 | SNV | Missense_Mutation | novel | c.414N>T | p.Lys138Asn | p.K138N | P19652 | protein_coding | tolerated(0.16) | benign(0.41) | TCGA-AN-A046-01 | Breast | breast invasive carcinoma | Female | >=65 | I/II | Unknown | Unknown | SD |
| ORM2 | SNV | Missense_Mutation | c.223N>C | p.Glu75Gln | p.E75Q | P19652 | protein_coding | deleterious(0.05) | benign(0.054) | TCGA-BH-A0HP-01 | Breast | breast invasive carcinoma | Female | >=65 | III/IV | Chemotherapy | doxorubicin | SD | |
| ORM2 | SNV | Missense_Mutation | novel | c.437N>A | p.Ala146Asp | p.A146D | P19652 | protein_coding | deleterious(0) | possibly_damaging(0.908) | TCGA-S3-AA11-01 | Breast | breast invasive carcinoma | Female | >=65 | I/II | Hormone Therapy | letrozole | CR |
| ORM2 | SNV | Missense_Mutation | novel | c.198C>A | p.Phe66Leu | p.F66L | P19652 | protein_coding | deleterious(0.01) | possibly_damaging(0.708) | TCGA-AA-A00N-01 | Colorectum | colon adenocarcinoma | Male | >=65 | I/II | Unknown | Unknown | PD |
| ORM2 | SNV | Missense_Mutation | rs748201206 | c.100G>A | p.Ala34Thr | p.A34T | P19652 | protein_coding | tolerated(0.05) | possibly_damaging(0.854) | TCGA-AM-5821-01 | Colorectum | colon adenocarcinoma | Female | >=65 | I/II | Unknown | Unknown | SD |
| ORM2 | SNV | Missense_Mutation | novel | c.428N>A | p.Ser143Tyr | p.S143Y | P19652 | protein_coding | deleterious(0) | possibly_damaging(0.891) | TCGA-AZ-4315-01 | Colorectum | colon adenocarcinoma | Male | <65 | I/II | Unknown | Unknown | SD |
| ORM2 | SNV | Missense_Mutation | novel | c.227N>C | p.Asp76Ala | p.D76A | P19652 | protein_coding | deleterious(0) | possibly_damaging(0.881) | TCGA-AG-A00Y-01 | Colorectum | rectum adenocarcinoma | Male | >=65 | I/II | Unknown | Unknown | PD |
| ORM2 | SNV | Missense_Mutation | rs768724177 | c.5N>T | p.Ala2Val | p.A2V | P19652 | protein_coding | tolerated(0.18) | benign(0.125) | TCGA-EI-6507-01 | Colorectum | rectum adenocarcinoma | Male | <65 | I/II | Unknown | Unknown | SD |
| ORM2 | SNV | Missense_Mutation | novel | c.225N>T | p.Glu75Asp | p.E75D | P19652 | protein_coding | tolerated(0.24) | benign(0.003) | TCGA-AP-A0LM-01 | Endometrium | uterine corpus endometrioid carcinoma | Female | <65 | III/IV | Chemotherapy | cisplatin | SD |
| ORM2 | SNV | Missense_Mutation | novel | c.289N>A | p.Leu97Met | p.L97M | P19652 | protein_coding | tolerated(0.11) | probably_damaging(0.973) | TCGA-AP-A1DK-01 | Endometrium | uterine corpus endometrioid carcinoma | Female | <65 | I/II | Unknown | Unknown | SD |
| Page: 1 2 3 |
Top |
Related drugs of malignant transformation related genes |
| Identification of chemicals and drugs interact with genes involved in malignant transfromation |
| (DGIdb 4.0) |
| Entrez ID | Symbol | Category | Interaction Types | Drug Claim Name | Drug Name | PMIDs |
| 5005 | ORM2 | DRUGGABLE GENOME | docetaxel | DOCETAXEL | 24619498 |
| Page: 1 |

Copyright 2023-Present -The University of Texas Health Science Center at Houston |