
|
|||||
|
 | |
| |
| |
| |
| |
| |
|
Gene: ORC6 |
Gene summary for ORC6 |
| Gene information | Species | Human | Gene symbol | ORC6 | Gene ID | 23594 |
| Gene name | origin recognition complex subunit 6 | |
| Gene Alias | ORC6L | |
| Cytomap | 16q11.2 | |
| Gene Type | protein-coding | GO ID | GO:0006139 | UniProtAcc | A0A024R6R3 |
Top |
Malignant transformation analysis |
| Identification of the aberrant gene expression in precancerous and cancerous lesions by comparing the gene expression of stem-like cells in diseased tissues with normal stem cells |
| Entrez ID | Symbol | Replicates | Species | Organ | Tissue | Adj P-value | Log2FC | Malignancy |
| 23594 | ORC6 | LZE2T | Human | Esophagus | ESCC | 4.73e-03 | 5.09e-01 | 0.082 |
| 23594 | ORC6 | LZE7T | Human | Esophagus | ESCC | 6.13e-07 | 4.41e-01 | 0.0667 |
| 23594 | ORC6 | LZE22T | Human | Esophagus | ESCC | 1.57e-02 | 2.75e-01 | 0.068 |
| 23594 | ORC6 | LZE24T | Human | Esophagus | ESCC | 1.46e-02 | 1.44e-01 | 0.0596 |
| 23594 | ORC6 | LZE21T | Human | Esophagus | ESCC | 1.16e-05 | 4.03e-01 | 0.0655 |
| 23594 | ORC6 | P1T-E | Human | Esophagus | ESCC | 4.62e-03 | 3.77e-01 | 0.0875 |
| 23594 | ORC6 | P2T-E | Human | Esophagus | ESCC | 2.20e-17 | 4.14e-01 | 0.1177 |
| 23594 | ORC6 | P4T-E | Human | Esophagus | ESCC | 1.44e-19 | 5.34e-01 | 0.1323 |
| 23594 | ORC6 | P5T-E | Human | Esophagus | ESCC | 2.13e-27 | 6.46e-01 | 0.1327 |
| 23594 | ORC6 | P8T-E | Human | Esophagus | ESCC | 5.79e-16 | 3.73e-01 | 0.0889 |
| 23594 | ORC6 | P10T-E | Human | Esophagus | ESCC | 4.44e-08 | 2.21e-01 | 0.116 |
| 23594 | ORC6 | P12T-E | Human | Esophagus | ESCC | 1.88e-11 | 2.18e-01 | 0.1122 |
| 23594 | ORC6 | P15T-E | Human | Esophagus | ESCC | 3.38e-04 | 1.92e-01 | 0.1149 |
| 23594 | ORC6 | P16T-E | Human | Esophagus | ESCC | 1.88e-11 | 2.90e-01 | 0.1153 |
| 23594 | ORC6 | P17T-E | Human | Esophagus | ESCC | 1.49e-05 | 3.39e-01 | 0.1278 |
| 23594 | ORC6 | P20T-E | Human | Esophagus | ESCC | 1.17e-04 | 1.79e-01 | 0.1124 |
| 23594 | ORC6 | P21T-E | Human | Esophagus | ESCC | 4.30e-10 | 3.20e-01 | 0.1617 |
| 23594 | ORC6 | P22T-E | Human | Esophagus | ESCC | 8.56e-12 | 2.93e-01 | 0.1236 |
| 23594 | ORC6 | P24T-E | Human | Esophagus | ESCC | 8.56e-12 | 3.61e-01 | 0.1287 |
| 23594 | ORC6 | P26T-E | Human | Esophagus | ESCC | 1.96e-05 | 2.44e-01 | 0.1276 |
| Page: 1 2 3 4 5 |
| Tissue | Expression Dynamics | Abbreviation |
| Esophagus | 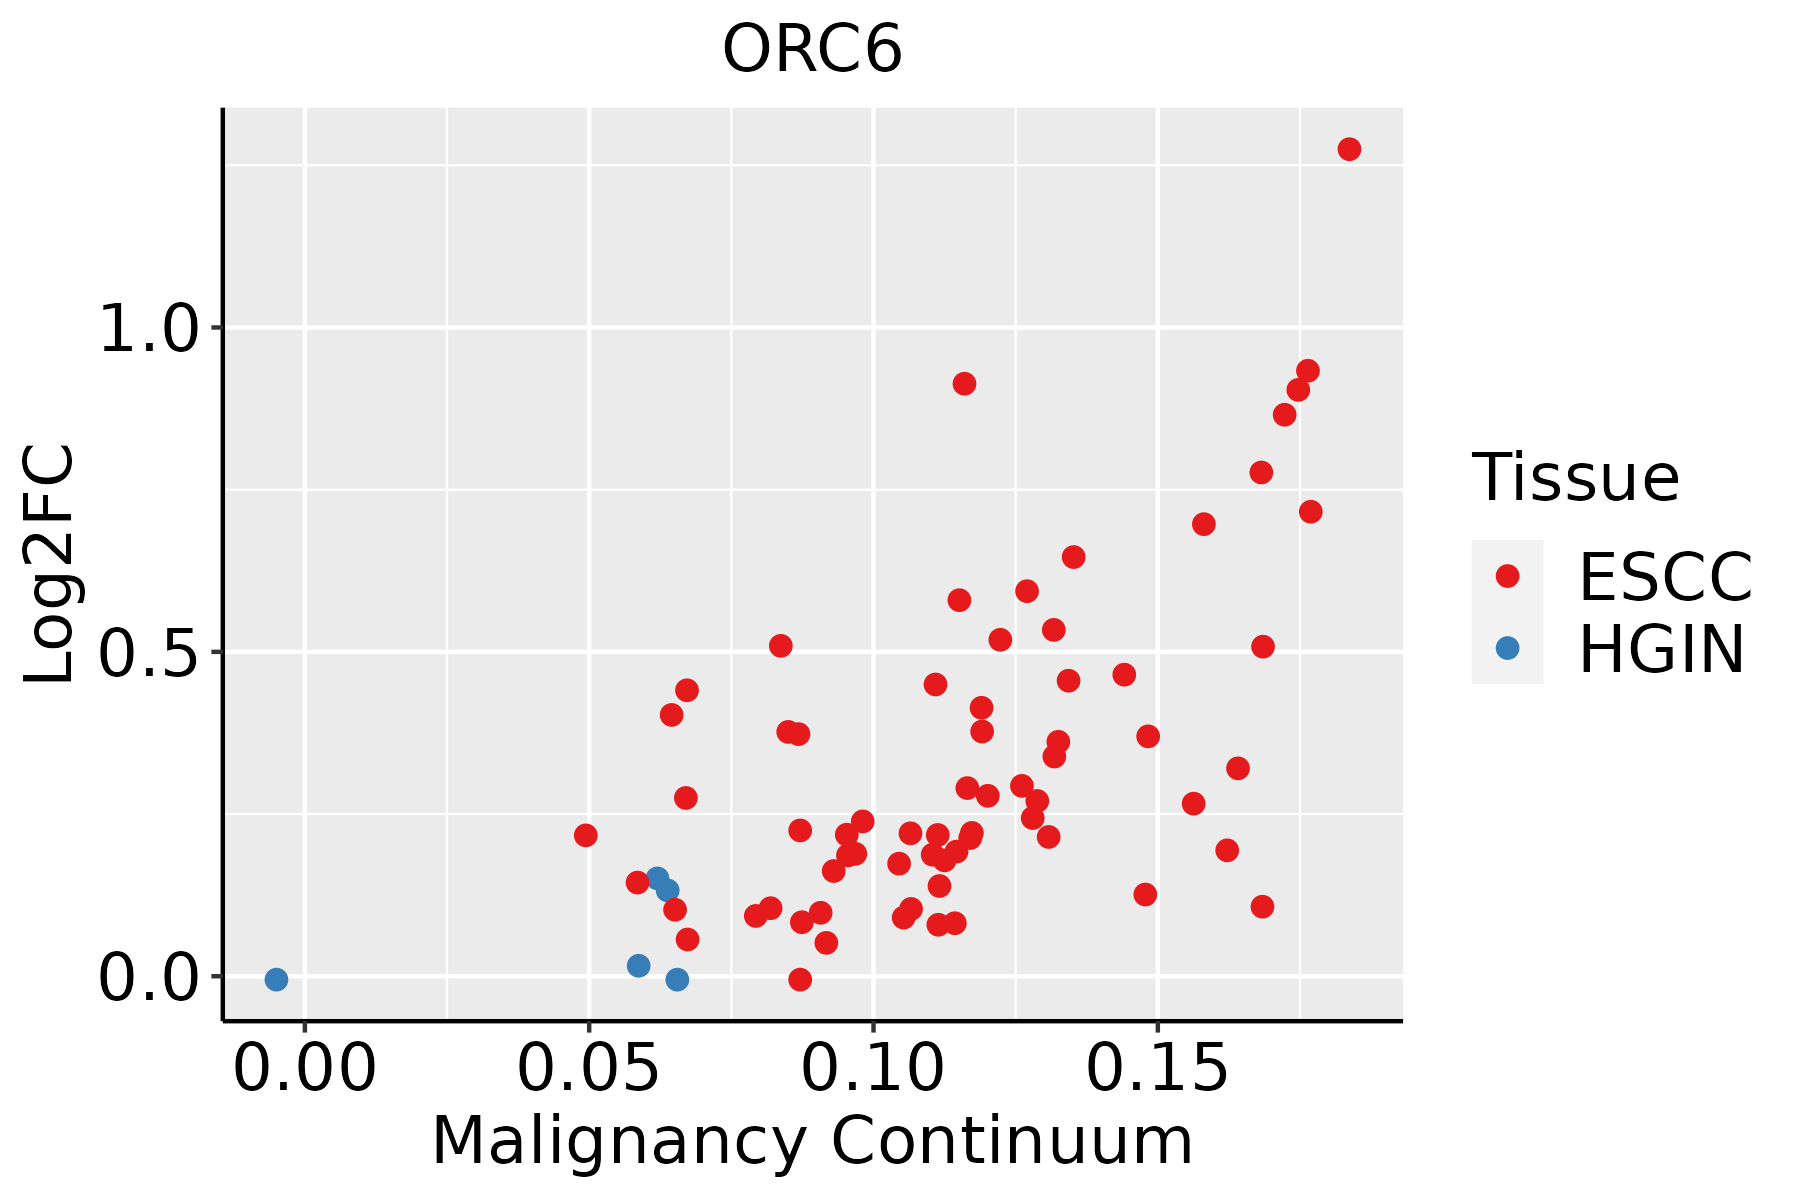 | ESCC: Esophageal squamous cell carcinoma |
| HGIN: High-grade intraepithelial neoplasias | ||
| LGIN: Low-grade intraepithelial neoplasias | ||
| Liver | 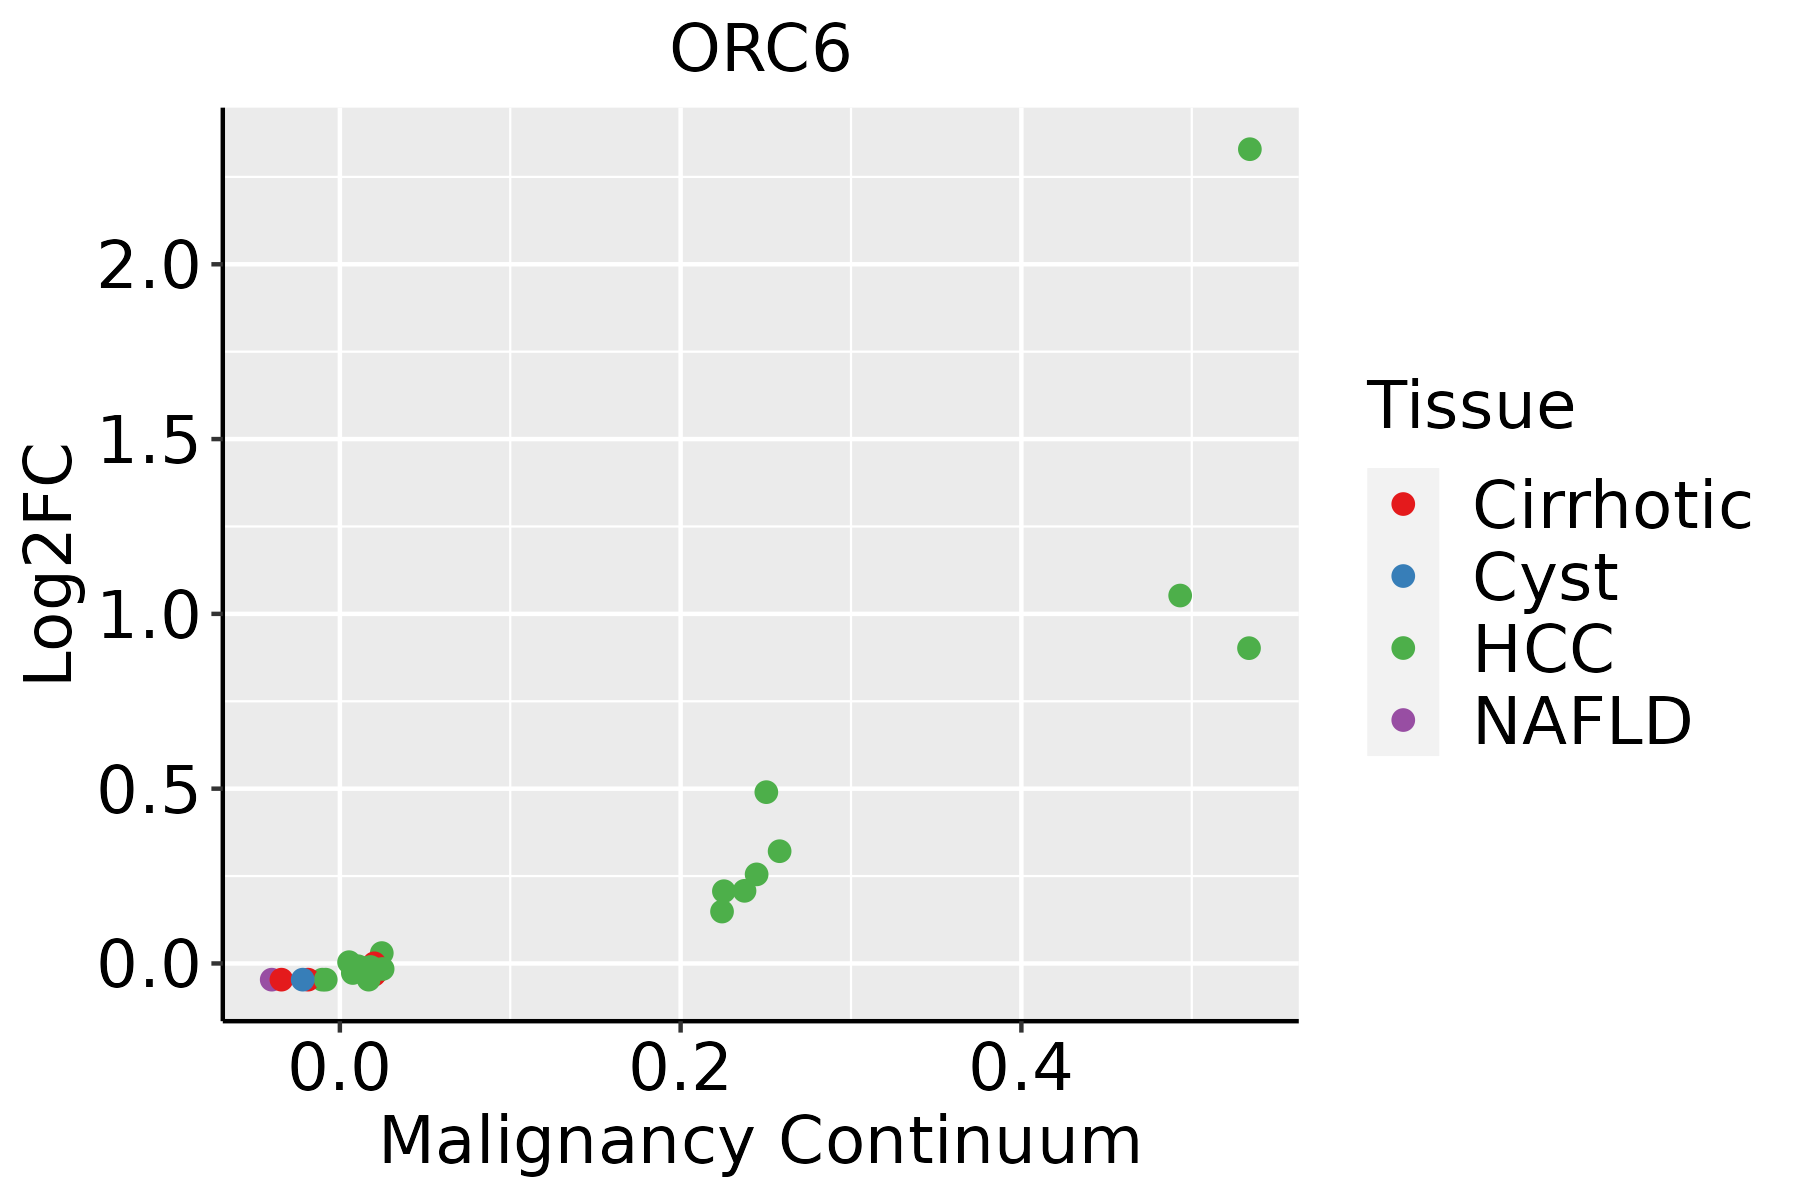 | HCC: Hepatocellular carcinoma |
| NAFLD: Non-alcoholic fatty liver disease | ||
| Oral Cavity | 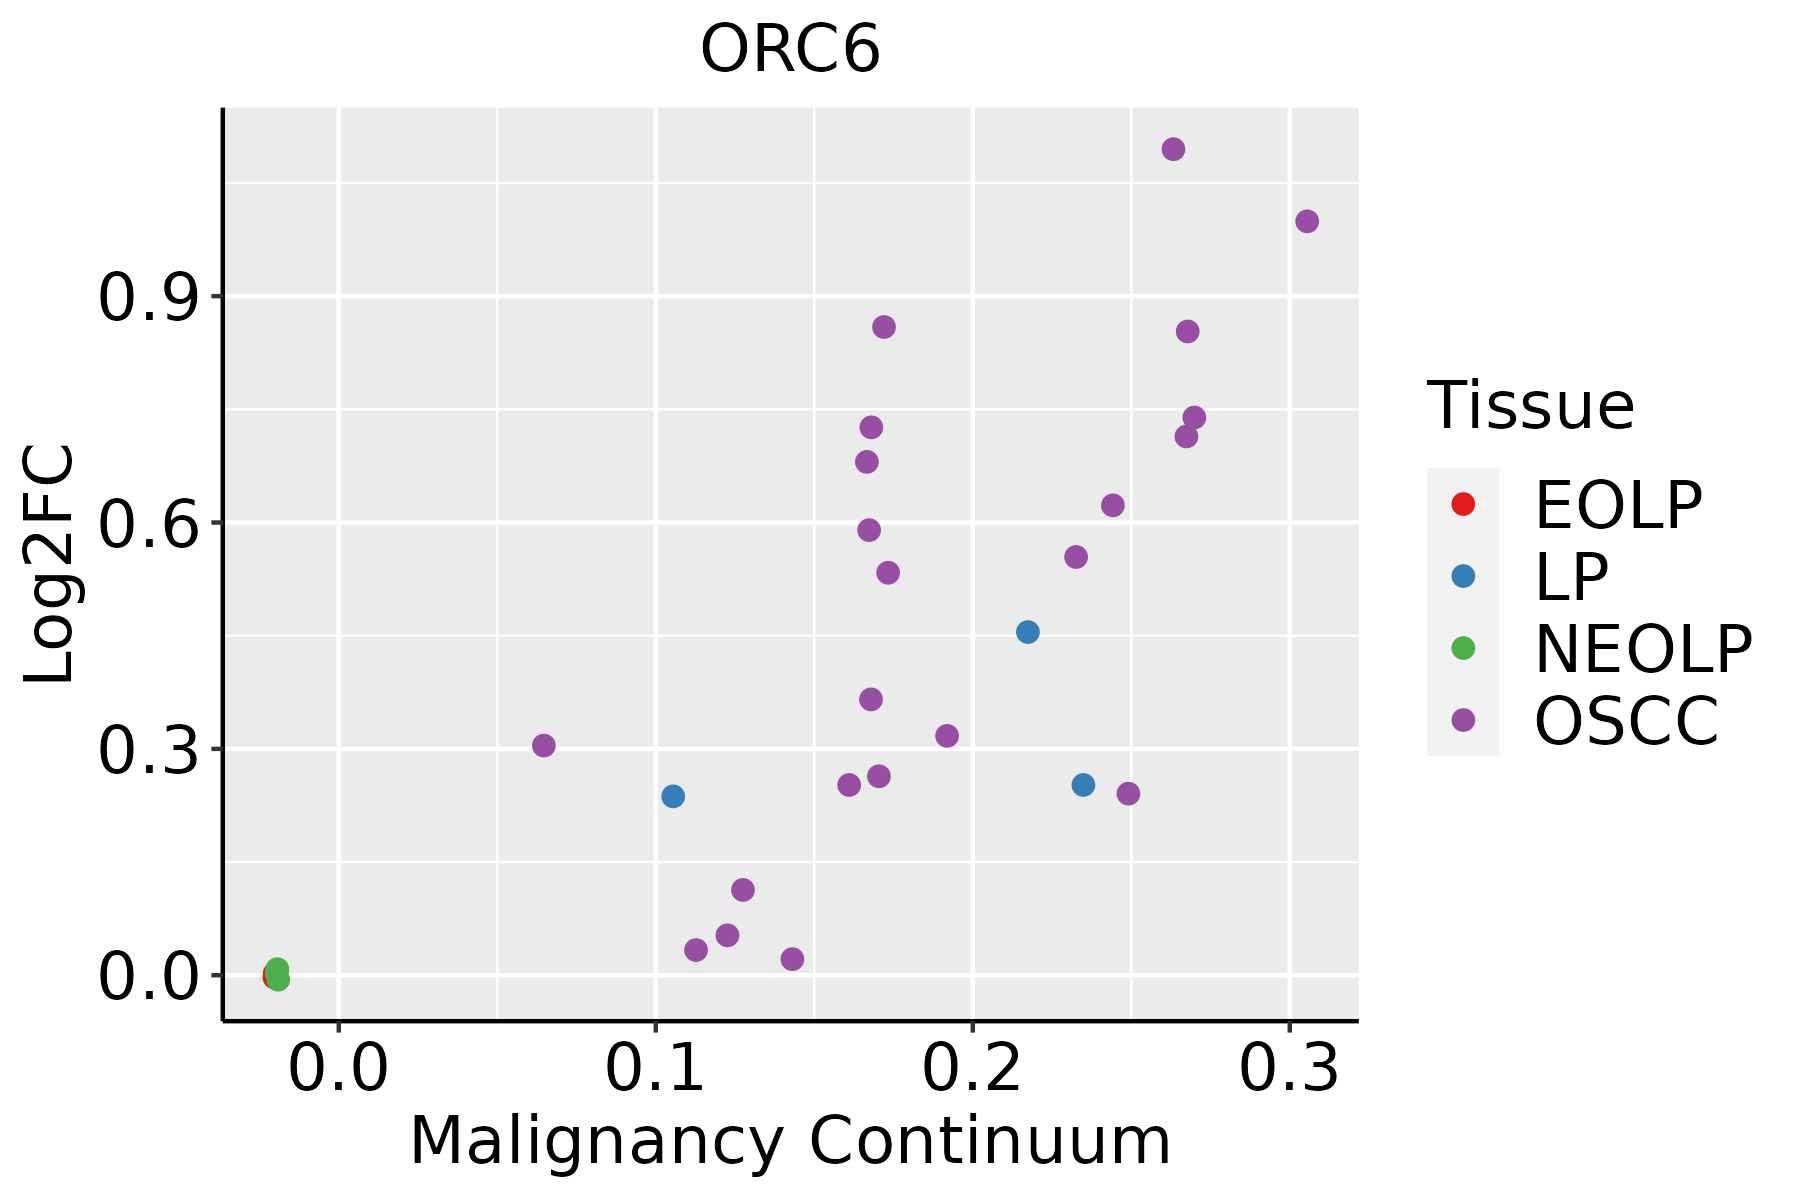 | EOLP: Erosive Oral lichen planus |
| LP: leukoplakia | ||
| NEOLP: Non-erosive oral lichen planus | ||
| OSCC: Oral squamous cell carcinoma | ||
| Skin |  | AK: Actinic keratosis |
| cSCC: Cutaneous squamous cell carcinoma | ||
| SCCIS:squamous cell carcinoma in situ | ||
| Thyroid |  | ATC: Anaplastic thyroid cancer |
| HT: Hashimoto's thyroiditis | ||
| PTC: Papillary thyroid cancer |
| ∗log2FC in expression of this searched gene in stem-like cells from each diseased tissue sample relative to stem-like cells in normal samples in each tissue plotted against the malignancy continuum. Samples are colored based on if they are from different disease stage. |
Top |
Malignant transformation related pathway analysis |
| Find out the enriched GO biological processes and KEGG pathways involved in transition from healthy to precancer to cancer |
| Tissue | Disease Stage | Enriched GO biological Processes |
| Colorectum | AD |  |
| Colorectum | SER |  |
| Colorectum | MSS |  |
| Colorectum | MSI-H |  |
| Colorectum | FAP |  |
| ∗Top 15 enriched GO BP terms are showed in the bar plot of each disease state in each tissue. Each row represents a significant GO biological process which is colored according to the -log10(p.adjust). |
| Page: 1 2 3 4 5 6 7 8 9 |
| GO ID | Tissue | Disease Stage | Description | Gene Ratio | Bg Ratio | pvalue | p.adjust | Count |
| GO:00062604 | Esophagus | ESCC | DNA replication | 181/8552 | 260/18723 | 3.55e-15 | 2.05e-13 | 181 |
| GO:00062612 | Esophagus | ESCC | DNA-dependent DNA replication | 100/8552 | 151/18723 | 2.61e-07 | 3.94e-06 | 100 |
| GO:00062701 | Esophagus | ESCC | DNA replication initiation | 27/8552 | 34/18723 | 6.01e-05 | 4.62e-04 | 27 |
| GO:00513025 | Esophagus | ESCC | regulation of cell division | 97/8552 | 177/18723 | 8.93e-03 | 3.12e-02 | 97 |
| GO:00062601 | Liver | HCC | DNA replication | 146/7958 | 260/18723 | 5.68e-06 | 7.02e-05 | 146 |
| GO:0006261 | Liver | HCC | DNA-dependent DNA replication | 80/7958 | 151/18723 | 5.91e-03 | 2.44e-02 | 80 |
| GO:00062603 | Oral cavity | OSCC | DNA replication | 159/7305 | 260/18723 | 3.25e-13 | 1.59e-11 | 159 |
| GO:00062611 | Oral cavity | OSCC | DNA-dependent DNA replication | 84/7305 | 151/18723 | 2.46e-05 | 2.30e-04 | 84 |
| GO:0006270 | Oral cavity | OSCC | DNA replication initiation | 25/7305 | 34/18723 | 4.63e-05 | 3.90e-04 | 25 |
| GO:00513024 | Oral cavity | OSCC | regulation of cell division | 87/7305 | 177/18723 | 3.75e-03 | 1.55e-02 | 87 |
| GO:000626012 | Skin | cSCC | DNA replication | 106/4864 | 260/18723 | 1.18e-07 | 2.77e-06 | 106 |
| GO:00513026 | Skin | cSCC | regulation of cell division | 61/4864 | 177/18723 | 7.34e-03 | 3.47e-02 | 61 |
| GO:000626013 | Thyroid | ATC | DNA replication | 124/6293 | 260/18723 | 1.58e-06 | 1.93e-05 | 124 |
| GO:00513027 | Thyroid | ATC | regulation of cell division | 80/6293 | 177/18723 | 8.54e-04 | 4.68e-03 | 80 |
| Page: 1 |
| Pathway ID | Tissue | Disease Stage | Description | Gene Ratio | Bg Ratio | pvalue | p.adjust | qvalue | Count |
| hsa0411023 | Esophagus | ESCC | Cell cycle | 126/4205 | 157/8465 | 1.34e-15 | 5.60e-14 | 2.87e-14 | 126 |
| hsa0411033 | Esophagus | ESCC | Cell cycle | 126/4205 | 157/8465 | 1.34e-15 | 5.60e-14 | 2.87e-14 | 126 |
| hsa041102 | Liver | HCC | Cell cycle | 106/4020 | 157/8465 | 2.54e-07 | 3.04e-06 | 1.69e-06 | 106 |
| hsa041103 | Liver | HCC | Cell cycle | 106/4020 | 157/8465 | 2.54e-07 | 3.04e-06 | 1.69e-06 | 106 |
| hsa041108 | Oral cavity | OSCC | Cell cycle | 118/3704 | 157/8465 | 7.15e-16 | 2.66e-14 | 1.35e-14 | 118 |
| hsa0411015 | Oral cavity | OSCC | Cell cycle | 118/3704 | 157/8465 | 7.15e-16 | 2.66e-14 | 1.35e-14 | 118 |
| Page: 1 |
Top |
Cell-cell communication analysis |
| Identification of potential cell-cell interactions between two cell types and their ligand-receptor pairs for different disease states |
| Ligand | Receptor | LRpair | Pathway | Tissue | Disease Stage |
| Page: 1 |
Top |
Single-cell gene regulatory network inference analysis |
| Find out the significant the regulons (TFs) and the target genes of each regulon across cell types for different disease states |
| TF | Cell Type | Tissue | Disease Stage | Target Gene | RSS | Regulon Activity |
| ∗The dot plots of a searched regulon are shown for all cell subpopulations in each disease state of each tissue based on the regulon specific score inferred using pySCENIC and by calculating the average expression. |
| Page: 1 |
Top |
Somatic mutation of malignant transformation related genes |
| Annotation of somatic variants for genes involved in malignant transformation |
| Hugo Symbol | Variant Class | Variant Classification | dbSNP RS | HGVSc | HGVSp | HGVSp Short | SWISSPROT | BIOTYPE | SIFT | PolyPhen | Tumor Sample Barcode | Tissue | Histology | Sex | Age | Stage | Therapy Types | Drugs | Outcome |
| ORC6 | SNV | Missense_Mutation | novel | c.754N>C | p.Glu252Gln | p.E252Q | Q9Y5N6 | protein_coding | deleterious_low_confidence(0.04) | benign(0.012) | TCGA-VS-A8EK-01 | Cervix | cervical & endocervical cancer | Female | >=65 | I/II | Chemotherapy | cisplatin | PD |
| ORC6 | SNV | Missense_Mutation | novel | c.543N>T | p.Lys181Asn | p.K181N | Q9Y5N6 | protein_coding | deleterious(0) | probably_damaging(0.937) | TCGA-VS-A8EL-01 | Cervix | cervical & endocervical cancer | Female | <65 | I/II | Chemotherapy | cisplatin | CR |
| ORC6 | SNV | Missense_Mutation | novel | c.648G>T | p.Glu216Asp | p.E216D | Q9Y5N6 | protein_coding | tolerated(0.59) | benign(0) | TCGA-VS-A94Z-01 | Cervix | cervical & endocervical cancer | Female | <65 | I/II | Chemotherapy | cisplatin | CR |
| ORC6 | SNV | Missense_Mutation | novel | c.132G>T | p.Glu44Asp | p.E44D | Q9Y5N6 | protein_coding | tolerated(0.32) | benign(0.03) | TCGA-AA-3947-01 | Colorectum | colon adenocarcinoma | Female | <65 | I/II | Unknown | Unknown | SD |
| ORC6 | SNV | Missense_Mutation | novel | c.513N>G | p.Ile171Met | p.I171M | Q9Y5N6 | protein_coding | deleterious(0.02) | benign(0.053) | TCGA-AY-6197-01 | Colorectum | colon adenocarcinoma | Male | <65 | I/II | Unknown | Unknown | SD |
| ORC6 | SNV | Missense_Mutation | rs376209987 | c.592N>T | p.Arg198Trp | p.R198W | Q9Y5N6 | protein_coding | tolerated(0.08) | benign(0.2) | TCGA-G4-6302-01 | Colorectum | colon adenocarcinoma | Female | >=65 | I/II | Unknown | Unknown | SD |
| ORC6 | deletion | Frame_Shift_Del | rs35441257 | c.501delN | p.Ala170LeufsTer10 | p.A170Lfs*10 | Q9Y5N6 | protein_coding | TCGA-CM-6162-01 | Colorectum | colon adenocarcinoma | Female | <65 | III/IV | Chemotherapy | oxaliplatin | SD | ||
| ORC6 | SNV | Missense_Mutation | c.119C>T | p.Ala40Val | p.A40V | Q9Y5N6 | protein_coding | deleterious(0.02) | possibly_damaging(0.784) | TCGA-AP-A0LG-01 | Endometrium | uterine corpus endometrioid carcinoma | Female | <65 | I/II | Unknown | Unknown | SD | |
| ORC6 | SNV | Missense_Mutation | novel | c.142N>A | p.Ala48Thr | p.A48T | Q9Y5N6 | protein_coding | deleterious(0.04) | probably_damaging(0.911) | TCGA-B5-A3FA-01 | Endometrium | uterine corpus endometrioid carcinoma | Female | >=65 | I/II | Unknown | Unknown | SD |
| ORC6 | SNV | Missense_Mutation | novel | c.737C>T | p.Ala246Val | p.A246V | Q9Y5N6 | protein_coding | deleterious(0.02) | possibly_damaging(0.702) | TCGA-BS-A0UF-01 | Endometrium | uterine corpus endometrioid carcinoma | Female | >=65 | I/II | Unknown | Unknown | SD |
| Page: 1 2 3 |
Top |
Related drugs of malignant transformation related genes |
| Identification of chemicals and drugs interact with genes involved in malignant transfromation |
| (DGIdb 4.0) |
| Entrez ID | Symbol | Category | Interaction Types | Drug Claim Name | Drug Name | PMIDs |
| Page: 1 |

Copyright 2023-Present -The University of Texas Health Science Center at Houston |