
|
|||||
|
 | |
| |
| |
| |
| |
| |
|
Gene: ORC5 |
Gene summary for ORC5 |
| Gene information | Species | Human | Gene symbol | ORC5 | Gene ID | 5001 |
| Gene name | origin recognition complex subunit 5 | |
| Gene Alias | ORC5L | |
| Cytomap | 7q22.1-q22.2 | |
| Gene Type | protein-coding | GO ID | GO:0006139 | UniProtAcc | A4D0P7 |
Top |
Malignant transformation analysis |
| Identification of the aberrant gene expression in precancerous and cancerous lesions by comparing the gene expression of stem-like cells in diseased tissues with normal stem cells |
| Entrez ID | Symbol | Replicates | Species | Organ | Tissue | Adj P-value | Log2FC | Malignancy |
| 5001 | ORC5 | LZE4T | Human | Esophagus | ESCC | 4.66e-04 | 1.65e-01 | 0.0811 |
| 5001 | ORC5 | LZE7T | Human | Esophagus | ESCC | 4.76e-04 | 3.07e-01 | 0.0667 |
| 5001 | ORC5 | LZE20T | Human | Esophagus | ESCC | 1.10e-04 | 1.69e-01 | 0.0662 |
| 5001 | ORC5 | LZE22T | Human | Esophagus | ESCC | 1.12e-03 | 3.08e-01 | 0.068 |
| 5001 | ORC5 | LZE24T | Human | Esophagus | ESCC | 4.39e-11 | 2.83e-01 | 0.0596 |
| 5001 | ORC5 | LZE21T | Human | Esophagus | ESCC | 1.92e-02 | 1.79e-01 | 0.0655 |
| 5001 | ORC5 | LZE6T | Human | Esophagus | ESCC | 1.26e-02 | 1.44e-01 | 0.0845 |
| 5001 | ORC5 | P1T-E | Human | Esophagus | ESCC | 4.48e-03 | 1.95e-01 | 0.0875 |
| 5001 | ORC5 | P2T-E | Human | Esophagus | ESCC | 5.19e-52 | 8.59e-01 | 0.1177 |
| 5001 | ORC5 | P4T-E | Human | Esophagus | ESCC | 4.89e-27 | 5.22e-01 | 0.1323 |
| 5001 | ORC5 | P5T-E | Human | Esophagus | ESCC | 1.92e-11 | 2.80e-01 | 0.1327 |
| 5001 | ORC5 | P8T-E | Human | Esophagus | ESCC | 2.80e-14 | 2.49e-01 | 0.0889 |
| 5001 | ORC5 | P9T-E | Human | Esophagus | ESCC | 2.71e-07 | 2.19e-01 | 0.1131 |
| 5001 | ORC5 | P10T-E | Human | Esophagus | ESCC | 2.72e-13 | 2.87e-01 | 0.116 |
| 5001 | ORC5 | P11T-E | Human | Esophagus | ESCC | 3.00e-08 | 3.21e-01 | 0.1426 |
| 5001 | ORC5 | P12T-E | Human | Esophagus | ESCC | 1.89e-21 | 4.55e-01 | 0.1122 |
| 5001 | ORC5 | P15T-E | Human | Esophagus | ESCC | 1.49e-25 | 5.38e-01 | 0.1149 |
| 5001 | ORC5 | P16T-E | Human | Esophagus | ESCC | 1.11e-28 | 4.53e-01 | 0.1153 |
| 5001 | ORC5 | P17T-E | Human | Esophagus | ESCC | 1.31e-08 | 4.42e-01 | 0.1278 |
| 5001 | ORC5 | P19T-E | Human | Esophagus | ESCC | 4.48e-03 | 3.77e-01 | 0.1662 |
| Page: 1 2 3 4 |
| Tissue | Expression Dynamics | Abbreviation |
| Esophagus | 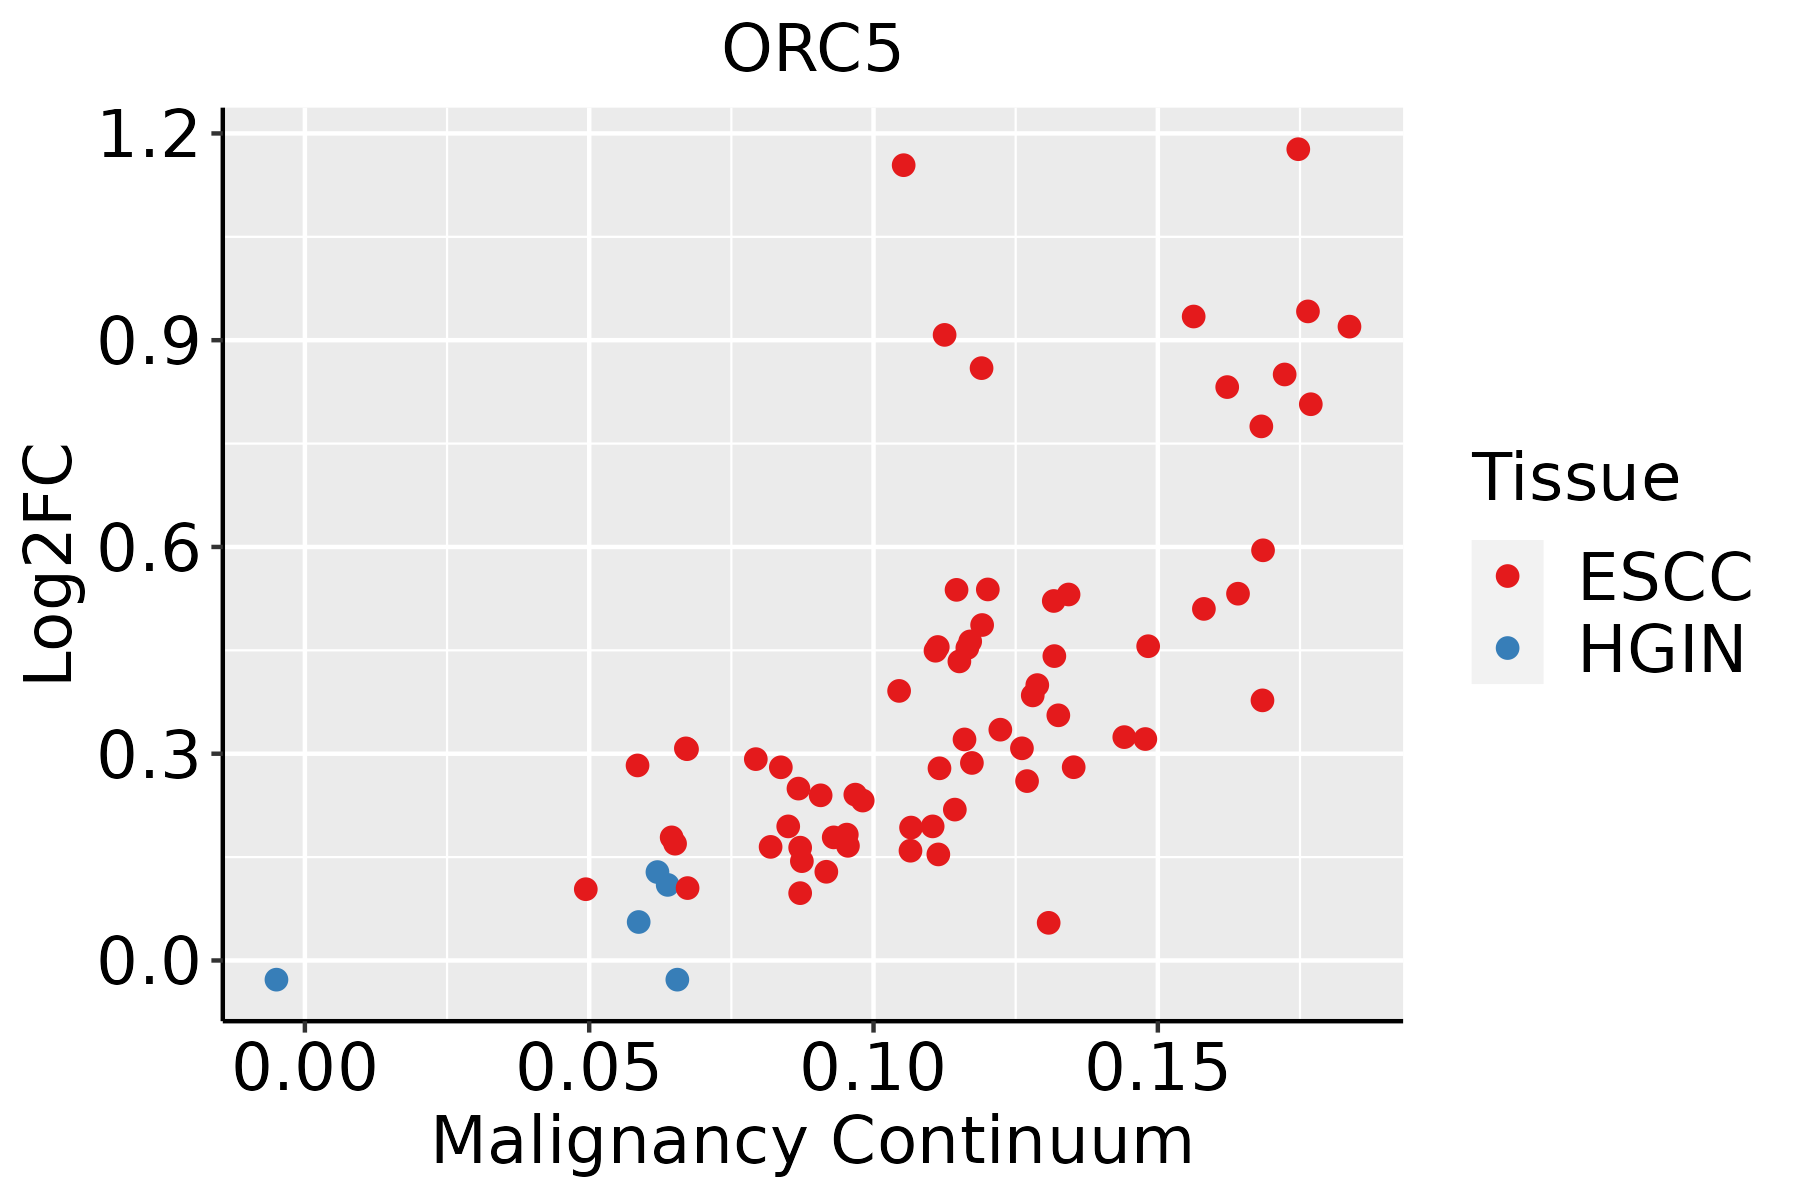 | ESCC: Esophageal squamous cell carcinoma |
| HGIN: High-grade intraepithelial neoplasias | ||
| LGIN: Low-grade intraepithelial neoplasias | ||
| Oral Cavity | 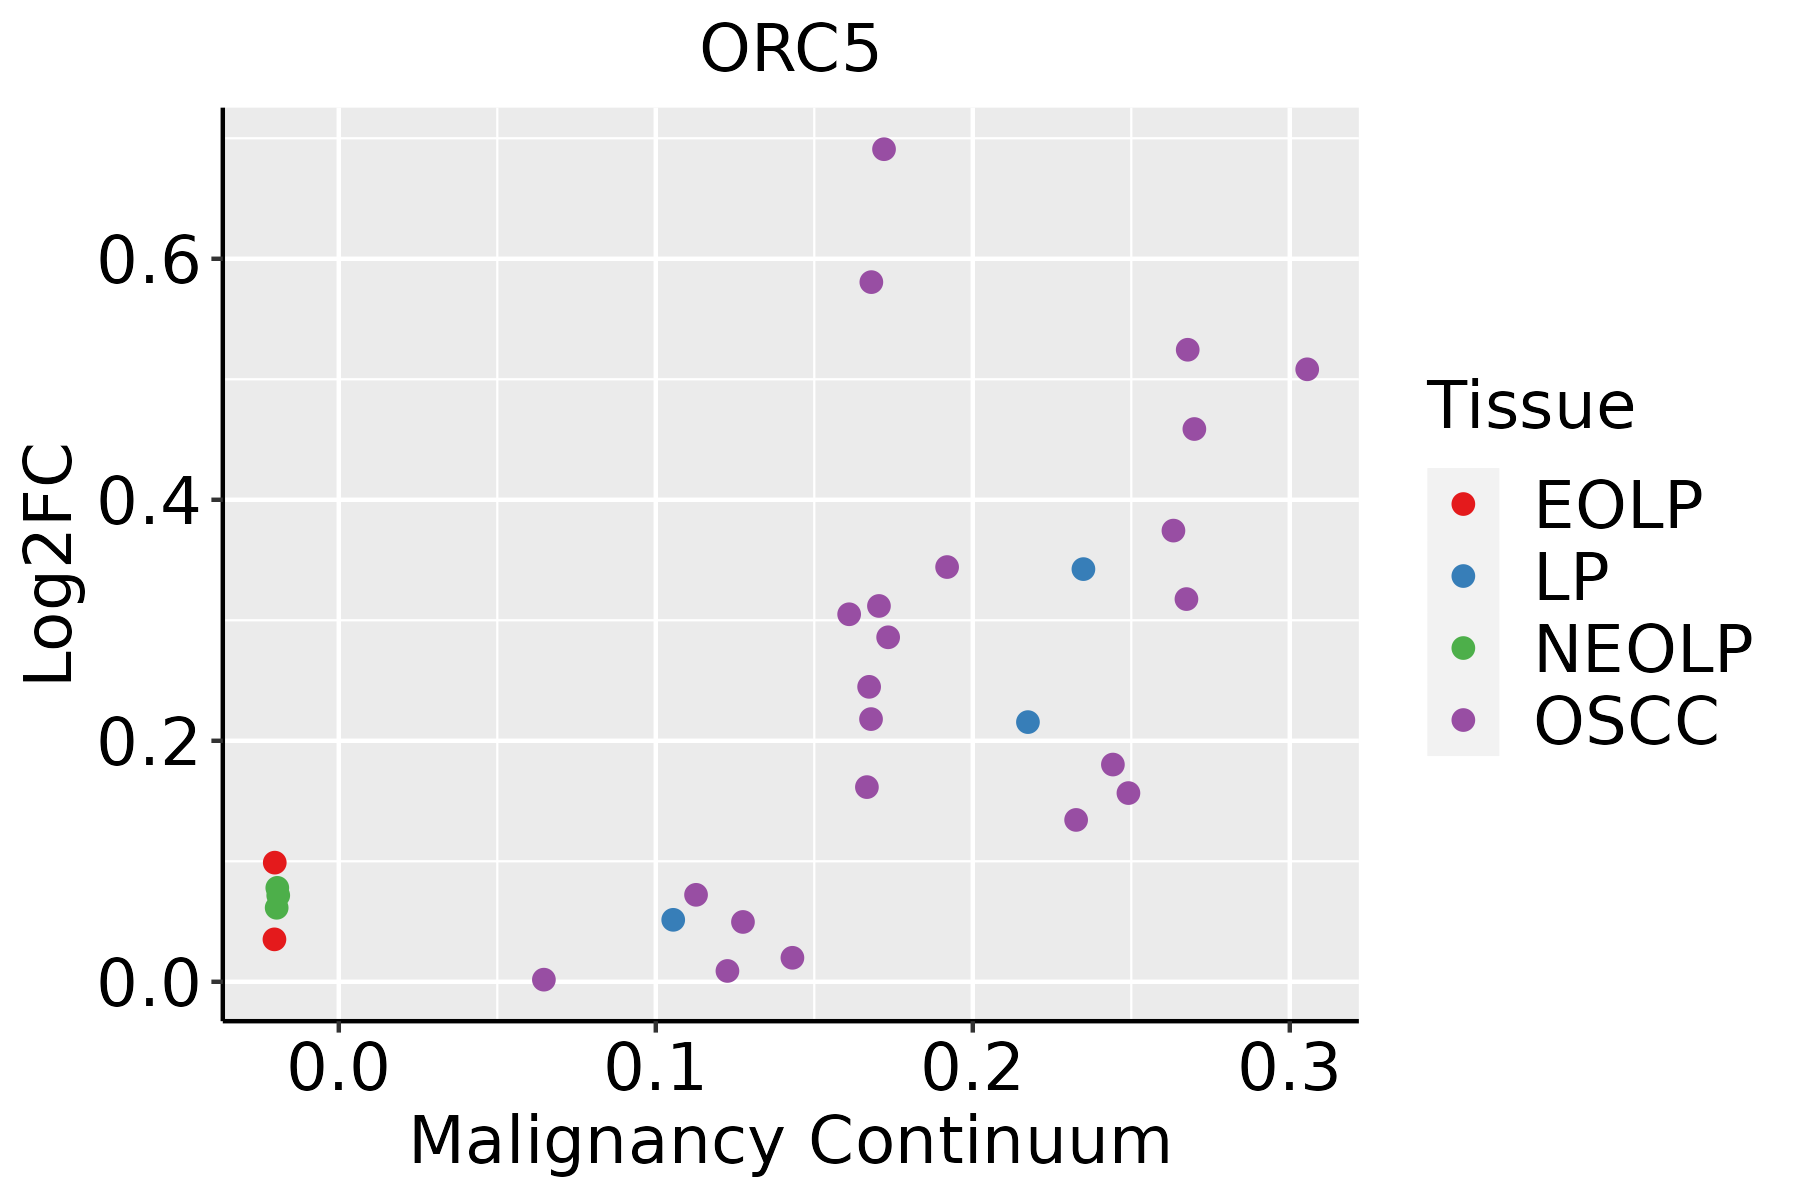 | EOLP: Erosive Oral lichen planus |
| LP: leukoplakia | ||
| NEOLP: Non-erosive oral lichen planus | ||
| OSCC: Oral squamous cell carcinoma |
| ∗log2FC in expression of this searched gene in stem-like cells from each diseased tissue sample relative to stem-like cells in normal samples in each tissue plotted against the malignancy continuum. Samples are colored based on if they are from different disease stage. |
Top |
Malignant transformation related pathway analysis |
| Find out the enriched GO biological processes and KEGG pathways involved in transition from healthy to precancer to cancer |
| Tissue | Disease Stage | Enriched GO biological Processes |
| Colorectum | AD |  |
| Colorectum | SER |  |
| Colorectum | MSS |  |
| Colorectum | MSI-H |  |
| Colorectum | FAP |  |
| ∗Top 15 enriched GO BP terms are showed in the bar plot of each disease state in each tissue. Each row represents a significant GO biological process which is colored according to the -log10(p.adjust). |
| Page: 1 2 3 4 5 6 7 8 9 |
| GO ID | Tissue | Disease Stage | Description | Gene Ratio | Bg Ratio | pvalue | p.adjust | Count |
| GO:00062604 | Esophagus | ESCC | DNA replication | 181/8552 | 260/18723 | 3.55e-15 | 2.05e-13 | 181 |
| GO:00062612 | Esophagus | ESCC | DNA-dependent DNA replication | 100/8552 | 151/18723 | 2.61e-07 | 3.94e-06 | 100 |
| GO:00062754 | Esophagus | ESCC | regulation of DNA replication | 73/8552 | 107/18723 | 1.97e-06 | 2.28e-05 | 73 |
| GO:00062701 | Esophagus | ESCC | DNA replication initiation | 27/8552 | 34/18723 | 6.01e-05 | 4.62e-04 | 27 |
| GO:00062603 | Oral cavity | OSCC | DNA replication | 159/7305 | 260/18723 | 3.25e-13 | 1.59e-11 | 159 |
| GO:00062611 | Oral cavity | OSCC | DNA-dependent DNA replication | 84/7305 | 151/18723 | 2.46e-05 | 2.30e-04 | 84 |
| GO:0006270 | Oral cavity | OSCC | DNA replication initiation | 25/7305 | 34/18723 | 4.63e-05 | 3.90e-04 | 25 |
| GO:00062753 | Oral cavity | OSCC | regulation of DNA replication | 62/7305 | 107/18723 | 5.49e-05 | 4.54e-04 | 62 |
| Page: 1 |
| Pathway ID | Tissue | Disease Stage | Description | Gene Ratio | Bg Ratio | pvalue | p.adjust | qvalue | Count |
| hsa0411023 | Esophagus | ESCC | Cell cycle | 126/4205 | 157/8465 | 1.34e-15 | 5.60e-14 | 2.87e-14 | 126 |
| hsa0411033 | Esophagus | ESCC | Cell cycle | 126/4205 | 157/8465 | 1.34e-15 | 5.60e-14 | 2.87e-14 | 126 |
| hsa041108 | Oral cavity | OSCC | Cell cycle | 118/3704 | 157/8465 | 7.15e-16 | 2.66e-14 | 1.35e-14 | 118 |
| hsa0411015 | Oral cavity | OSCC | Cell cycle | 118/3704 | 157/8465 | 7.15e-16 | 2.66e-14 | 1.35e-14 | 118 |
| Page: 1 |
Top |
Cell-cell communication analysis |
| Identification of potential cell-cell interactions between two cell types and their ligand-receptor pairs for different disease states |
| Ligand | Receptor | LRpair | Pathway | Tissue | Disease Stage |
| Page: 1 |
Top |
Single-cell gene regulatory network inference analysis |
| Find out the significant the regulons (TFs) and the target genes of each regulon across cell types for different disease states |
| TF | Cell Type | Tissue | Disease Stage | Target Gene | RSS | Regulon Activity |
| ∗The dot plots of a searched regulon are shown for all cell subpopulations in each disease state of each tissue based on the regulon specific score inferred using pySCENIC and by calculating the average expression. |
| Page: 1 |
Top |
Somatic mutation of malignant transformation related genes |
| Annotation of somatic variants for genes involved in malignant transformation |
| Hugo Symbol | Variant Class | Variant Classification | dbSNP RS | HGVSc | HGVSp | HGVSp Short | SWISSPROT | BIOTYPE | SIFT | PolyPhen | Tumor Sample Barcode | Tissue | Histology | Sex | Age | Stage | Therapy Types | Drugs | Outcome |
| ORC5 | SNV | Missense_Mutation | rs774410611 | c.379G>A | p.Ala127Thr | p.A127T | O43913 | protein_coding | deleterious(0.01) | probably_damaging(0.991) | TCGA-AN-A046-01 | Breast | breast invasive carcinoma | Female | >=65 | I/II | Unknown | Unknown | SD |
| ORC5 | SNV | Missense_Mutation | novel | c.533N>G | p.Tyr178Cys | p.Y178C | O43913 | protein_coding | deleterious(0.01) | benign(0.293) | TCGA-VS-A9U6-01 | Cervix | cervical & endocervical cancer | Female | <65 | I/II | Chemotherapy | cisplatin | PD |
| ORC5 | SNV | Missense_Mutation | rs746696962 | c.87N>G | p.Ser29Arg | p.S29R | O43913 | protein_coding | tolerated(0.22) | probably_damaging(0.925) | TCGA-AF-2687-01 | Colorectum | rectum adenocarcinoma | Male | <65 | III/IV | Chemotherapy | xeloda | PD |
| ORC5 | SNV | Missense_Mutation | rs749495781 | c.752G>A | p.Arg251His | p.R251H | O43913 | protein_coding | tolerated(0.97) | benign(0) | TCGA-F5-6814-01 | Colorectum | rectum adenocarcinoma | Male | <65 | I/II | Unknown | Unknown | SD |
| ORC5 | insertion | Frame_Shift_Ins | novel | c.1003_1004insA | p.Ile335AsnfsTer34 | p.I335Nfs*34 | O43913 | protein_coding | TCGA-A6-2686-01 | Colorectum | colon adenocarcinoma | Female | >=65 | I/II | Unknown | Unknown | SD | ||
| ORC5 | deletion | Frame_Shift_Del | c.1029delN | p.Lys343AsnfsTer17 | p.K343Nfs*17 | O43913 | protein_coding | TCGA-AA-3811-01 | Colorectum | colon adenocarcinoma | Female | >=65 | III/IV | Unknown | Unknown | PD | |||
| ORC5 | insertion | Frame_Shift_Ins | novel | c.1029_1030insA | p.His344ThrfsTer25 | p.H344Tfs*25 | O43913 | protein_coding | TCGA-AD-5900-01 | Colorectum | colon adenocarcinoma | Male | >=65 | I/II | Unknown | Unknown | SD | ||
| ORC5 | deletion | Frame_Shift_Del | c.1029delN | p.Lys343AsnfsTer17 | p.K343Nfs*17 | O43913 | protein_coding | TCGA-CM-6171-01 | Colorectum | colon adenocarcinoma | Female | >=65 | I/II | Unknown | Unknown | SD | |||
| ORC5 | deletion | Frame_Shift_Del | c.1029delA | p.Lys343AsnfsTer17 | p.K343Nfs*17 | O43913 | protein_coding | TCGA-F4-6856-01 | Colorectum | colon adenocarcinoma | Male | <65 | I/II | Ancillary | leucovorin | CR | |||
| ORC5 | SNV | Missense_Mutation | rs140616327 | c.1198G>A | p.Asp400Asn | p.D400N | O43913 | protein_coding | deleterious(0) | probably_damaging(0.985) | TCGA-A5-A0G2-01 | Endometrium | uterine corpus endometrioid carcinoma | Female | <65 | III/IV | Unknown | Unknown | SD |
| Page: 1 2 3 4 5 |
Top |
Related drugs of malignant transformation related genes |
| Identification of chemicals and drugs interact with genes involved in malignant transfromation |
| (DGIdb 4.0) |
| Entrez ID | Symbol | Category | Interaction Types | Drug Claim Name | Drug Name | PMIDs |
| Page: 1 |

Copyright 2023-Present -The University of Texas Health Science Center at Houston |