
|
|||||
|
 | |
| |
| |
| |
| |
| |
|
Gene: ORC4 |
Gene summary for ORC4 |
| Gene information | Species | Human | Gene symbol | ORC4 | Gene ID | 5000 |
| Gene name | origin recognition complex subunit 4 | |
| Gene Alias | ORC4L | |
| Cytomap | 2q23.1 | |
| Gene Type | protein-coding | GO ID | GO:0006139 | UniProtAcc | O43929 |
Top |
Malignant transformation analysis |
| Identification of the aberrant gene expression in precancerous and cancerous lesions by comparing the gene expression of stem-like cells in diseased tissues with normal stem cells |
| Entrez ID | Symbol | Replicates | Species | Organ | Tissue | Adj P-value | Log2FC | Malignancy |
| 5000 | ORC4 | LZE4T | Human | Esophagus | ESCC | 4.08e-17 | 4.69e-01 | 0.0811 |
| 5000 | ORC4 | LZE7T | Human | Esophagus | ESCC | 3.56e-07 | 5.80e-01 | 0.0667 |
| 5000 | ORC4 | LZE8T | Human | Esophagus | ESCC | 3.94e-06 | 1.62e-01 | 0.067 |
| 5000 | ORC4 | LZE20T | Human | Esophagus | ESCC | 5.40e-03 | 6.09e-02 | 0.0662 |
| 5000 | ORC4 | LZE24T | Human | Esophagus | ESCC | 8.65e-12 | 3.52e-01 | 0.0596 |
| 5000 | ORC4 | LZE21T | Human | Esophagus | ESCC | 2.75e-04 | 2.73e-01 | 0.0655 |
| 5000 | ORC4 | LZE6T | Human | Esophagus | ESCC | 1.33e-06 | 2.33e-01 | 0.0845 |
| 5000 | ORC4 | P1T-E | Human | Esophagus | ESCC | 6.02e-09 | 4.48e-01 | 0.0875 |
| 5000 | ORC4 | P2T-E | Human | Esophagus | ESCC | 2.53e-17 | 3.57e-01 | 0.1177 |
| 5000 | ORC4 | P4T-E | Human | Esophagus | ESCC | 5.67e-25 | 6.08e-01 | 0.1323 |
| 5000 | ORC4 | P5T-E | Human | Esophagus | ESCC | 7.56e-17 | 2.53e-01 | 0.1327 |
| 5000 | ORC4 | P8T-E | Human | Esophagus | ESCC | 1.64e-27 | 4.96e-01 | 0.0889 |
| 5000 | ORC4 | P9T-E | Human | Esophagus | ESCC | 1.60e-15 | 1.98e-01 | 0.1131 |
| 5000 | ORC4 | P10T-E | Human | Esophagus | ESCC | 1.95e-31 | 5.05e-01 | 0.116 |
| 5000 | ORC4 | P11T-E | Human | Esophagus | ESCC | 1.01e-13 | 5.71e-01 | 0.1426 |
| 5000 | ORC4 | P12T-E | Human | Esophagus | ESCC | 3.89e-33 | 6.92e-01 | 0.1122 |
| 5000 | ORC4 | P15T-E | Human | Esophagus | ESCC | 5.29e-27 | 5.07e-01 | 0.1149 |
| 5000 | ORC4 | P16T-E | Human | Esophagus | ESCC | 2.75e-27 | 5.71e-01 | 0.1153 |
| 5000 | ORC4 | P17T-E | Human | Esophagus | ESCC | 7.48e-04 | 2.22e-01 | 0.1278 |
| 5000 | ORC4 | P19T-E | Human | Esophagus | ESCC | 1.89e-04 | 3.13e-01 | 0.1662 |
| Page: 1 2 3 4 5 |
| Tissue | Expression Dynamics | Abbreviation |
| Esophagus |  | ESCC: Esophageal squamous cell carcinoma |
| HGIN: High-grade intraepithelial neoplasias | ||
| LGIN: Low-grade intraepithelial neoplasias | ||
| Liver |  | HCC: Hepatocellular carcinoma |
| NAFLD: Non-alcoholic fatty liver disease | ||
| Oral Cavity | 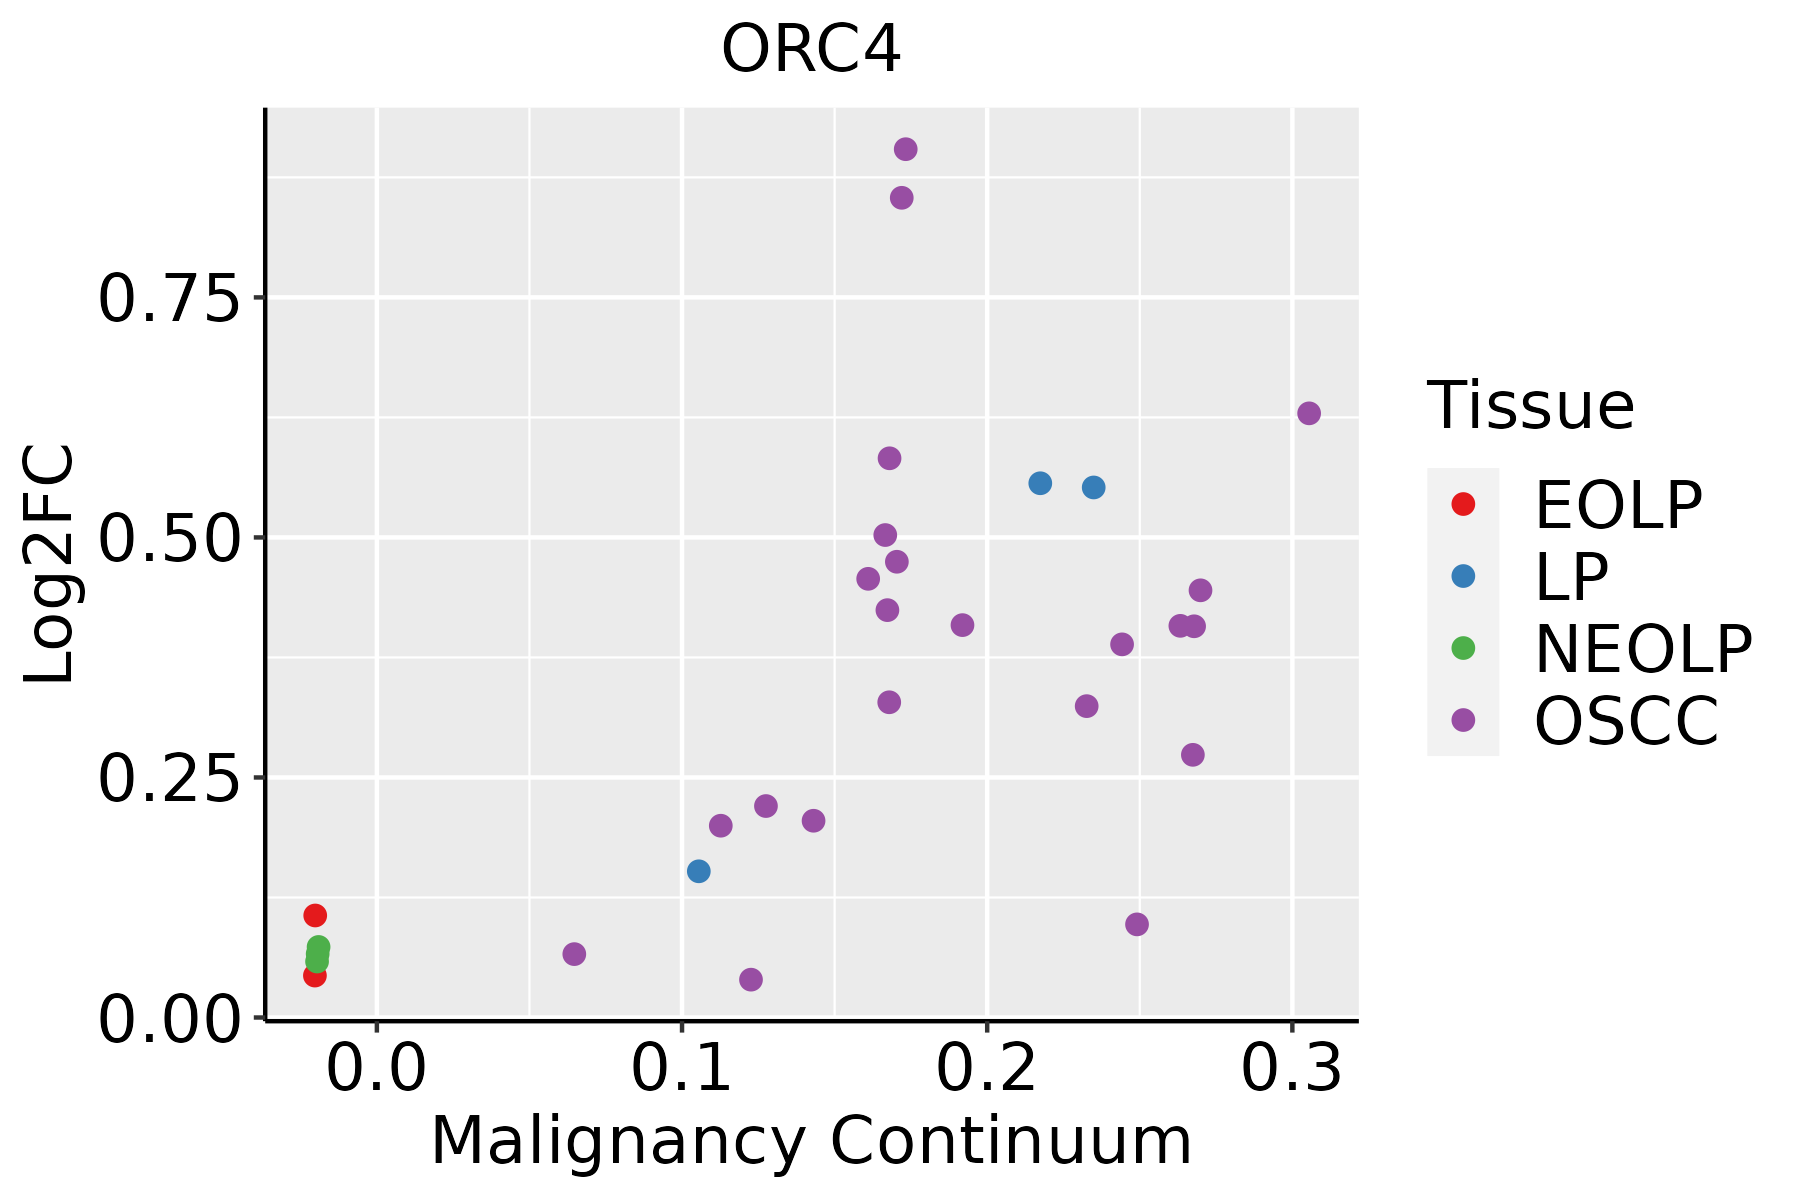 | EOLP: Erosive Oral lichen planus |
| LP: leukoplakia | ||
| NEOLP: Non-erosive oral lichen planus | ||
| OSCC: Oral squamous cell carcinoma | ||
| Skin | 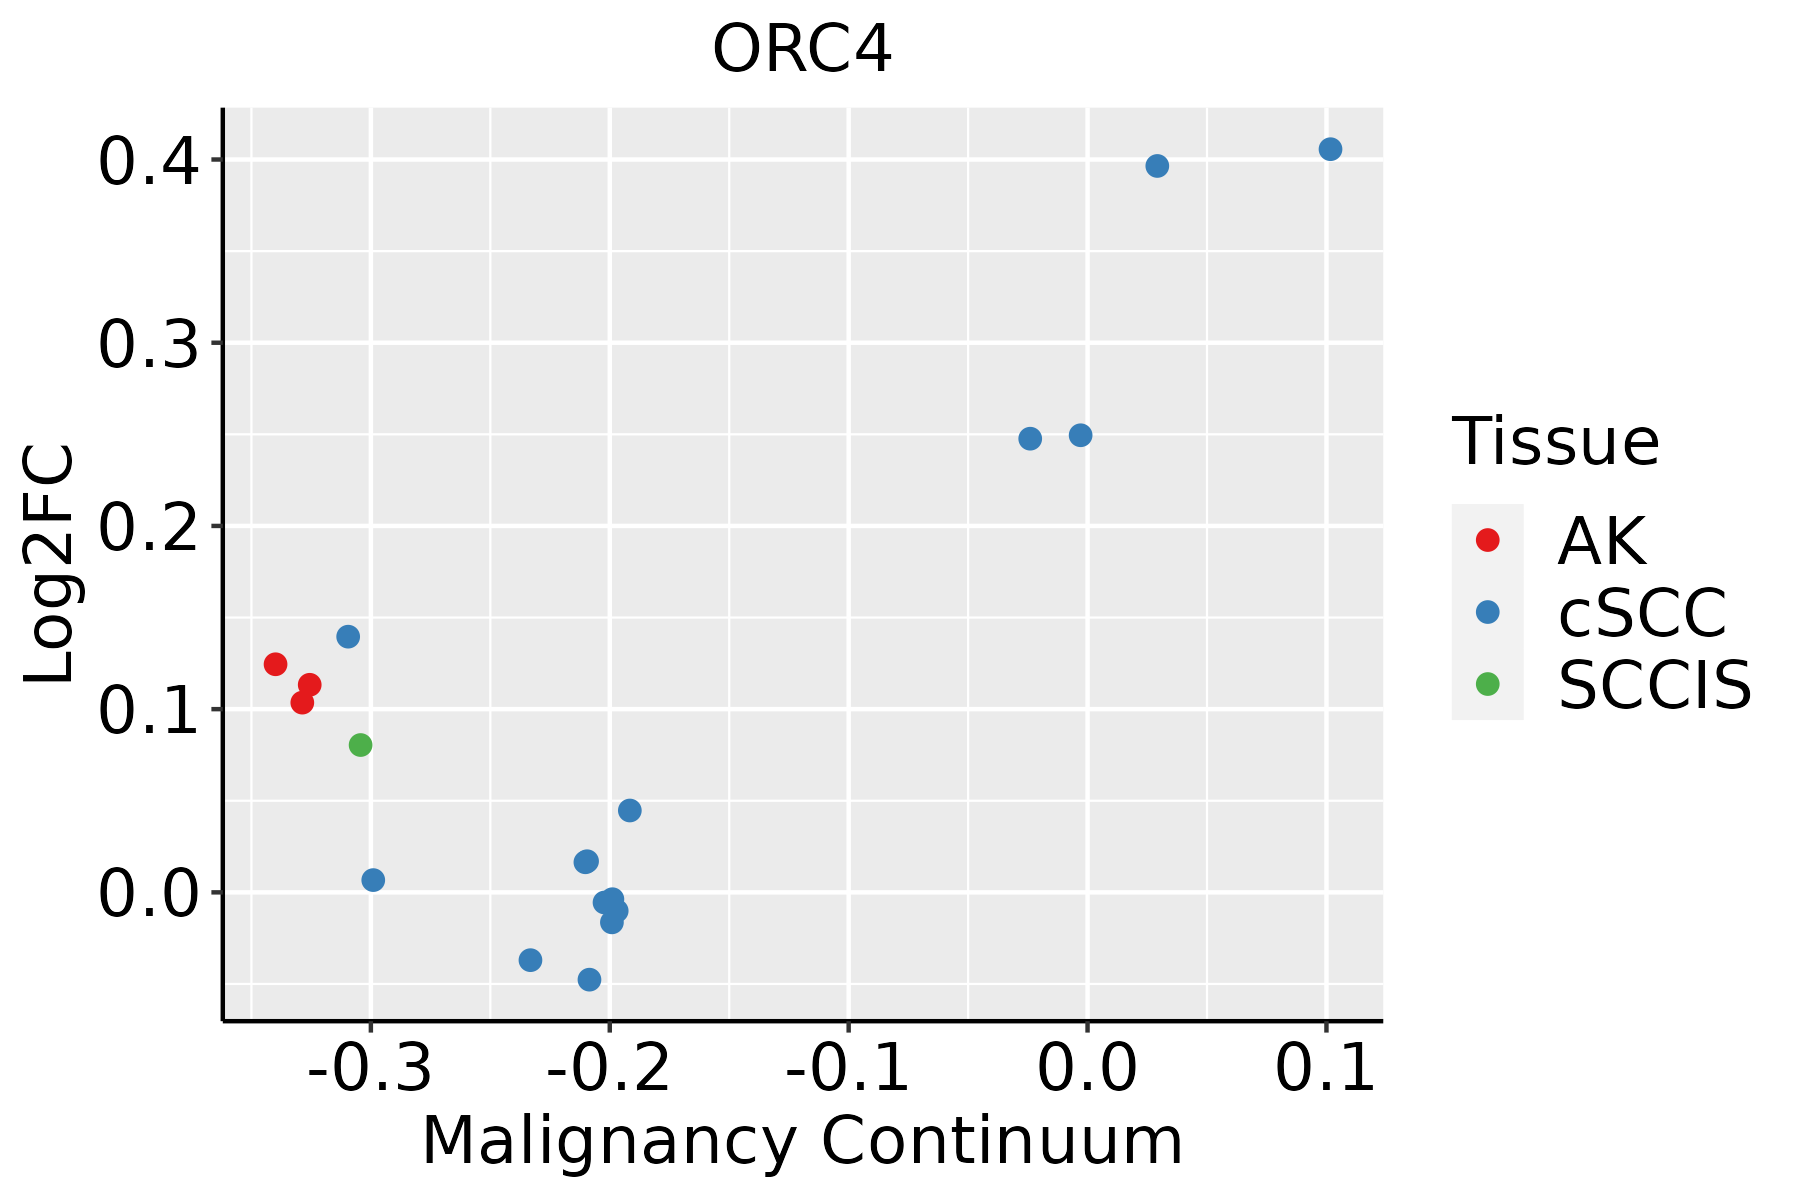 | AK: Actinic keratosis |
| cSCC: Cutaneous squamous cell carcinoma | ||
| SCCIS:squamous cell carcinoma in situ |
| ∗log2FC in expression of this searched gene in stem-like cells from each diseased tissue sample relative to stem-like cells in normal samples in each tissue plotted against the malignancy continuum. Samples are colored based on if they are from different disease stage. |
Top |
Malignant transformation related pathway analysis |
| Find out the enriched GO biological processes and KEGG pathways involved in transition from healthy to precancer to cancer |
| Tissue | Disease Stage | Enriched GO biological Processes |
| Colorectum | AD |  |
| Colorectum | SER |  |
| Colorectum | MSS |  |
| Colorectum | MSI-H |  |
| Colorectum | FAP |  |
| ∗Top 15 enriched GO BP terms are showed in the bar plot of each disease state in each tissue. Each row represents a significant GO biological process which is colored according to the -log10(p.adjust). |
| Page: 1 2 3 4 5 6 7 8 9 |
| GO ID | Tissue | Disease Stage | Description | Gene Ratio | Bg Ratio | pvalue | p.adjust | Count |
| GO:00062604 | Esophagus | ESCC | DNA replication | 181/8552 | 260/18723 | 3.55e-15 | 2.05e-13 | 181 |
| GO:00062612 | Esophagus | ESCC | DNA-dependent DNA replication | 100/8552 | 151/18723 | 2.61e-07 | 3.94e-06 | 100 |
| GO:00062701 | Esophagus | ESCC | DNA replication initiation | 27/8552 | 34/18723 | 6.01e-05 | 4.62e-04 | 27 |
| GO:00062601 | Liver | HCC | DNA replication | 146/7958 | 260/18723 | 5.68e-06 | 7.02e-05 | 146 |
| GO:0006261 | Liver | HCC | DNA-dependent DNA replication | 80/7958 | 151/18723 | 5.91e-03 | 2.44e-02 | 80 |
| GO:00062603 | Oral cavity | OSCC | DNA replication | 159/7305 | 260/18723 | 3.25e-13 | 1.59e-11 | 159 |
| GO:00062611 | Oral cavity | OSCC | DNA-dependent DNA replication | 84/7305 | 151/18723 | 2.46e-05 | 2.30e-04 | 84 |
| GO:0006270 | Oral cavity | OSCC | DNA replication initiation | 25/7305 | 34/18723 | 4.63e-05 | 3.90e-04 | 25 |
| GO:000626011 | Oral cavity | LP | DNA replication | 97/4623 | 260/18723 | 3.67e-06 | 7.75e-05 | 97 |
| GO:000626012 | Skin | cSCC | DNA replication | 106/4864 | 260/18723 | 1.18e-07 | 2.77e-06 | 106 |
| Page: 1 |
| Pathway ID | Tissue | Disease Stage | Description | Gene Ratio | Bg Ratio | pvalue | p.adjust | qvalue | Count |
| hsa0411023 | Esophagus | ESCC | Cell cycle | 126/4205 | 157/8465 | 1.34e-15 | 5.60e-14 | 2.87e-14 | 126 |
| hsa0411033 | Esophagus | ESCC | Cell cycle | 126/4205 | 157/8465 | 1.34e-15 | 5.60e-14 | 2.87e-14 | 126 |
| hsa041104 | Liver | Cirrhotic | Cell cycle | 61/2530 | 157/8465 | 9.53e-03 | 3.21e-02 | 1.98e-02 | 61 |
| hsa0411011 | Liver | Cirrhotic | Cell cycle | 61/2530 | 157/8465 | 9.53e-03 | 3.21e-02 | 1.98e-02 | 61 |
| hsa041102 | Liver | HCC | Cell cycle | 106/4020 | 157/8465 | 2.54e-07 | 3.04e-06 | 1.69e-06 | 106 |
| hsa041103 | Liver | HCC | Cell cycle | 106/4020 | 157/8465 | 2.54e-07 | 3.04e-06 | 1.69e-06 | 106 |
| hsa041108 | Oral cavity | OSCC | Cell cycle | 118/3704 | 157/8465 | 7.15e-16 | 2.66e-14 | 1.35e-14 | 118 |
| hsa0411015 | Oral cavity | OSCC | Cell cycle | 118/3704 | 157/8465 | 7.15e-16 | 2.66e-14 | 1.35e-14 | 118 |
| hsa0411022 | Oral cavity | LP | Cell cycle | 70/2418 | 157/8465 | 1.17e-05 | 8.27e-05 | 5.33e-05 | 70 |
| hsa0411032 | Oral cavity | LP | Cell cycle | 70/2418 | 157/8465 | 1.17e-05 | 8.27e-05 | 5.33e-05 | 70 |
| Page: 1 |
Top |
Cell-cell communication analysis |
| Identification of potential cell-cell interactions between two cell types and their ligand-receptor pairs for different disease states |
| Ligand | Receptor | LRpair | Pathway | Tissue | Disease Stage |
| Page: 1 |
Top |
Single-cell gene regulatory network inference analysis |
| Find out the significant the regulons (TFs) and the target genes of each regulon across cell types for different disease states |
| TF | Cell Type | Tissue | Disease Stage | Target Gene | RSS | Regulon Activity |
| ∗The dot plots of a searched regulon are shown for all cell subpopulations in each disease state of each tissue based on the regulon specific score inferred using pySCENIC and by calculating the average expression. |
| Page: 1 |
Top |
Somatic mutation of malignant transformation related genes |
| Annotation of somatic variants for genes involved in malignant transformation |
| Hugo Symbol | Variant Class | Variant Classification | dbSNP RS | HGVSc | HGVSp | HGVSp Short | SWISSPROT | BIOTYPE | SIFT | PolyPhen | Tumor Sample Barcode | Tissue | Histology | Sex | Age | Stage | Therapy Types | Drugs | Outcome |
| ORC4 | SNV | Missense_Mutation | novel | c.158N>T | p.Arg53Ile | p.R53I | O43929 | protein_coding | deleterious(0) | probably_damaging(0.984) | TCGA-AN-A046-01 | Breast | breast invasive carcinoma | Female | >=65 | I/II | Unknown | Unknown | SD |
| ORC4 | SNV | Missense_Mutation | c.496N>T | p.His166Tyr | p.H166Y | O43929 | protein_coding | tolerated(0.17) | benign(0.051) | TCGA-D8-A1JA-01 | Breast | breast invasive carcinoma | Female | <65 | III/IV | Chemotherapy | adriamycin | PD | |
| ORC4 | deletion | Frame_Shift_Del | novel | c.1259delN | p.Asn420ThrfsTer6 | p.N420Tfs*6 | O43929 | protein_coding | TCGA-EW-A2FV-01 | Breast | breast invasive carcinoma | Female | <65 | III/IV | Chemotherapy | docetaxel | SD | ||
| ORC4 | SNV | Missense_Mutation | c.478N>A | p.Glu160Lys | p.E160K | O43929 | protein_coding | deleterious(0) | probably_damaging(0.921) | TCGA-DR-A0ZM-01 | Cervix | cervical & endocervical cancer | Female | <65 | III/IV | Unspecific | Cisplatin | SD | |
| ORC4 | SNV | Missense_Mutation | c.607N>C | p.Glu203Gln | p.E203Q | O43929 | protein_coding | deleterious(0) | probably_damaging(0.997) | TCGA-Q1-A73O-01 | Cervix | cervical & endocervical cancer | Female | <65 | I/II | Chemotherapy | cisplatin | CR | |
| ORC4 | insertion | Frame_Shift_Ins | novel | c.1187_1188insA | p.Arg397GlufsTer12 | p.R397Efs*12 | O43929 | protein_coding | TCGA-JW-AAVH-01 | Cervix | cervical & endocervical cancer | Female | <65 | I/II | Unknown | Unknown | SD | ||
| ORC4 | SNV | Missense_Mutation | c.1241N>A | p.Ala414Asp | p.A414D | O43929 | protein_coding | deleterious(0) | possibly_damaging(0.485) | TCGA-AA-A010-01 | Colorectum | colon adenocarcinoma | Female | <65 | I/II | Chemotherapy | folinic | CR | |
| ORC4 | SNV | Missense_Mutation | c.403N>C | p.Asn135His | p.N135H | O43929 | protein_coding | deleterious(0) | possibly_damaging(0.908) | TCGA-G4-6628-01 | Colorectum | colon adenocarcinoma | Male | >=65 | I/II | Unknown | Unknown | SD | |
| ORC4 | SNV | Missense_Mutation | c.487N>A | p.Leu163Ile | p.L163I | O43929 | protein_coding | deleterious(0.02) | benign(0.18) | TCGA-NH-A8F7-06 | Colorectum | NA | NA | NA | NA | NA | NA | NA | |
| ORC4 | SNV | Missense_Mutation | novel | c.29N>A | p.Ser10Asn | p.S10N | O43929 | protein_coding | tolerated_low_confidence(0.47) | benign(0) | TCGA-A5-A0G2-01 | Endometrium | uterine corpus endometrioid carcinoma | Female | <65 | III/IV | Unknown | Unknown | SD |
| Page: 1 2 3 4 5 |
Top |
Related drugs of malignant transformation related genes |
| Identification of chemicals and drugs interact with genes involved in malignant transfromation |
| (DGIdb 4.0) |
| Entrez ID | Symbol | Category | Interaction Types | Drug Claim Name | Drug Name | PMIDs |
| Page: 1 |

Copyright 2023-Present -The University of Texas Health Science Center at Houston |