
|
|||||
|
 | |
| |
| |
| |
| |
| |
|
Gene: ORC3 |
Gene summary for ORC3 |
| Gene information | Species | Human | Gene symbol | ORC3 | Gene ID | 23595 |
| Gene name | origin recognition complex subunit 3 | |
| Gene Alias | LAT | |
| Cytomap | 6q15 | |
| Gene Type | protein-coding | GO ID | GO:0006139 | UniProtAcc | Q9UBD5 |
Top |
Malignant transformation analysis |
| Identification of the aberrant gene expression in precancerous and cancerous lesions by comparing the gene expression of stem-like cells in diseased tissues with normal stem cells |
| Entrez ID | Symbol | Replicates | Species | Organ | Tissue | Adj P-value | Log2FC | Malignancy |
| 23595 | ORC3 | LZE4T | Human | Esophagus | ESCC | 5.35e-05 | 1.65e-01 | 0.0811 |
| 23595 | ORC3 | LZE7T | Human | Esophagus | ESCC | 1.17e-05 | 3.50e-01 | 0.0667 |
| 23595 | ORC3 | LZE24T | Human | Esophagus | ESCC | 2.20e-09 | 2.87e-01 | 0.0596 |
| 23595 | ORC3 | LZE21T | Human | Esophagus | ESCC | 6.03e-04 | 2.60e-01 | 0.0655 |
| 23595 | ORC3 | LZE6T | Human | Esophagus | ESCC | 5.72e-04 | 1.71e-01 | 0.0845 |
| 23595 | ORC3 | P1T-E | Human | Esophagus | ESCC | 2.80e-02 | 1.48e-01 | 0.0875 |
| 23595 | ORC3 | P2T-E | Human | Esophagus | ESCC | 4.10e-17 | 3.88e-01 | 0.1177 |
| 23595 | ORC3 | P4T-E | Human | Esophagus | ESCC | 1.24e-15 | 4.31e-01 | 0.1323 |
| 23595 | ORC3 | P5T-E | Human | Esophagus | ESCC | 8.17e-27 | 4.45e-01 | 0.1327 |
| 23595 | ORC3 | P8T-E | Human | Esophagus | ESCC | 3.96e-14 | 2.66e-01 | 0.0889 |
| 23595 | ORC3 | P9T-E | Human | Esophagus | ESCC | 9.15e-07 | 1.39e-01 | 0.1131 |
| 23595 | ORC3 | P10T-E | Human | Esophagus | ESCC | 4.56e-13 | 2.78e-01 | 0.116 |
| 23595 | ORC3 | P11T-E | Human | Esophagus | ESCC | 8.28e-19 | 5.21e-01 | 0.1426 |
| 23595 | ORC3 | P12T-E | Human | Esophagus | ESCC | 5.92e-16 | 3.46e-01 | 0.1122 |
| 23595 | ORC3 | P15T-E | Human | Esophagus | ESCC | 1.94e-11 | 2.62e-01 | 0.1149 |
| 23595 | ORC3 | P16T-E | Human | Esophagus | ESCC | 3.00e-26 | 4.77e-01 | 0.1153 |
| 23595 | ORC3 | P17T-E | Human | Esophagus | ESCC | 2.07e-05 | 2.67e-01 | 0.1278 |
| 23595 | ORC3 | P19T-E | Human | Esophagus | ESCC | 3.12e-03 | 2.97e-01 | 0.1662 |
| 23595 | ORC3 | P20T-E | Human | Esophagus | ESCC | 1.39e-09 | 1.85e-01 | 0.1124 |
| 23595 | ORC3 | P21T-E | Human | Esophagus | ESCC | 1.35e-24 | 4.47e-01 | 0.1617 |
| Page: 1 2 3 4 5 |
| Tissue | Expression Dynamics | Abbreviation |
| Esophagus | 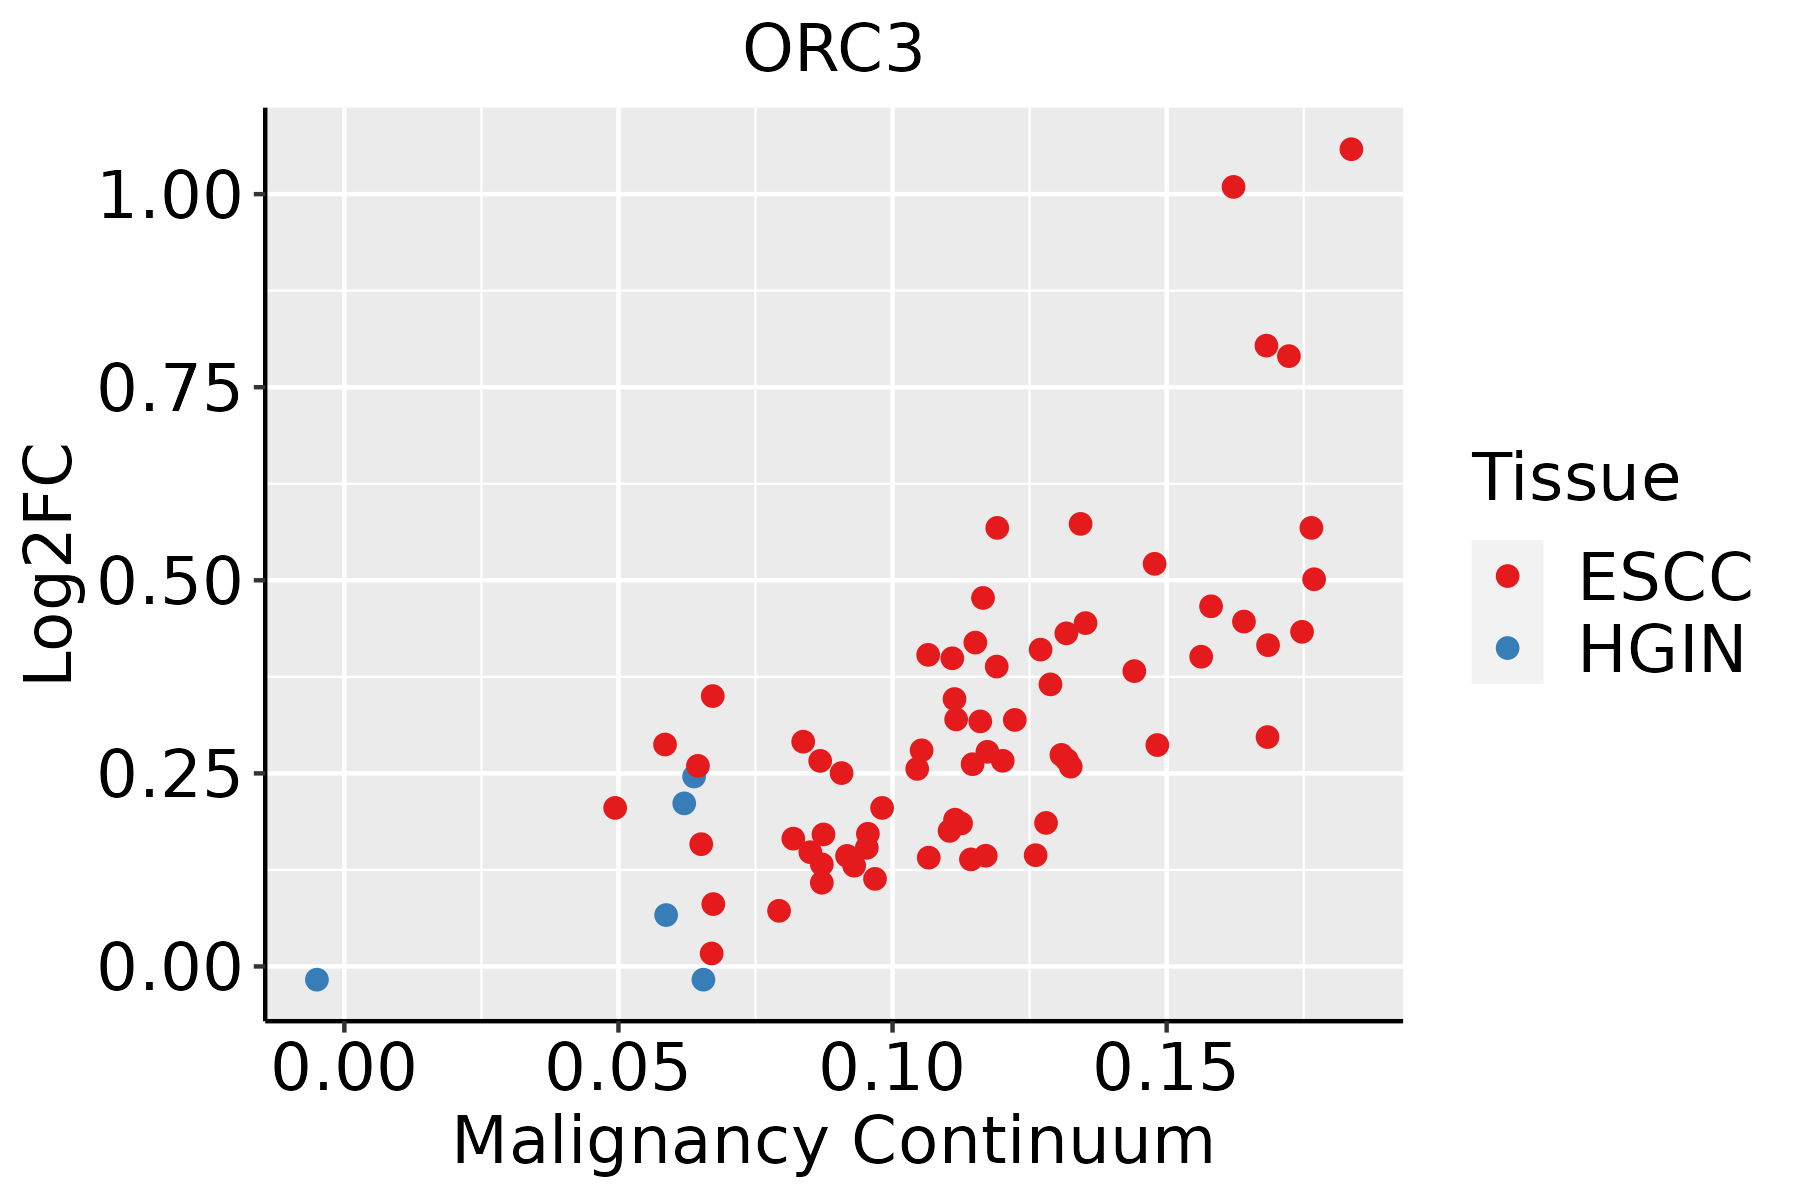 | ESCC: Esophageal squamous cell carcinoma |
| HGIN: High-grade intraepithelial neoplasias | ||
| LGIN: Low-grade intraepithelial neoplasias | ||
| Liver | 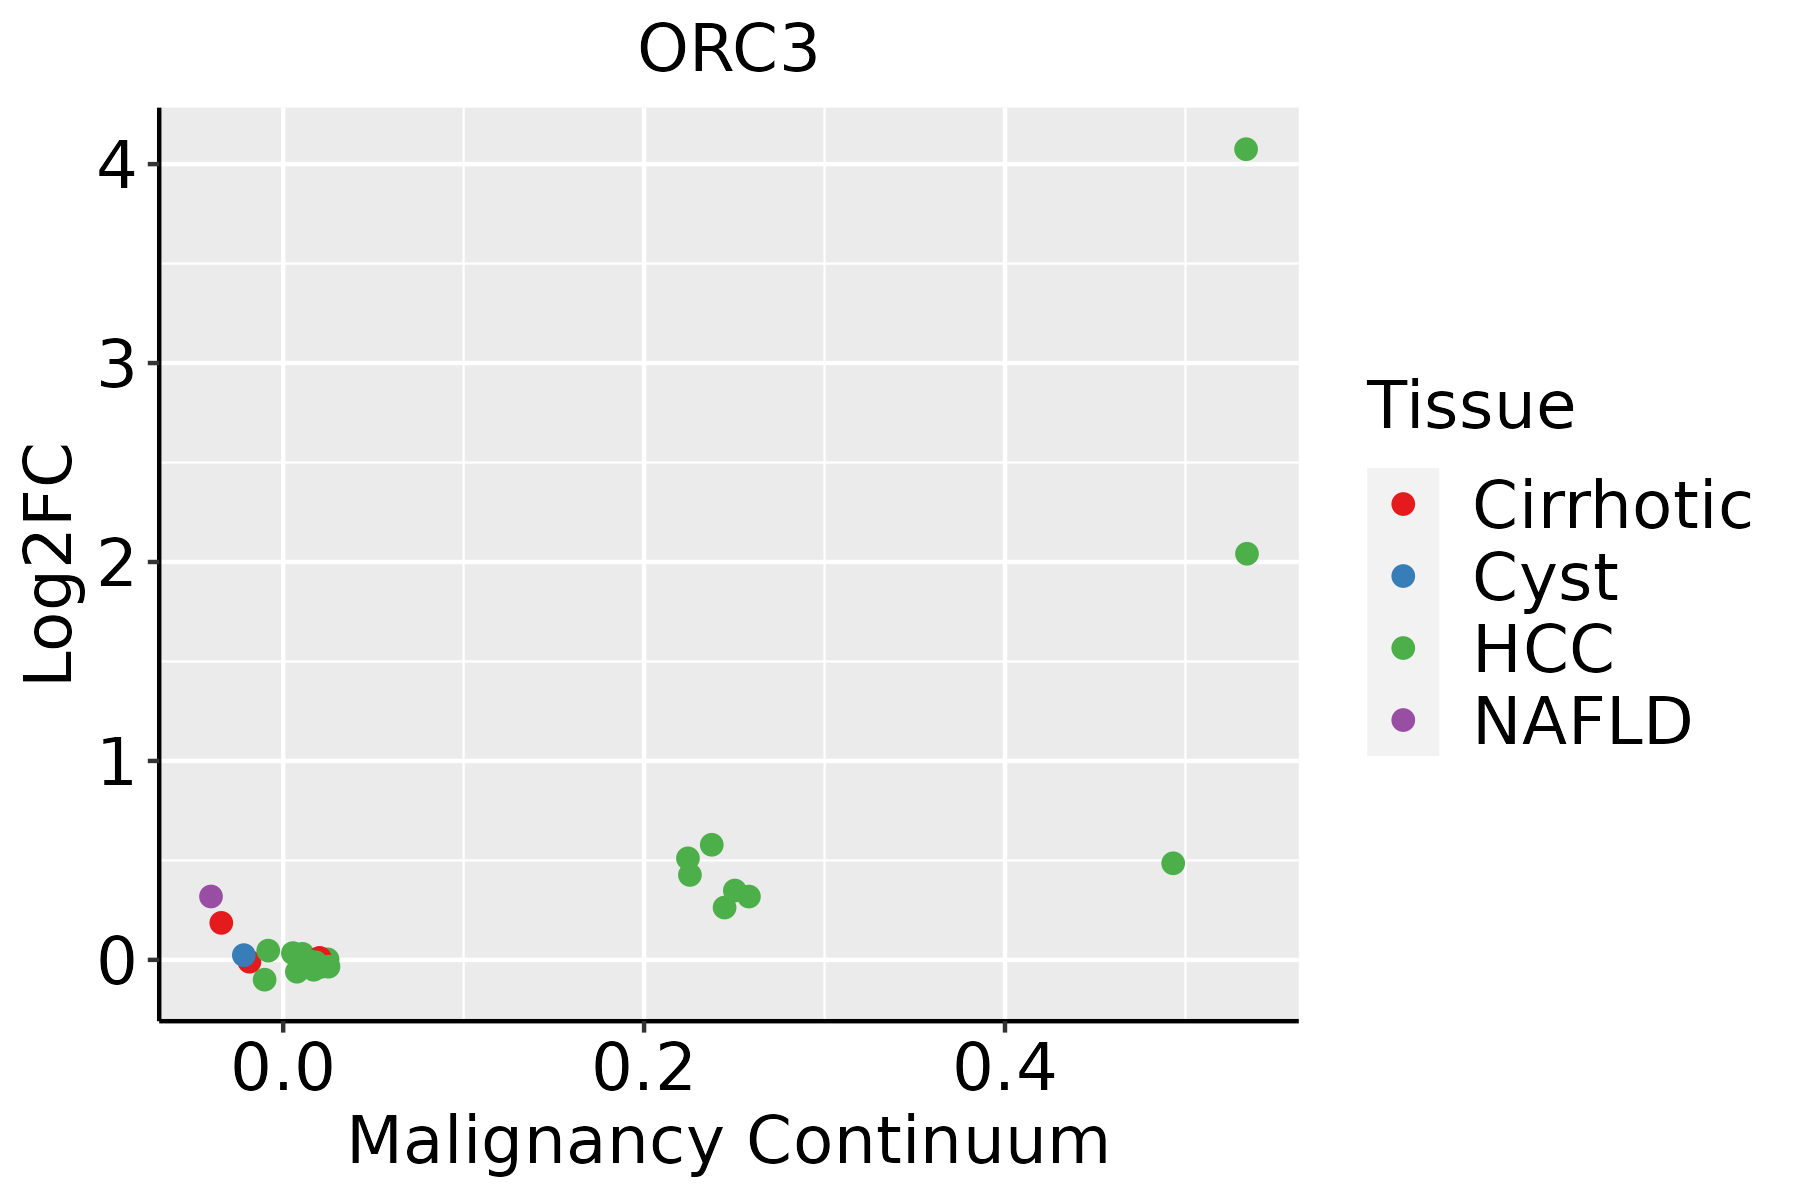 | HCC: Hepatocellular carcinoma |
| NAFLD: Non-alcoholic fatty liver disease | ||
| Oral Cavity | 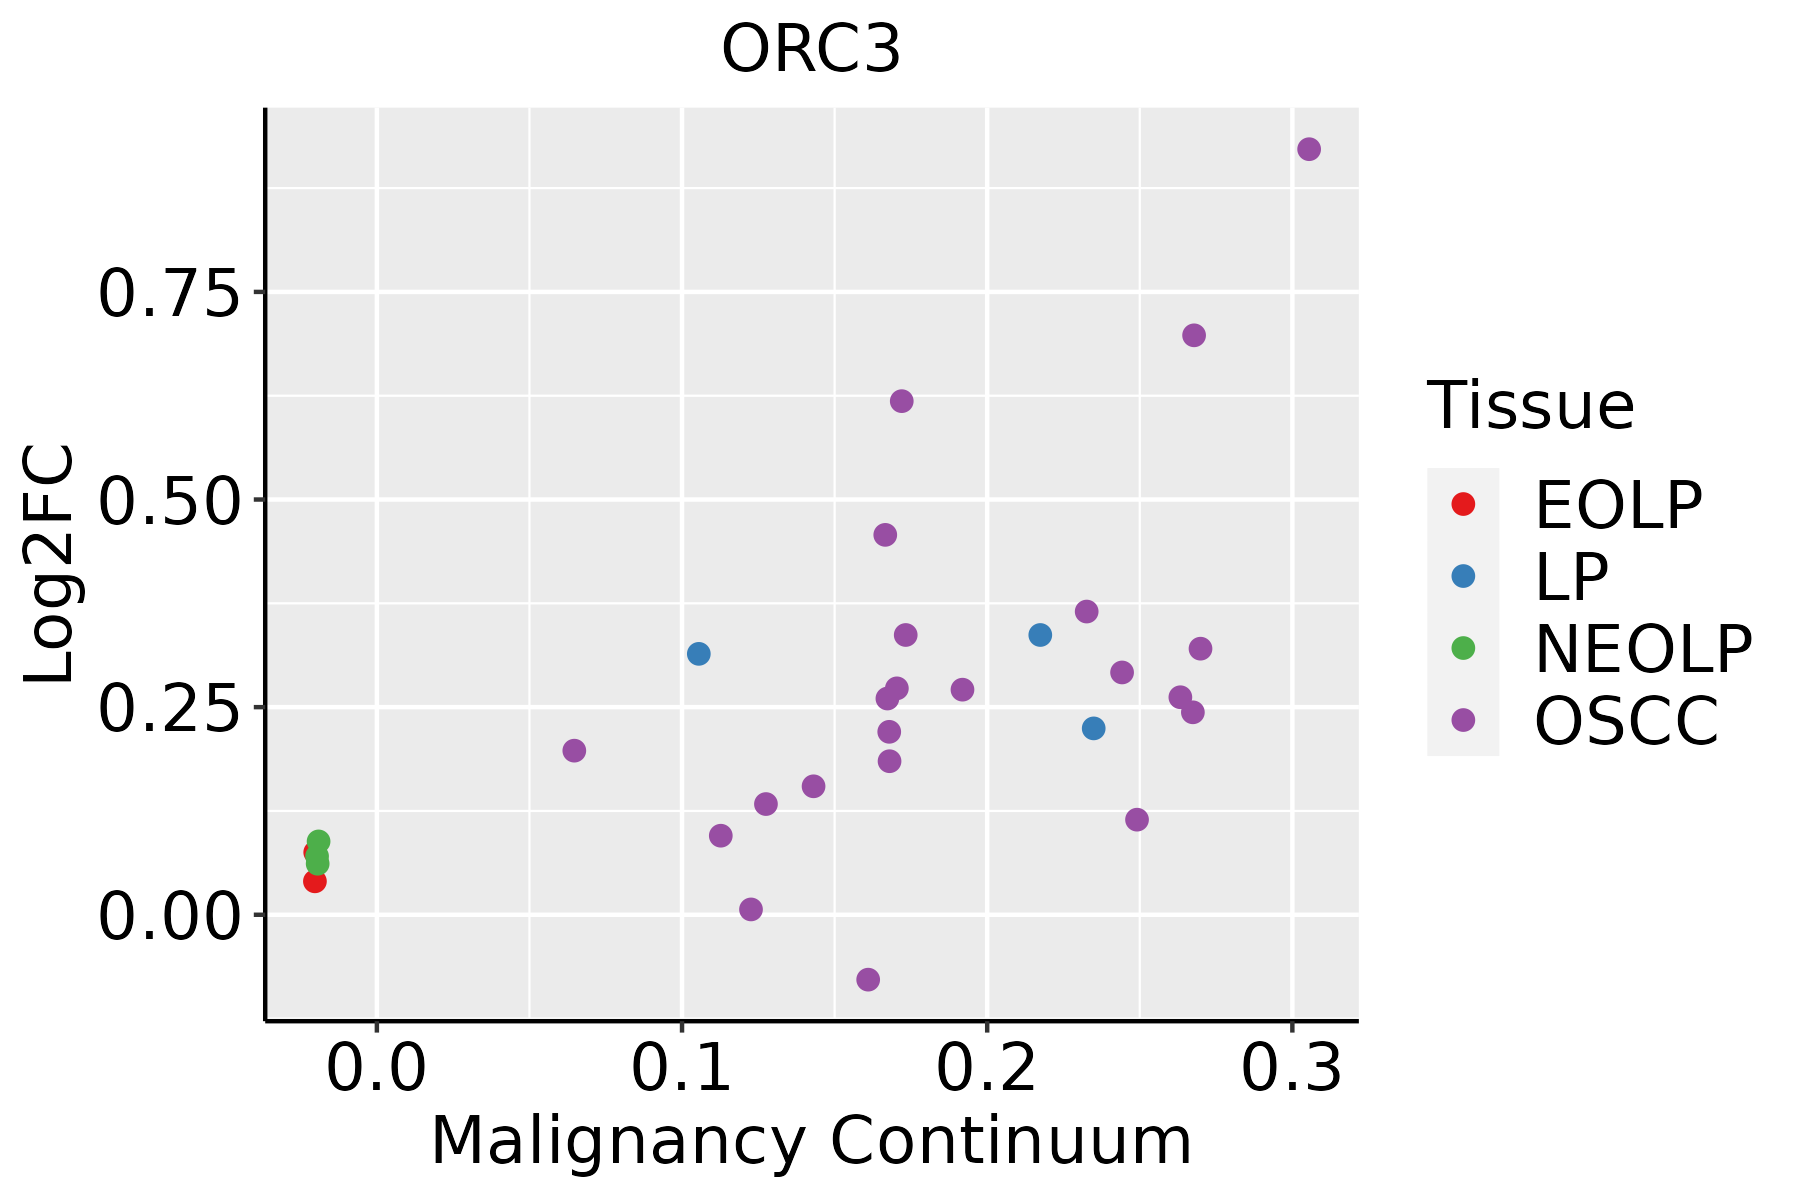 | EOLP: Erosive Oral lichen planus |
| LP: leukoplakia | ||
| NEOLP: Non-erosive oral lichen planus | ||
| OSCC: Oral squamous cell carcinoma | ||
| Skin | 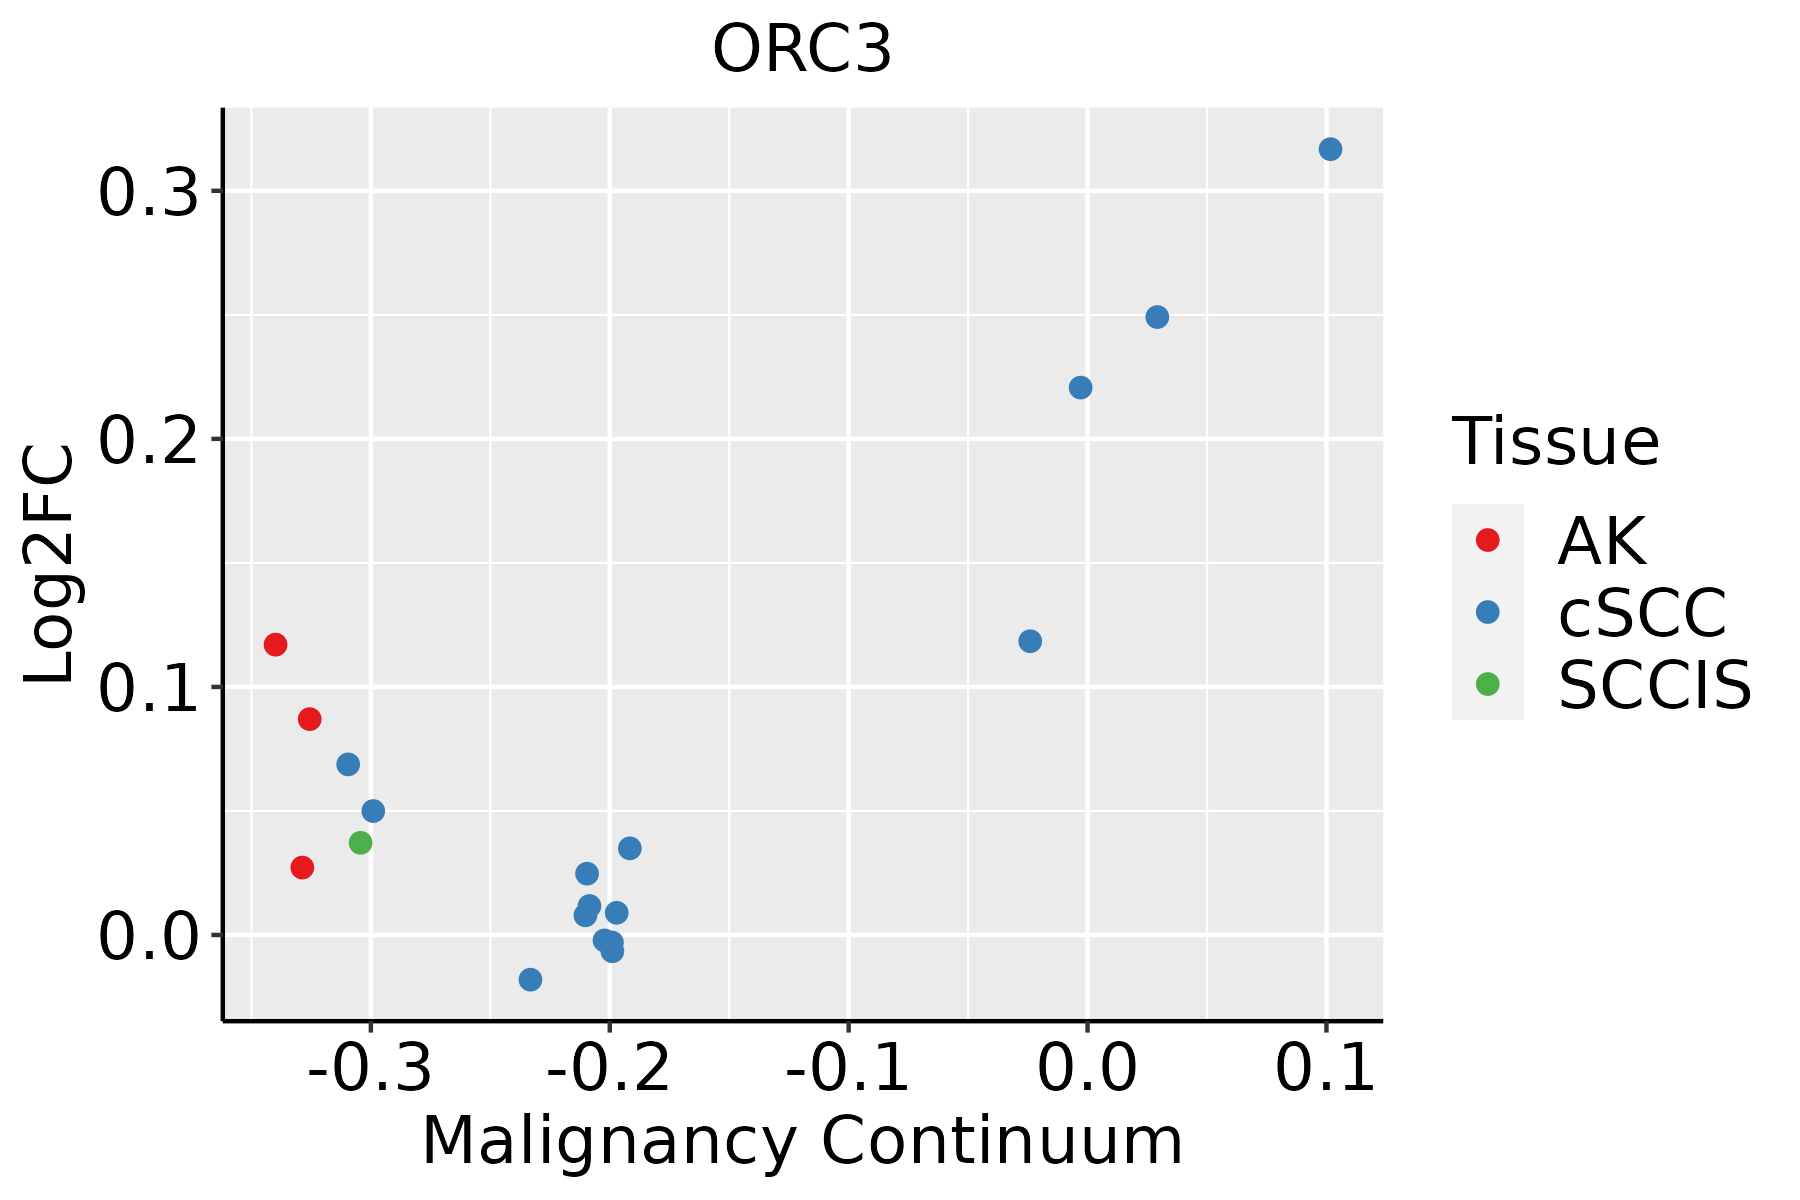 | AK: Actinic keratosis |
| cSCC: Cutaneous squamous cell carcinoma | ||
| SCCIS:squamous cell carcinoma in situ |
| ∗log2FC in expression of this searched gene in stem-like cells from each diseased tissue sample relative to stem-like cells in normal samples in each tissue plotted against the malignancy continuum. Samples are colored based on if they are from different disease stage. |
Top |
Malignant transformation related pathway analysis |
| Find out the enriched GO biological processes and KEGG pathways involved in transition from healthy to precancer to cancer |
| Tissue | Disease Stage | Enriched GO biological Processes |
| Colorectum | AD |  |
| Colorectum | SER |  |
| Colorectum | MSS |  |
| Colorectum | MSI-H |  |
| Colorectum | FAP |  |
| ∗Top 15 enriched GO BP terms are showed in the bar plot of each disease state in each tissue. Each row represents a significant GO biological process which is colored according to the -log10(p.adjust). |
| Page: 1 2 3 4 5 6 7 8 9 |
| GO ID | Tissue | Disease Stage | Description | Gene Ratio | Bg Ratio | pvalue | p.adjust | Count |
| GO:00512359 | Cervix | CC | maintenance of location | 78/2311 | 327/18723 | 5.18e-09 | 4.92e-07 | 78 |
| GO:005165110 | Cervix | CC | maintenance of location in cell | 55/2311 | 214/18723 | 6.63e-08 | 3.85e-06 | 55 |
| GO:00345048 | Cervix | CC | protein localization to nucleus | 68/2311 | 290/18723 | 9.91e-08 | 5.25e-06 | 68 |
| GO:00075689 | Cervix | CC | aging | 75/2311 | 339/18723 | 2.75e-07 | 1.13e-05 | 75 |
| GO:003164710 | Cervix | CC | regulation of protein stability | 63/2311 | 298/18723 | 1.14e-05 | 2.45e-04 | 63 |
| GO:00075695 | Cervix | CC | cell aging | 34/2311 | 132/18723 | 1.92e-05 | 3.53e-04 | 34 |
| GO:00325077 | Cervix | CC | maintenance of protein location in cell | 21/2311 | 65/18723 | 2.03e-05 | 3.71e-04 | 21 |
| GO:004518510 | Cervix | CC | maintenance of protein location | 26/2311 | 94/18723 | 4.85e-05 | 7.34e-04 | 26 |
| GO:005082110 | Cervix | CC | protein stabilization | 43/2311 | 191/18723 | 5.90e-05 | 8.54e-04 | 43 |
| GO:00181057 | Cervix | CC | peptidyl-serine phosphorylation | 63/2311 | 315/18723 | 6.65e-05 | 9.47e-04 | 63 |
| GO:00182096 | Cervix | CC | peptidyl-serine modification | 66/2311 | 338/18723 | 9.58e-05 | 1.25e-03 | 66 |
| GO:00725955 | Cervix | CC | maintenance of protein localization in organelle | 14/2311 | 42/18723 | 3.32e-04 | 3.49e-03 | 14 |
| GO:00097915 | Cervix | CC | post-embryonic development | 20/2311 | 80/18723 | 1.40e-03 | 1.10e-02 | 20 |
| GO:00514571 | Cervix | CC | maintenance of protein location in nucleus | 8/2311 | 23/18723 | 4.70e-03 | 2.82e-02 | 8 |
| GO:0031647111 | Esophagus | ESCC | regulation of protein stability | 223/8552 | 298/18723 | 5.76e-25 | 1.52e-22 | 223 |
| GO:003450418 | Esophagus | ESCC | protein localization to nucleus | 211/8552 | 290/18723 | 4.06e-21 | 6.60e-19 | 211 |
| GO:00062604 | Esophagus | ESCC | DNA replication | 181/8552 | 260/18723 | 3.55e-15 | 2.05e-13 | 181 |
| GO:0050821111 | Esophagus | ESCC | protein stabilization | 140/8552 | 191/18723 | 6.50e-15 | 3.61e-13 | 140 |
| GO:0045185111 | Esophagus | ESCC | maintenance of protein location | 71/8552 | 94/18723 | 3.41e-09 | 7.24e-08 | 71 |
| GO:0051235110 | Esophagus | ESCC | maintenance of location | 200/8552 | 327/18723 | 1.01e-08 | 2.02e-07 | 200 |
| Page: 1 2 3 4 5 6 7 |
| Pathway ID | Tissue | Disease Stage | Description | Gene Ratio | Bg Ratio | pvalue | p.adjust | qvalue | Count |
| hsa0411023 | Esophagus | ESCC | Cell cycle | 126/4205 | 157/8465 | 1.34e-15 | 5.60e-14 | 2.87e-14 | 126 |
| hsa0411033 | Esophagus | ESCC | Cell cycle | 126/4205 | 157/8465 | 1.34e-15 | 5.60e-14 | 2.87e-14 | 126 |
| hsa041102 | Liver | HCC | Cell cycle | 106/4020 | 157/8465 | 2.54e-07 | 3.04e-06 | 1.69e-06 | 106 |
| hsa041103 | Liver | HCC | Cell cycle | 106/4020 | 157/8465 | 2.54e-07 | 3.04e-06 | 1.69e-06 | 106 |
| hsa041108 | Oral cavity | OSCC | Cell cycle | 118/3704 | 157/8465 | 7.15e-16 | 2.66e-14 | 1.35e-14 | 118 |
| hsa0411015 | Oral cavity | OSCC | Cell cycle | 118/3704 | 157/8465 | 7.15e-16 | 2.66e-14 | 1.35e-14 | 118 |
| Page: 1 |
Top |
Cell-cell communication analysis |
| Identification of potential cell-cell interactions between two cell types and their ligand-receptor pairs for different disease states |
| Ligand | Receptor | LRpair | Pathway | Tissue | Disease Stage |
| Page: 1 |
Top |
Single-cell gene regulatory network inference analysis |
| Find out the significant the regulons (TFs) and the target genes of each regulon across cell types for different disease states |
| TF | Cell Type | Tissue | Disease Stage | Target Gene | RSS | Regulon Activity |
| ∗The dot plots of a searched regulon are shown for all cell subpopulations in each disease state of each tissue based on the regulon specific score inferred using pySCENIC and by calculating the average expression. |
| Page: 1 |
Top |
Somatic mutation of malignant transformation related genes |
| Annotation of somatic variants for genes involved in malignant transformation |
| Hugo Symbol | Variant Class | Variant Classification | dbSNP RS | HGVSc | HGVSp | HGVSp Short | SWISSPROT | BIOTYPE | SIFT | PolyPhen | Tumor Sample Barcode | Tissue | Histology | Sex | Age | Stage | Therapy Types | Drugs | Outcome |
| ORC3 | SNV | Missense_Mutation | novel | c.951N>G | p.His317Gln | p.H317Q | Q9UBD5 | protein_coding | deleterious(0) | probably_damaging(0.917) | TCGA-A8-A07G-01 | Breast | breast invasive carcinoma | Female | >=65 | I/II | Chemotherapy | 5-fluorouracil | CR |
| ORC3 | SNV | Missense_Mutation | c.992N>T | p.Ser331Phe | p.S331F | Q9UBD5 | protein_coding | deleterious(0.01) | possibly_damaging(0.898) | TCGA-BH-A0HF-01 | Breast | breast invasive carcinoma | Female | >=65 | I/II | Hormone Therapy | arimidex | SD | |
| ORC3 | SNV | Missense_Mutation | c.223G>A | p.Glu75Lys | p.E75K | Q9UBD5 | protein_coding | tolerated(0.52) | benign(0.003) | TCGA-BH-A0HK-01 | Breast | breast invasive carcinoma | Female | >=65 | I/II | Hormone Therapy | arimidex | SD | |
| ORC3 | SNV | Missense_Mutation | c.2011N>A | p.Glu671Lys | p.E671K | Q9UBD5 | protein_coding | tolerated(0.83) | benign(0.007) | TCGA-GM-A2DA-01 | Breast | breast invasive carcinoma | Female | <65 | I/II | Chemotherapy | fluorouracil | PD | |
| ORC3 | insertion | Frame_Shift_Ins | novel | c.949_950insCGCTTTTGCCTCCT | p.His317ProfsTer14 | p.H317Pfs*14 | Q9UBD5 | protein_coding | TCGA-A8-A07G-01 | Breast | breast invasive carcinoma | Female | >=65 | I/II | Chemotherapy | 5-fluorouracil | CR | ||
| ORC3 | SNV | Missense_Mutation | novel | c.167N>A | p.Ser56Tyr | p.S56Y | Q9UBD5 | protein_coding | tolerated(0.06) | benign(0.22) | TCGA-AA-A01I-01 | Colorectum | colon adenocarcinoma | Male | >=65 | I/II | Unknown | Unknown | SD |
| ORC3 | SNV | Missense_Mutation | novel | c.1796N>T | p.Ala599Val | p.A599V | Q9UBD5 | protein_coding | deleterious(0.04) | possibly_damaging(0.701) | TCGA-AZ-4315-01 | Colorectum | colon adenocarcinoma | Male | <65 | I/II | Unknown | Unknown | SD |
| ORC3 | SNV | Missense_Mutation | rs146416983 | c.1157C>T | p.Ala386Val | p.A386V | Q9UBD5 | protein_coding | tolerated(0.15) | benign(0.11) | TCGA-AZ-6601-01 | Colorectum | colon adenocarcinoma | Male | >=65 | I/II | Unknown | Unknown | PD |
| ORC3 | SNV | Missense_Mutation | rs753224272 | c.1316N>G | p.Tyr439Cys | p.Y439C | Q9UBD5 | protein_coding | deleterious(0) | probably_damaging(0.946) | TCGA-F4-6570-01 | Colorectum | colon adenocarcinoma | Female | >=65 | I/II | Unknown | Unknown | SD |
| ORC3 | SNV | Missense_Mutation | c.1760N>T | p.Ala587Val | p.A587V | Q9UBD5 | protein_coding | tolerated(0.45) | benign(0.001) | TCGA-G4-6588-01 | Colorectum | colon adenocarcinoma | Female | <65 | I/II | Unknown | Unknown | SD |
| Page: 1 2 3 4 5 6 |
Top |
Related drugs of malignant transformation related genes |
| Identification of chemicals and drugs interact with genes involved in malignant transfromation |
| (DGIdb 4.0) |
| Entrez ID | Symbol | Category | Interaction Types | Drug Claim Name | Drug Name | PMIDs |
| Page: 1 |

Copyright 2023-Present -The University of Texas Health Science Center at Houston |