
|
|||||
|
 | |
| |
| |
| |
| |
| |
|
Gene: ORC2 |
Gene summary for ORC2 |
| Gene information | Species | Human | Gene symbol | ORC2 | Gene ID | 4999 |
| Gene name | origin recognition complex subunit 2 | |
| Gene Alias | ORC2L | |
| Cytomap | 2q33.1 | |
| Gene Type | protein-coding | GO ID | GO:0000122 | UniProtAcc | A0A024R411 |
Top |
Malignant transformation analysis |
| Identification of the aberrant gene expression in precancerous and cancerous lesions by comparing the gene expression of stem-like cells in diseased tissues with normal stem cells |
| Entrez ID | Symbol | Replicates | Species | Organ | Tissue | Adj P-value | Log2FC | Malignancy |
| 4999 | ORC2 | CCI_2 | Human | Cervix | CC | 1.78e-09 | 9.08e-01 | 0.5249 |
| 4999 | ORC2 | CCI_3 | Human | Cervix | CC | 7.35e-06 | 5.09e-01 | 0.516 |
| 4999 | ORC2 | HTA11_3410_2000001011 | Human | Colorectum | AD | 5.34e-04 | -3.33e-01 | 0.0155 |
| 4999 | ORC2 | HTA11_347_2000001011 | Human | Colorectum | AD | 3.26e-03 | 3.85e-01 | -0.1954 |
| 4999 | ORC2 | HTA11_866_3004761011 | Human | Colorectum | AD | 3.47e-07 | -4.41e-01 | 0.096 |
| 4999 | ORC2 | HTA11_99999974143_84620 | Human | Colorectum | MSS | 6.38e-04 | -2.42e-01 | 0.3005 |
| 4999 | ORC2 | A001-C-207 | Human | Colorectum | FAP | 1.36e-05 | -4.61e-01 | 0.1278 |
| 4999 | ORC2 | A015-C-203 | Human | Colorectum | FAP | 3.56e-27 | -4.46e-01 | -0.1294 |
| 4999 | ORC2 | A015-C-204 | Human | Colorectum | FAP | 2.36e-07 | -4.76e-01 | -0.0228 |
| 4999 | ORC2 | A014-C-040 | Human | Colorectum | FAP | 2.36e-02 | -4.87e-01 | -0.1184 |
| 4999 | ORC2 | A002-C-201 | Human | Colorectum | FAP | 5.48e-11 | -4.12e-01 | 0.0324 |
| 4999 | ORC2 | A002-C-203 | Human | Colorectum | FAP | 1.02e-03 | -2.48e-01 | 0.2786 |
| 4999 | ORC2 | A001-C-119 | Human | Colorectum | FAP | 2.25e-07 | -5.29e-01 | -0.1557 |
| 4999 | ORC2 | A001-C-108 | Human | Colorectum | FAP | 7.16e-19 | -4.32e-01 | -0.0272 |
| 4999 | ORC2 | A002-C-205 | Human | Colorectum | FAP | 1.43e-16 | -5.20e-01 | -0.1236 |
| 4999 | ORC2 | A001-C-104 | Human | Colorectum | FAP | 1.19e-09 | -3.91e-01 | 0.0184 |
| 4999 | ORC2 | A015-C-005 | Human | Colorectum | FAP | 3.94e-02 | -3.25e-01 | -0.0336 |
| 4999 | ORC2 | A015-C-006 | Human | Colorectum | FAP | 3.19e-15 | -6.18e-01 | -0.0994 |
| 4999 | ORC2 | A015-C-106 | Human | Colorectum | FAP | 3.22e-12 | -3.32e-01 | -0.0511 |
| 4999 | ORC2 | A002-C-114 | Human | Colorectum | FAP | 2.12e-15 | -5.05e-01 | -0.1561 |
| Page: 1 2 3 4 5 6 |
| Tissue | Expression Dynamics | Abbreviation |
| Cervix | 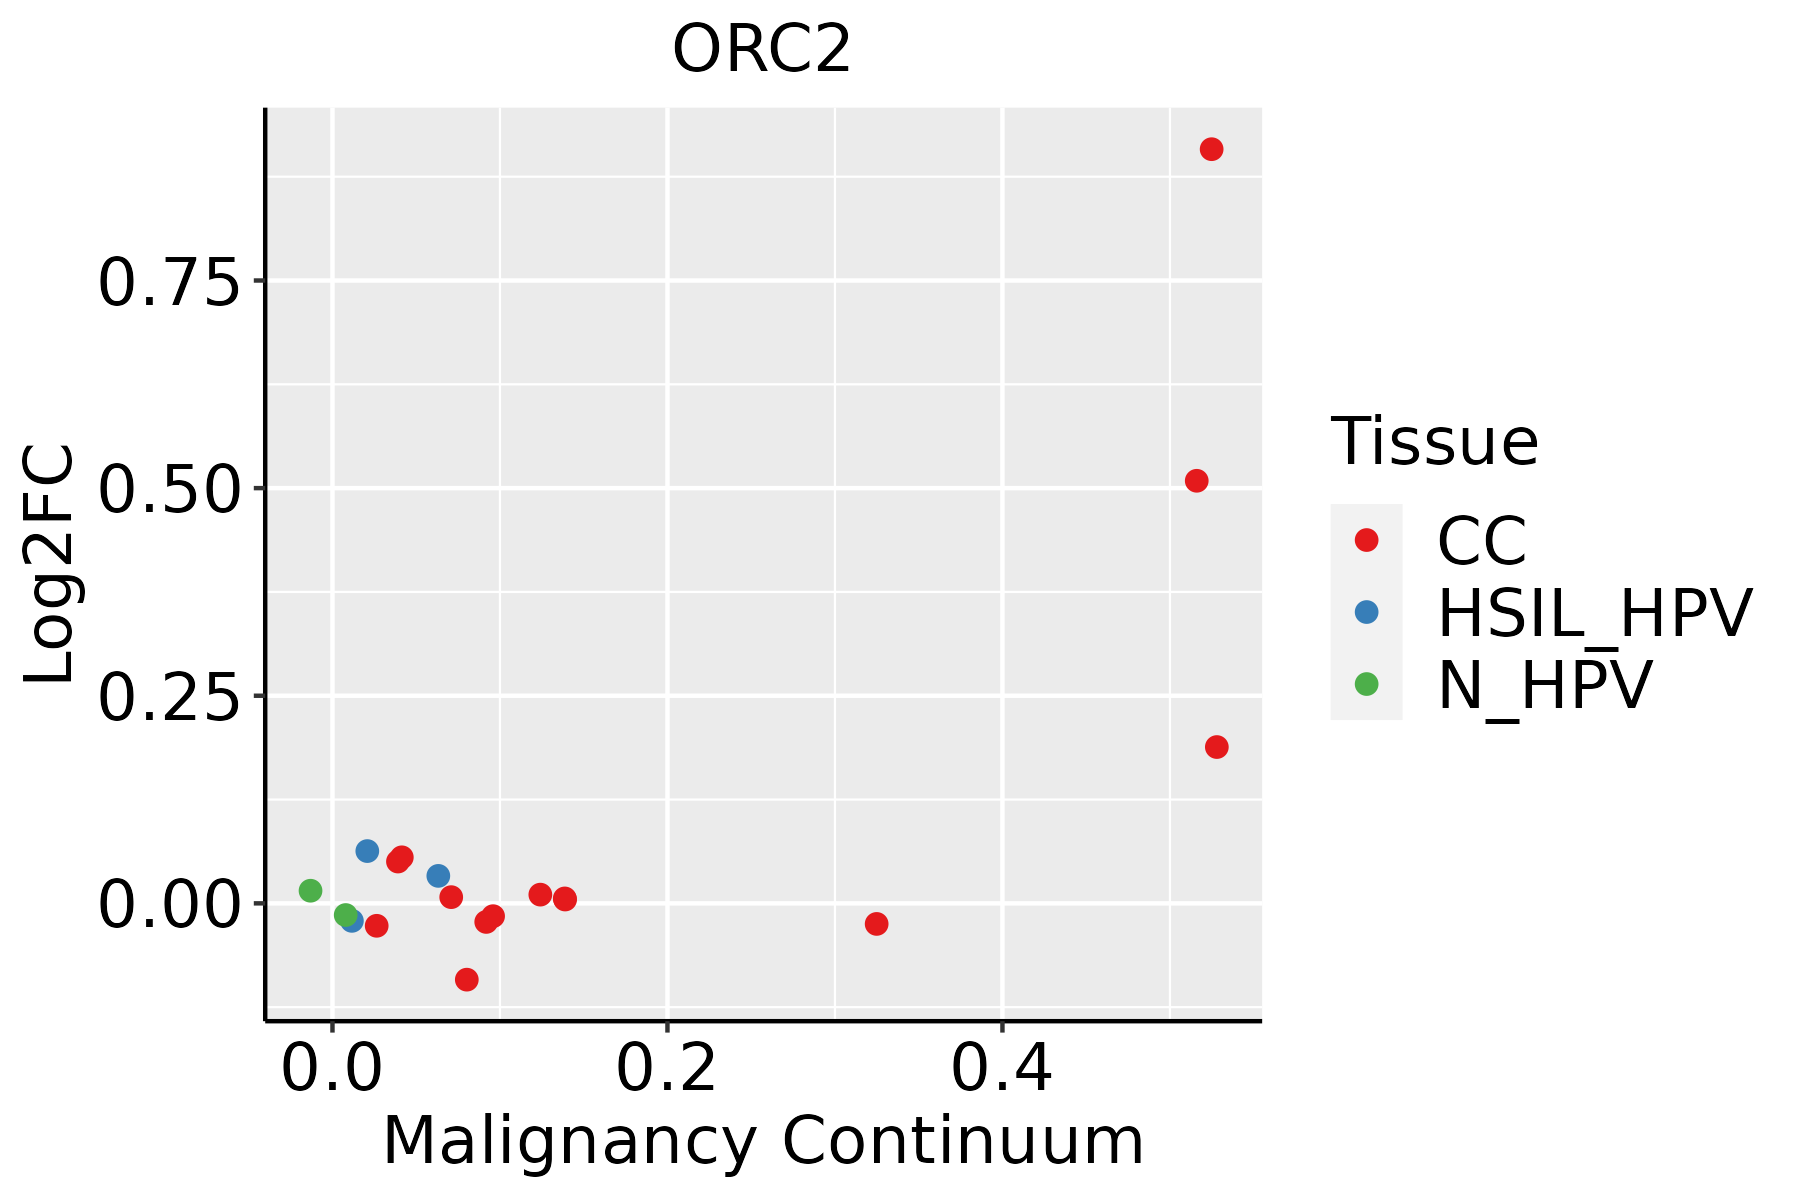 | CC: Cervix cancer |
| HSIL_HPV: HPV-infected high-grade squamous intraepithelial lesions | ||
| N_HPV: HPV-infected normal cervix | ||
| Colorectum (GSE201348) |  | FAP: Familial adenomatous polyposis |
| CRC: Colorectal cancer | ||
| Colorectum (HTA11) |  | AD: Adenomas |
| SER: Sessile serrated lesions | ||
| MSI-H: Microsatellite-high colorectal cancer | ||
| MSS: Microsatellite stable colorectal cancer | ||
| Esophagus | 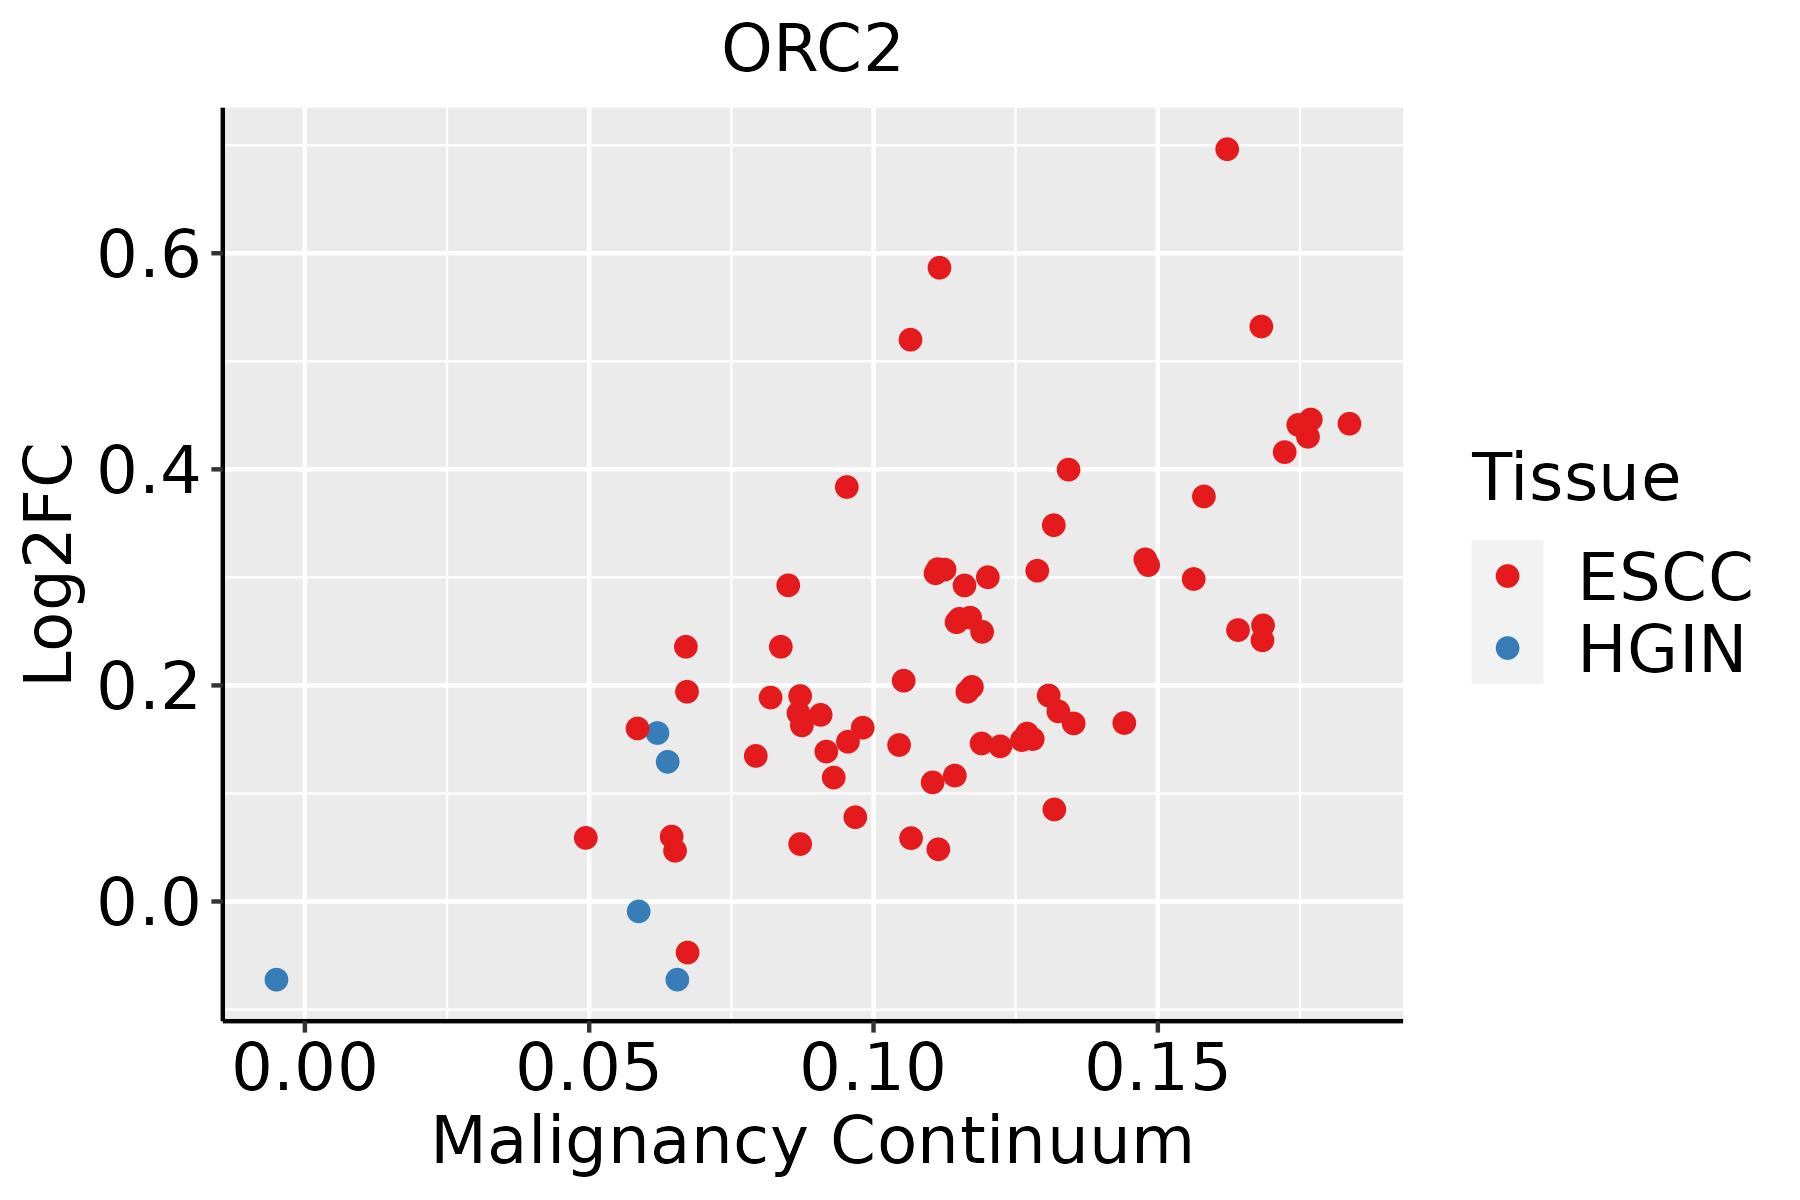 | ESCC: Esophageal squamous cell carcinoma |
| HGIN: High-grade intraepithelial neoplasias | ||
| LGIN: Low-grade intraepithelial neoplasias | ||
| Skin | 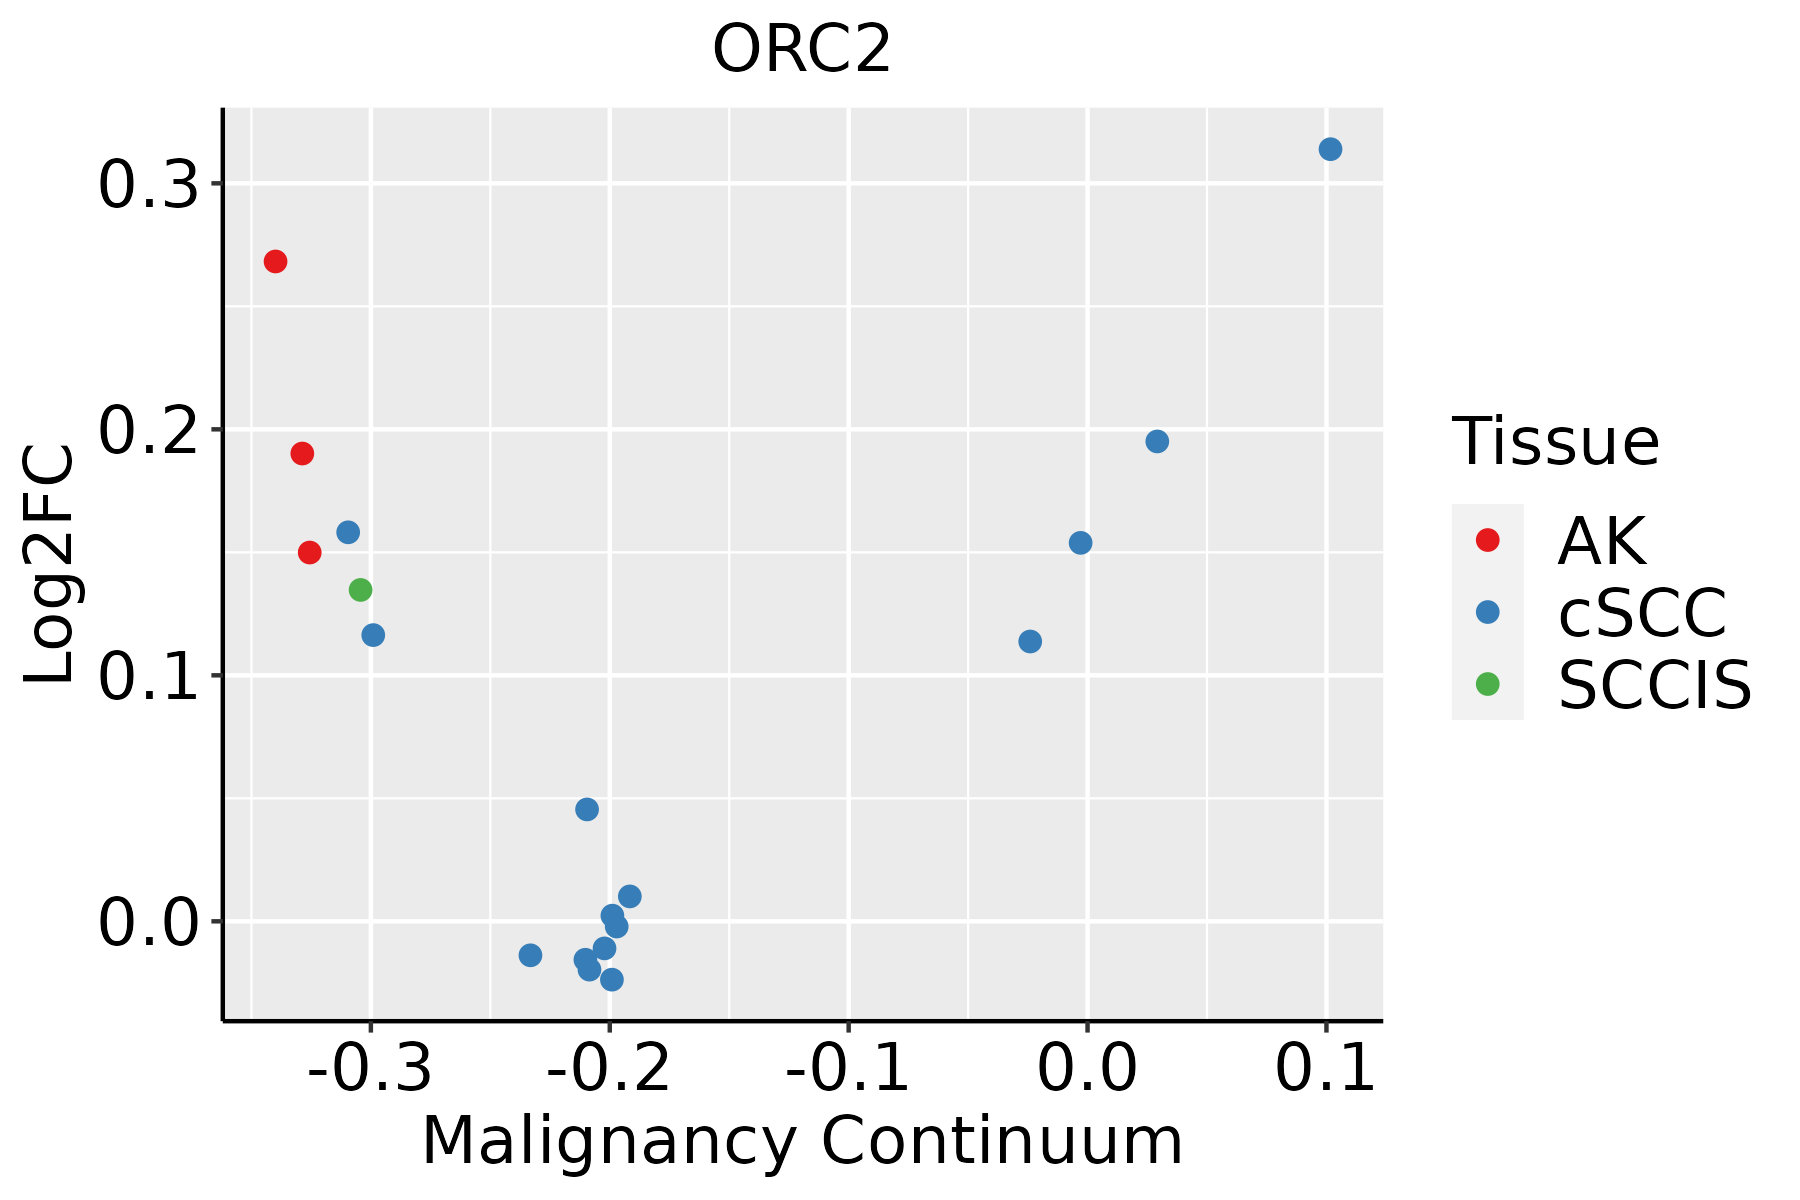 | AK: Actinic keratosis |
| cSCC: Cutaneous squamous cell carcinoma | ||
| SCCIS:squamous cell carcinoma in situ |
| ∗log2FC in expression of this searched gene in stem-like cells from each diseased tissue sample relative to stem-like cells in normal samples in each tissue plotted against the malignancy continuum. Samples are colored based on if they are from different disease stage. |
Top |
Malignant transformation related pathway analysis |
| Find out the enriched GO biological processes and KEGG pathways involved in transition from healthy to precancer to cancer |
| Tissue | Disease Stage | Enriched GO biological Processes |
| Colorectum | AD |  |
| Colorectum | SER |  |
| Colorectum | MSS |  |
| Colorectum | MSI-H |  |
| Colorectum | FAP |  |
| ∗Top 15 enriched GO BP terms are showed in the bar plot of each disease state in each tissue. Each row represents a significant GO biological process which is colored according to the -log10(p.adjust). |
| Page: 1 2 3 4 5 6 7 8 9 |
| GO ID | Tissue | Disease Stage | Description | Gene Ratio | Bg Ratio | pvalue | p.adjust | Count |
| GO:00062602 | Cervix | CC | DNA replication | 48/2311 | 260/18723 | 2.70e-03 | 1.85e-02 | 48 |
| GO:00062604 | Esophagus | ESCC | DNA replication | 181/8552 | 260/18723 | 3.55e-15 | 2.05e-13 | 181 |
| GO:00062612 | Esophagus | ESCC | DNA-dependent DNA replication | 100/8552 | 151/18723 | 2.61e-07 | 3.94e-06 | 100 |
| GO:00062701 | Esophagus | ESCC | DNA replication initiation | 27/8552 | 34/18723 | 6.01e-05 | 4.62e-04 | 27 |
| GO:001603222 | Liver | HCC | viral process | 286/7958 | 415/18723 | 4.41e-28 | 1.86e-25 | 286 |
| GO:001905822 | Liver | HCC | viral life cycle | 209/7958 | 317/18723 | 2.05e-17 | 2.09e-15 | 209 |
| GO:000663122 | Liver | HCC | fatty acid metabolic process | 238/7958 | 390/18723 | 8.24e-14 | 4.84e-12 | 238 |
| GO:001907922 | Liver | HCC | viral genome replication | 94/7958 | 131/18723 | 1.02e-11 | 4.18e-10 | 94 |
| GO:003304421 | Liver | HCC | regulation of chromosome organization | 125/7958 | 187/18723 | 1.35e-11 | 5.40e-10 | 125 |
| GO:005079212 | Liver | HCC | regulation of viral process | 109/7958 | 164/18723 | 4.52e-10 | 1.45e-08 | 109 |
| GO:190390012 | Liver | HCC | regulation of viral life cycle | 94/7958 | 148/18723 | 1.93e-07 | 3.49e-06 | 94 |
| GO:004506922 | Liver | HCC | regulation of viral genome replication | 59/7958 | 85/18723 | 4.66e-07 | 7.61e-06 | 59 |
| GO:200125211 | Liver | HCC | positive regulation of chromosome organization | 55/7958 | 82/18723 | 5.97e-06 | 7.35e-05 | 55 |
| GO:004852511 | Liver | HCC | negative regulation of viral process | 59/7958 | 92/18723 | 2.28e-05 | 2.41e-04 | 59 |
| GO:000632511 | Liver | HCC | chromatin organization | 206/7958 | 409/18723 | 7.23e-04 | 4.41e-03 | 206 |
| GO:0040029 | Liver | HCC | regulation of gene expression, epigenetic | 61/7958 | 105/18723 | 9.02e-04 | 5.31e-03 | 61 |
| GO:00450711 | Liver | HCC | negative regulation of viral genome replication | 35/7958 | 56/18723 | 2.00e-03 | 1.01e-02 | 35 |
| GO:0039694 | Liver | HCC | viral RNA genome replication | 22/7958 | 35/18723 | 1.21e-02 | 4.41e-02 | 22 |
| GO:00062605 | Skin | AK | DNA replication | 40/1910 | 260/18723 | 5.49e-03 | 3.03e-02 | 40 |
| GO:000626012 | Skin | cSCC | DNA replication | 106/4864 | 260/18723 | 1.18e-07 | 2.77e-06 | 106 |
| Page: 1 |
| Pathway ID | Tissue | Disease Stage | Description | Gene Ratio | Bg Ratio | pvalue | p.adjust | qvalue | Count |
| hsa041106 | Cervix | CC | Cell cycle | 36/1267 | 157/8465 | 4.94e-03 | 1.67e-02 | 9.86e-03 | 36 |
| hsa0411013 | Cervix | CC | Cell cycle | 36/1267 | 157/8465 | 4.94e-03 | 1.67e-02 | 9.86e-03 | 36 |
| hsa04110 | Colorectum | FAP | Cell cycle | 37/1404 | 157/8465 | 1.44e-02 | 4.77e-02 | 2.90e-02 | 37 |
| hsa041101 | Colorectum | FAP | Cell cycle | 37/1404 | 157/8465 | 1.44e-02 | 4.77e-02 | 2.90e-02 | 37 |
| hsa0411023 | Esophagus | ESCC | Cell cycle | 126/4205 | 157/8465 | 1.34e-15 | 5.60e-14 | 2.87e-14 | 126 |
| hsa0411033 | Esophagus | ESCC | Cell cycle | 126/4205 | 157/8465 | 1.34e-15 | 5.60e-14 | 2.87e-14 | 126 |
| Page: 1 |
Top |
Cell-cell communication analysis |
| Identification of potential cell-cell interactions between two cell types and their ligand-receptor pairs for different disease states |
| Ligand | Receptor | LRpair | Pathway | Tissue | Disease Stage |
| Page: 1 |
Top |
Single-cell gene regulatory network inference analysis |
| Find out the significant the regulons (TFs) and the target genes of each regulon across cell types for different disease states |
| TF | Cell Type | Tissue | Disease Stage | Target Gene | RSS | Regulon Activity |
| ∗The dot plots of a searched regulon are shown for all cell subpopulations in each disease state of each tissue based on the regulon specific score inferred using pySCENIC and by calculating the average expression. |
| Page: 1 |
Top |
Somatic mutation of malignant transformation related genes |
| Annotation of somatic variants for genes involved in malignant transformation |
| Hugo Symbol | Variant Class | Variant Classification | dbSNP RS | HGVSc | HGVSp | HGVSp Short | SWISSPROT | BIOTYPE | SIFT | PolyPhen | Tumor Sample Barcode | Tissue | Histology | Sex | Age | Stage | Therapy Types | Drugs | Outcome |
| ORC2 | SNV | Missense_Mutation | novel | c.1435C>T | p.His479Tyr | p.H479Y | Q13416 | protein_coding | deleterious(0) | probably_damaging(1) | TCGA-3C-AALI-01 | Breast | breast invasive carcinoma | Female | <65 | I/II | Unspecific | Poly E | Complete Response |
| ORC2 | SNV | Missense_Mutation | c.299N>C | p.Arg100Thr | p.R100T | Q13416 | protein_coding | tolerated(0.68) | benign(0.071) | TCGA-AC-A23H-01 | Breast | breast invasive carcinoma | Female | >=65 | I/II | Unknown | Unknown | PD | |
| ORC2 | SNV | Missense_Mutation | novel | c.791N>A | p.Arg264Lys | p.R264K | Q13416 | protein_coding | tolerated(1) | benign(0.001) | TCGA-AO-A0JC-01 | Breast | breast invasive carcinoma | Female | <65 | I/II | Chemotherapy | fluorouracil | SD |
| ORC2 | SNV | Missense_Mutation | c.1648N>C | p.Gly550Arg | p.G550R | Q13416 | protein_coding | deleterious(0) | probably_damaging(0.995) | TCGA-AR-A256-01 | Breast | breast invasive carcinoma | Female | <65 | I/II | Chemotherapy | doxorubicin | PD | |
| ORC2 | SNV | Missense_Mutation | novel | c.574G>A | p.Glu192Lys | p.E192K | Q13416 | protein_coding | tolerated(0.25) | benign(0) | TCGA-BH-A0H5-01 | Breast | breast invasive carcinoma | Female | <65 | I/II | Chemotherapy | cytoxan | CR |
| ORC2 | SNV | Missense_Mutation | c.1612N>A | p.Glu538Lys | p.E538K | Q13416 | protein_coding | deleterious(0) | probably_damaging(0.997) | TCGA-C8-A12P-01 | Breast | breast invasive carcinoma | Female | <65 | I/II | Unknown | Unknown | SD | |
| ORC2 | SNV | Missense_Mutation | novel | c.1408G>A | p.Gly470Arg | p.G470R | Q13416 | protein_coding | deleterious(0) | probably_damaging(1) | TCGA-LL-A73Y-01 | Breast | breast invasive carcinoma | Female | >=65 | I/II | Chemotherapy | taxotere | SD |
| ORC2 | SNV | Missense_Mutation | novel | c.1006N>A | p.His336Asn | p.H336N | Q13416 | protein_coding | deleterious(0.01) | benign(0.15) | TCGA-C5-A8XJ-01 | Cervix | cervical & endocervical cancer | Female | >=65 | I/II | Chemotherapy | cisplatin | SD |
| ORC2 | SNV | Missense_Mutation | novel | c.647N>C | p.Arg216Thr | p.R216T | Q13416 | protein_coding | tolerated(0.23) | benign(0.012) | TCGA-JW-A5VL-01 | Cervix | cervical & endocervical cancer | Female | <65 | I/II | Unknown | Unknown | SD |
| ORC2 | SNV | Missense_Mutation | novel | c.551N>G | p.Ser184Cys | p.S184C | Q13416 | protein_coding | deleterious(0) | probably_damaging(0.998) | TCGA-JW-A5VL-01 | Cervix | cervical & endocervical cancer | Female | <65 | I/II | Unknown | Unknown | SD |
| Page: 1 2 3 4 5 6 7 |
Top |
Related drugs of malignant transformation related genes |
| Identification of chemicals and drugs interact with genes involved in malignant transfromation |
| (DGIdb 4.0) |
| Entrez ID | Symbol | Category | Interaction Types | Drug Claim Name | Drug Name | PMIDs |
| Page: 1 |

Copyright 2023-Present -The University of Texas Health Science Center at Houston |