
|
|||||
|
 | |
| |
| |
| |
| |
| |
|
Gene: ORAI2 |
Gene summary for ORAI2 |
| Gene information | Species | Human | Gene symbol | ORAI2 | Gene ID | 80228 |
| Gene name | ORAI calcium release-activated calcium modulator 2 | |
| Gene Alias | C7orf19 | |
| Cytomap | 7q22.1 | |
| Gene Type | protein-coding | GO ID | GO:0002115 | UniProtAcc | Q96SN7 |
Top |
Malignant transformation analysis |
| Identification of the aberrant gene expression in precancerous and cancerous lesions by comparing the gene expression of stem-like cells in diseased tissues with normal stem cells |
| Entrez ID | Symbol | Replicates | Species | Organ | Tissue | Adj P-value | Log2FC | Malignancy |
| 80228 | ORAI2 | P1T-E | Human | Esophagus | ESCC | 4.26e-02 | 2.27e-01 | 0.0875 |
| 80228 | ORAI2 | P2T-E | Human | Esophagus | ESCC | 3.39e-60 | 1.10e+00 | 0.1177 |
| 80228 | ORAI2 | P4T-E | Human | Esophagus | ESCC | 7.65e-07 | 1.58e-01 | 0.1323 |
| 80228 | ORAI2 | P5T-E | Human | Esophagus | ESCC | 1.80e-04 | 3.77e-02 | 0.1327 |
| 80228 | ORAI2 | P8T-E | Human | Esophagus | ESCC | 2.35e-13 | 1.51e-01 | 0.0889 |
| 80228 | ORAI2 | P10T-E | Human | Esophagus | ESCC | 3.35e-20 | 3.24e-01 | 0.116 |
| 80228 | ORAI2 | P11T-E | Human | Esophagus | ESCC | 3.90e-04 | 1.90e-01 | 0.1426 |
| 80228 | ORAI2 | P12T-E | Human | Esophagus | ESCC | 4.08e-04 | 9.13e-02 | 0.1122 |
| 80228 | ORAI2 | P15T-E | Human | Esophagus | ESCC | 2.04e-05 | 1.43e-01 | 0.1149 |
| 80228 | ORAI2 | P16T-E | Human | Esophagus | ESCC | 1.74e-21 | 3.25e-01 | 0.1153 |
| 80228 | ORAI2 | P17T-E | Human | Esophagus | ESCC | 3.57e-02 | 2.37e-01 | 0.1278 |
| 80228 | ORAI2 | P21T-E | Human | Esophagus | ESCC | 2.08e-09 | 1.65e-01 | 0.1617 |
| 80228 | ORAI2 | P23T-E | Human | Esophagus | ESCC | 1.64e-04 | 1.46e-01 | 0.108 |
| 80228 | ORAI2 | P24T-E | Human | Esophagus | ESCC | 1.16e-03 | 1.47e-01 | 0.1287 |
| 80228 | ORAI2 | P26T-E | Human | Esophagus | ESCC | 1.97e-04 | 1.56e-01 | 0.1276 |
| 80228 | ORAI2 | P27T-E | Human | Esophagus | ESCC | 5.87e-07 | 9.71e-02 | 0.1055 |
| 80228 | ORAI2 | P28T-E | Human | Esophagus | ESCC | 4.40e-07 | 1.73e-01 | 0.1149 |
| 80228 | ORAI2 | P30T-E | Human | Esophagus | ESCC | 3.66e-06 | 1.57e-01 | 0.137 |
| 80228 | ORAI2 | P31T-E | Human | Esophagus | ESCC | 4.00e-10 | 1.73e-01 | 0.1251 |
| 80228 | ORAI2 | P32T-E | Human | Esophagus | ESCC | 7.84e-07 | 1.75e-01 | 0.1666 |
| Page: 1 2 3 4 |
| Tissue | Expression Dynamics | Abbreviation |
| Esophagus |  | ESCC: Esophageal squamous cell carcinoma |
| HGIN: High-grade intraepithelial neoplasias | ||
| LGIN: Low-grade intraepithelial neoplasias | ||
| Liver | 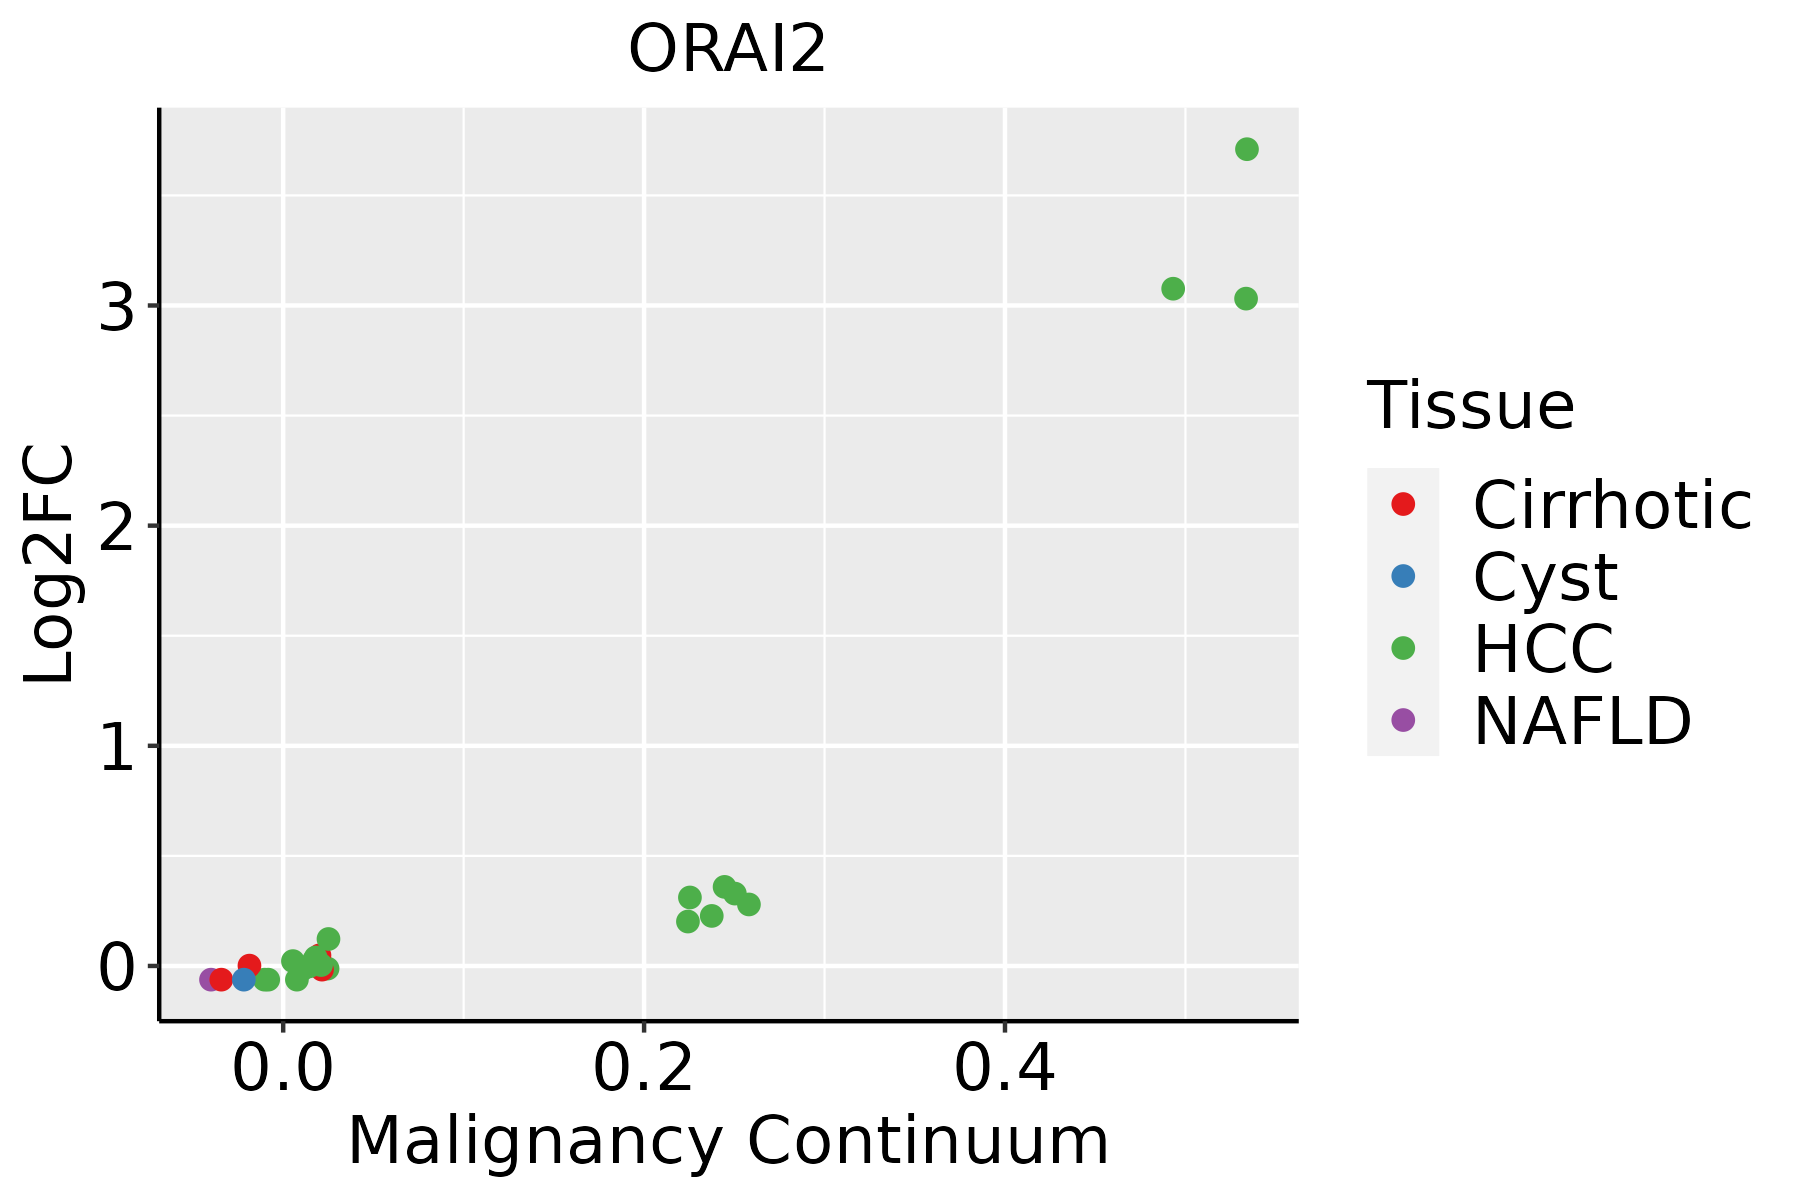 | HCC: Hepatocellular carcinoma |
| NAFLD: Non-alcoholic fatty liver disease | ||
| Thyroid | 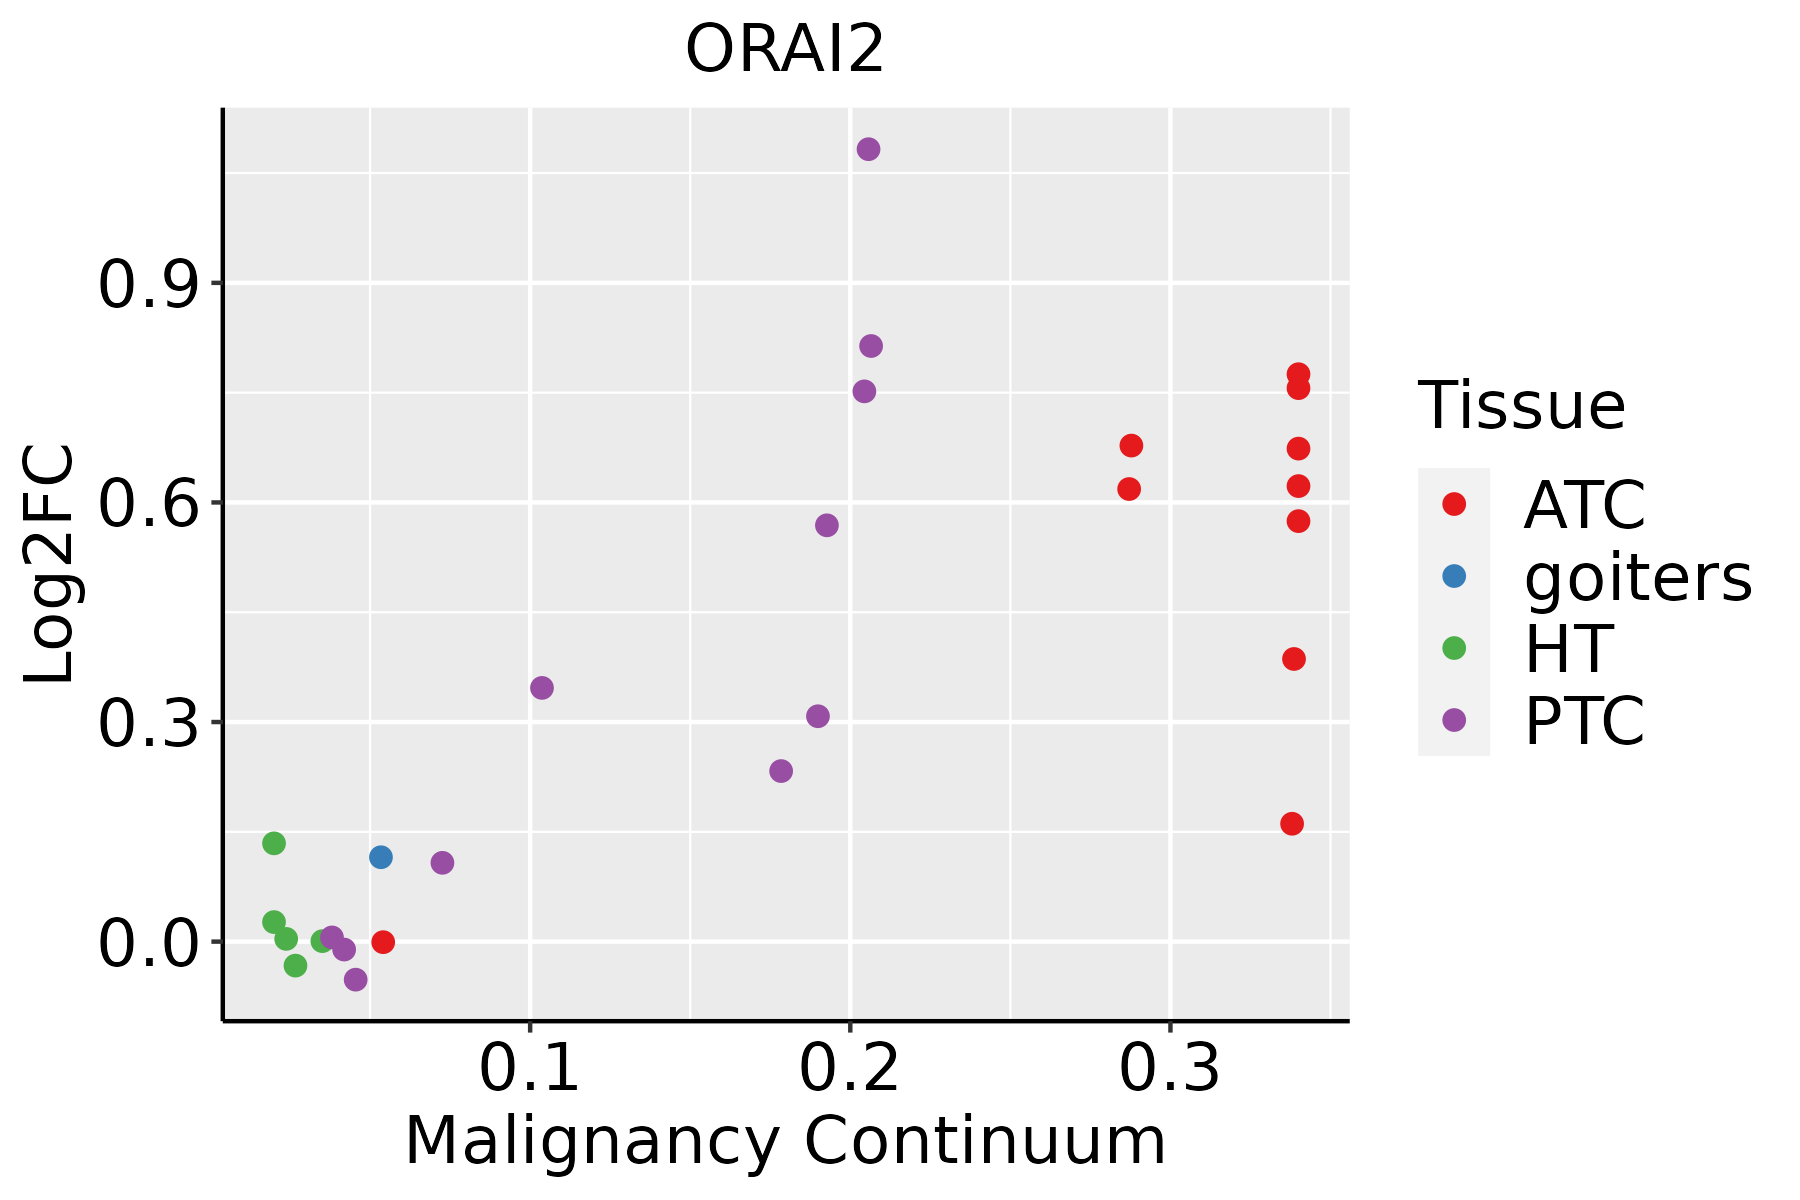 | ATC: Anaplastic thyroid cancer |
| HT: Hashimoto's thyroiditis | ||
| PTC: Papillary thyroid cancer |
| ∗log2FC in expression of this searched gene in stem-like cells from each diseased tissue sample relative to stem-like cells in normal samples in each tissue plotted against the malignancy continuum. Samples are colored based on if they are from different disease stage. |
Top |
Malignant transformation related pathway analysis |
| Find out the enriched GO biological processes and KEGG pathways involved in transition from healthy to precancer to cancer |
| Tissue | Disease Stage | Enriched GO biological Processes |
| Colorectum | AD |  |
| Colorectum | SER |  |
| Colorectum | MSS |  |
| Colorectum | MSI-H |  |
| Colorectum | FAP |  |
| ∗Top 15 enriched GO BP terms are showed in the bar plot of each disease state in each tissue. Each row represents a significant GO biological process which is colored according to the -log10(p.adjust). |
| Page: 1 2 3 4 5 6 7 8 9 |
| GO ID | Tissue | Disease Stage | Description | Gene Ratio | Bg Ratio | pvalue | p.adjust | Count |
| Page: 1 |
| Pathway ID | Tissue | Disease Stage | Description | Gene Ratio | Bg Ratio | pvalue | p.adjust | qvalue | Count |
| Page: 1 |
Top |
Cell-cell communication analysis |
| Identification of potential cell-cell interactions between two cell types and their ligand-receptor pairs for different disease states |
| Ligand | Receptor | LRpair | Pathway | Tissue | Disease Stage |
| Page: 1 |
Top |
Single-cell gene regulatory network inference analysis |
| Find out the significant the regulons (TFs) and the target genes of each regulon across cell types for different disease states |
| TF | Cell Type | Tissue | Disease Stage | Target Gene | RSS | Regulon Activity |
| ∗The dot plots of a searched regulon are shown for all cell subpopulations in each disease state of each tissue based on the regulon specific score inferred using pySCENIC and by calculating the average expression. |
| Page: 1 |
Top |
Somatic mutation of malignant transformation related genes |
| Annotation of somatic variants for genes involved in malignant transformation |
| Hugo Symbol | Variant Class | Variant Classification | dbSNP RS | HGVSc | HGVSp | HGVSp Short | SWISSPROT | BIOTYPE | SIFT | PolyPhen | Tumor Sample Barcode | Tissue | Histology | Sex | Age | Stage | Therapy Types | Drugs | Outcome |
| ORAI2 | SNV | Missense_Mutation | c.662N>G | p.Ser221Cys | p.S221C | Q96SN7 | protein_coding | deleterious(0) | possibly_damaging(0.811) | TCGA-DS-A1OC-01 | Cervix | cervical & endocervical cancer | Female | <65 | I/II | Chemotherapy | gemcitabine | SD | |
| ORAI2 | SNV | Missense_Mutation | novel | c.250G>C | p.Glu84Gln | p.E84Q | Q96SN7 | protein_coding | tolerated(0.1) | benign(0.099) | TCGA-MY-A913-01 | Cervix | cervical & endocervical cancer | Female | <65 | I/II | Chemotherapy | cisplatin | CR |
| ORAI2 | SNV | Missense_Mutation | c.655N>C | p.Tyr219His | p.Y219H | Q96SN7 | protein_coding | deleterious(0) | probably_damaging(0.997) | TCGA-AA-3510-01 | Colorectum | colon adenocarcinoma | Male | >=65 | I/II | Unknown | Unknown | SD | |
| ORAI2 | SNV | Missense_Mutation | rs771911609 | c.670N>T | p.Arg224Cys | p.R224C | Q96SN7 | protein_coding | deleterious(0.03) | possibly_damaging(0.787) | TCGA-AA-A010-01 | Colorectum | colon adenocarcinoma | Female | <65 | I/II | Chemotherapy | folinic | CR |
| ORAI2 | SNV | Missense_Mutation | c.680N>T | p.Thr227Met | p.T227M | Q96SN7 | protein_coding | tolerated(0.22) | probably_damaging(0.976) | TCGA-AD-5900-01 | Colorectum | colon adenocarcinoma | Male | >=65 | I/II | Unknown | Unknown | SD | |
| ORAI2 | SNV | Missense_Mutation | c.497T>C | p.Val166Ala | p.V166A | Q96SN7 | protein_coding | tolerated(1) | possibly_damaging(0.566) | TCGA-CM-5861-01 | Colorectum | colon adenocarcinoma | Female | <65 | I/II | Unknown | Unknown | PD | |
| ORAI2 | SNV | Missense_Mutation | rs752254400 | c.422G>A | p.Arg141His | p.R141H | Q96SN7 | protein_coding | deleterious(0.03) | probably_damaging(0.998) | TCGA-DM-A285-01 | Colorectum | colon adenocarcinoma | Female | >=65 | III/IV | Unknown | Unknown | SD |
| ORAI2 | SNV | Missense_Mutation | c.410N>T | p.Ser137Phe | p.S137F | Q96SN7 | protein_coding | deleterious(0) | probably_damaging(0.995) | TCGA-AG-A015-01 | Colorectum | rectum adenocarcinoma | Female | <65 | I/II | Unknown | Unknown | PD | |
| ORAI2 | SNV | Missense_Mutation | novel | c.5G>T | p.Ser2Ile | p.S2I | Q96SN7 | protein_coding | deleterious_low_confidence(0) | possibly_damaging(0.636) | TCGA-A5-A1OF-01 | Endometrium | uterine corpus endometrioid carcinoma | Female | <65 | I/II | Unknown | Unknown | SD |
| ORAI2 | SNV | Missense_Mutation | novel | c.427N>T | p.His143Tyr | p.H143Y | Q96SN7 | protein_coding | deleterious(0) | probably_damaging(0.982) | TCGA-AJ-A3OL-01 | Endometrium | uterine corpus endometrioid carcinoma | Female | <65 | III/IV | Chemotherapy | carboplatin | PD |
| Page: 1 2 3 |
Top |
Related drugs of malignant transformation related genes |
| Identification of chemicals and drugs interact with genes involved in malignant transfromation |
| (DGIdb 4.0) |
| Entrez ID | Symbol | Category | Interaction Types | Drug Claim Name | Drug Name | PMIDs |
| 80228 | ORAI2 | ION CHANNEL | blocker | 381118798 | ||
| 80228 | ORAI2 | ION CHANNEL | blocker | 381118797 |
| Page: 1 |

Copyright 2023-Present -The University of Texas Health Science Center at Houston |