
|
|||||
|
 | |
| |
| |
| |
| |
| |
|
Gene: ORAI1 |
Gene summary for ORAI1 |
| Gene information | Species | Human | Gene symbol | ORAI1 | Gene ID | 84876 |
| Gene name | ORAI calcium release-activated calcium modulator 1 | |
| Gene Alias | CRACM1 | |
| Cytomap | 12q24.31 | |
| Gene Type | protein-coding | GO ID | GO:0002115 | UniProtAcc | A0A024RBT3 |
Top |
Malignant transformation analysis |
| Identification of the aberrant gene expression in precancerous and cancerous lesions by comparing the gene expression of stem-like cells in diseased tissues with normal stem cells |
| Entrez ID | Symbol | Replicates | Species | Organ | Tissue | Adj P-value | Log2FC | Malignancy |
| 84876 | ORAI1 | HTA11_1938_2000001011 | Human | Colorectum | AD | 1.40e-02 | 2.04e-01 | -0.0811 |
| 84876 | ORAI1 | HTA11_347_2000001011 | Human | Colorectum | AD | 2.68e-04 | 1.46e-01 | -0.1954 |
| 84876 | ORAI1 | HTA11_83_2000001011 | Human | Colorectum | SER | 7.08e-03 | 2.04e-01 | -0.1526 |
| 84876 | ORAI1 | HTA11_1391_2000001011 | Human | Colorectum | AD | 6.04e-10 | 3.32e-01 | -0.059 |
| 84876 | ORAI1 | HTA11_546_2000001011 | Human | Colorectum | AD | 6.59e-05 | 2.62e-01 | -0.0842 |
| 84876 | ORAI1 | HTA11_866_3004761011 | Human | Colorectum | AD | 7.36e-04 | 1.61e-01 | 0.096 |
| 84876 | ORAI1 | HTA11_10711_2000001011 | Human | Colorectum | AD | 1.33e-03 | 1.55e-01 | 0.0338 |
| 84876 | ORAI1 | HTA11_7696_3000711011 | Human | Colorectum | AD | 1.96e-06 | 2.24e-01 | 0.0674 |
| 84876 | ORAI1 | HTA11_99999970781_79442 | Human | Colorectum | MSS | 9.95e-03 | 1.79e-01 | 0.294 |
| 84876 | ORAI1 | HTA11_99999965062_69753 | Human | Colorectum | MSI-H | 5.40e-03 | 5.57e-01 | 0.3487 |
| 84876 | ORAI1 | LZE24T | Human | Esophagus | ESCC | 6.95e-04 | 1.69e-01 | 0.0596 |
| 84876 | ORAI1 | P2T-E | Human | Esophagus | ESCC | 4.91e-50 | 9.04e-01 | 0.1177 |
| 84876 | ORAI1 | P4T-E | Human | Esophagus | ESCC | 8.64e-23 | 5.03e-01 | 0.1323 |
| 84876 | ORAI1 | P5T-E | Human | Esophagus | ESCC | 1.70e-08 | 1.80e-01 | 0.1327 |
| 84876 | ORAI1 | P8T-E | Human | Esophagus | ESCC | 1.42e-05 | 5.40e-02 | 0.0889 |
| 84876 | ORAI1 | P9T-E | Human | Esophagus | ESCC | 2.02e-03 | 1.46e-01 | 0.1131 |
| 84876 | ORAI1 | P10T-E | Human | Esophagus | ESCC | 1.91e-05 | 6.17e-02 | 0.116 |
| 84876 | ORAI1 | P11T-E | Human | Esophagus | ESCC | 1.56e-07 | 2.44e-01 | 0.1426 |
| 84876 | ORAI1 | P12T-E | Human | Esophagus | ESCC | 4.54e-09 | 1.56e-01 | 0.1122 |
| 84876 | ORAI1 | P16T-E | Human | Esophagus | ESCC | 1.53e-13 | 2.90e-01 | 0.1153 |
| Page: 1 2 3 4 5 |
| Tissue | Expression Dynamics | Abbreviation |
| Colorectum (GSE201348) |  | FAP: Familial adenomatous polyposis |
| CRC: Colorectal cancer | ||
| Colorectum (HTA11) |  | AD: Adenomas |
| SER: Sessile serrated lesions | ||
| MSI-H: Microsatellite-high colorectal cancer | ||
| MSS: Microsatellite stable colorectal cancer | ||
| Esophagus | 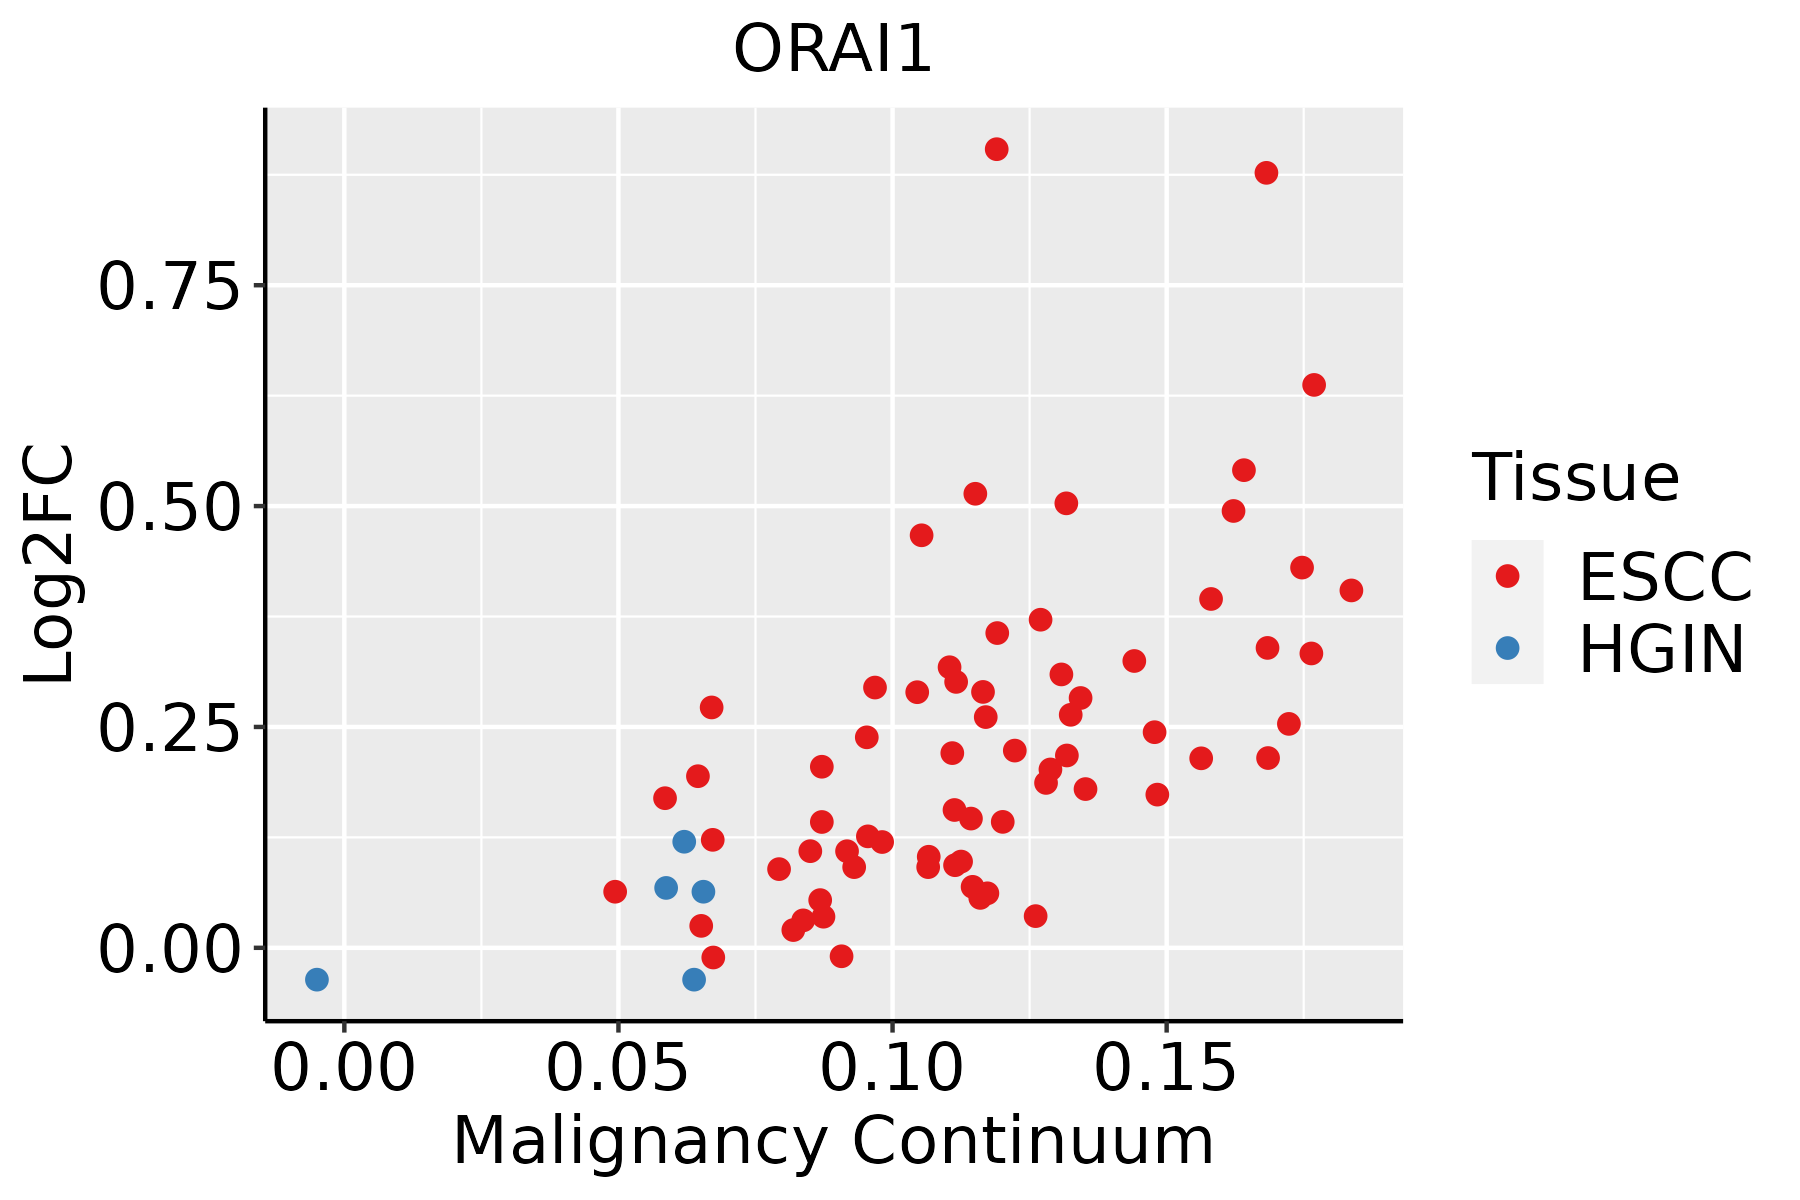 | ESCC: Esophageal squamous cell carcinoma |
| HGIN: High-grade intraepithelial neoplasias | ||
| LGIN: Low-grade intraepithelial neoplasias | ||
| Liver | 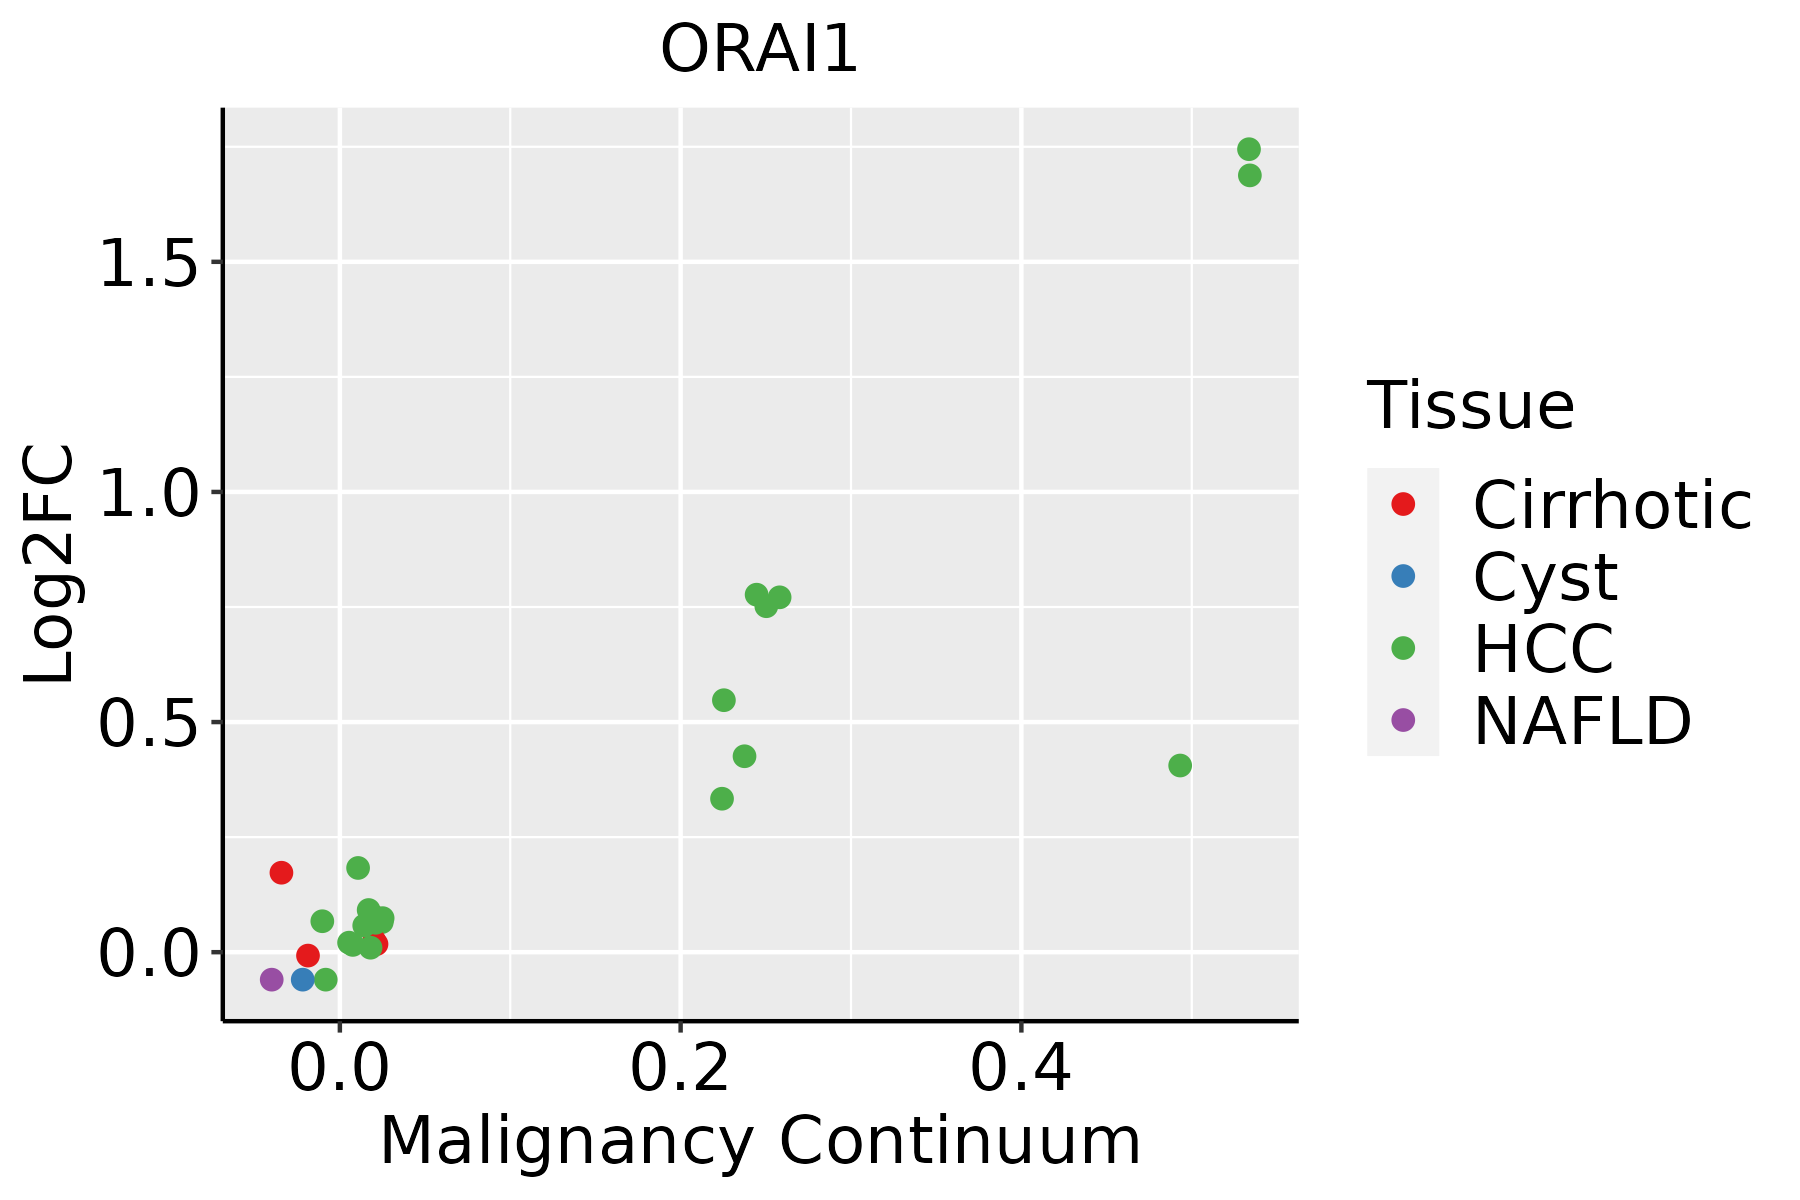 | HCC: Hepatocellular carcinoma |
| NAFLD: Non-alcoholic fatty liver disease | ||
| Oral Cavity | 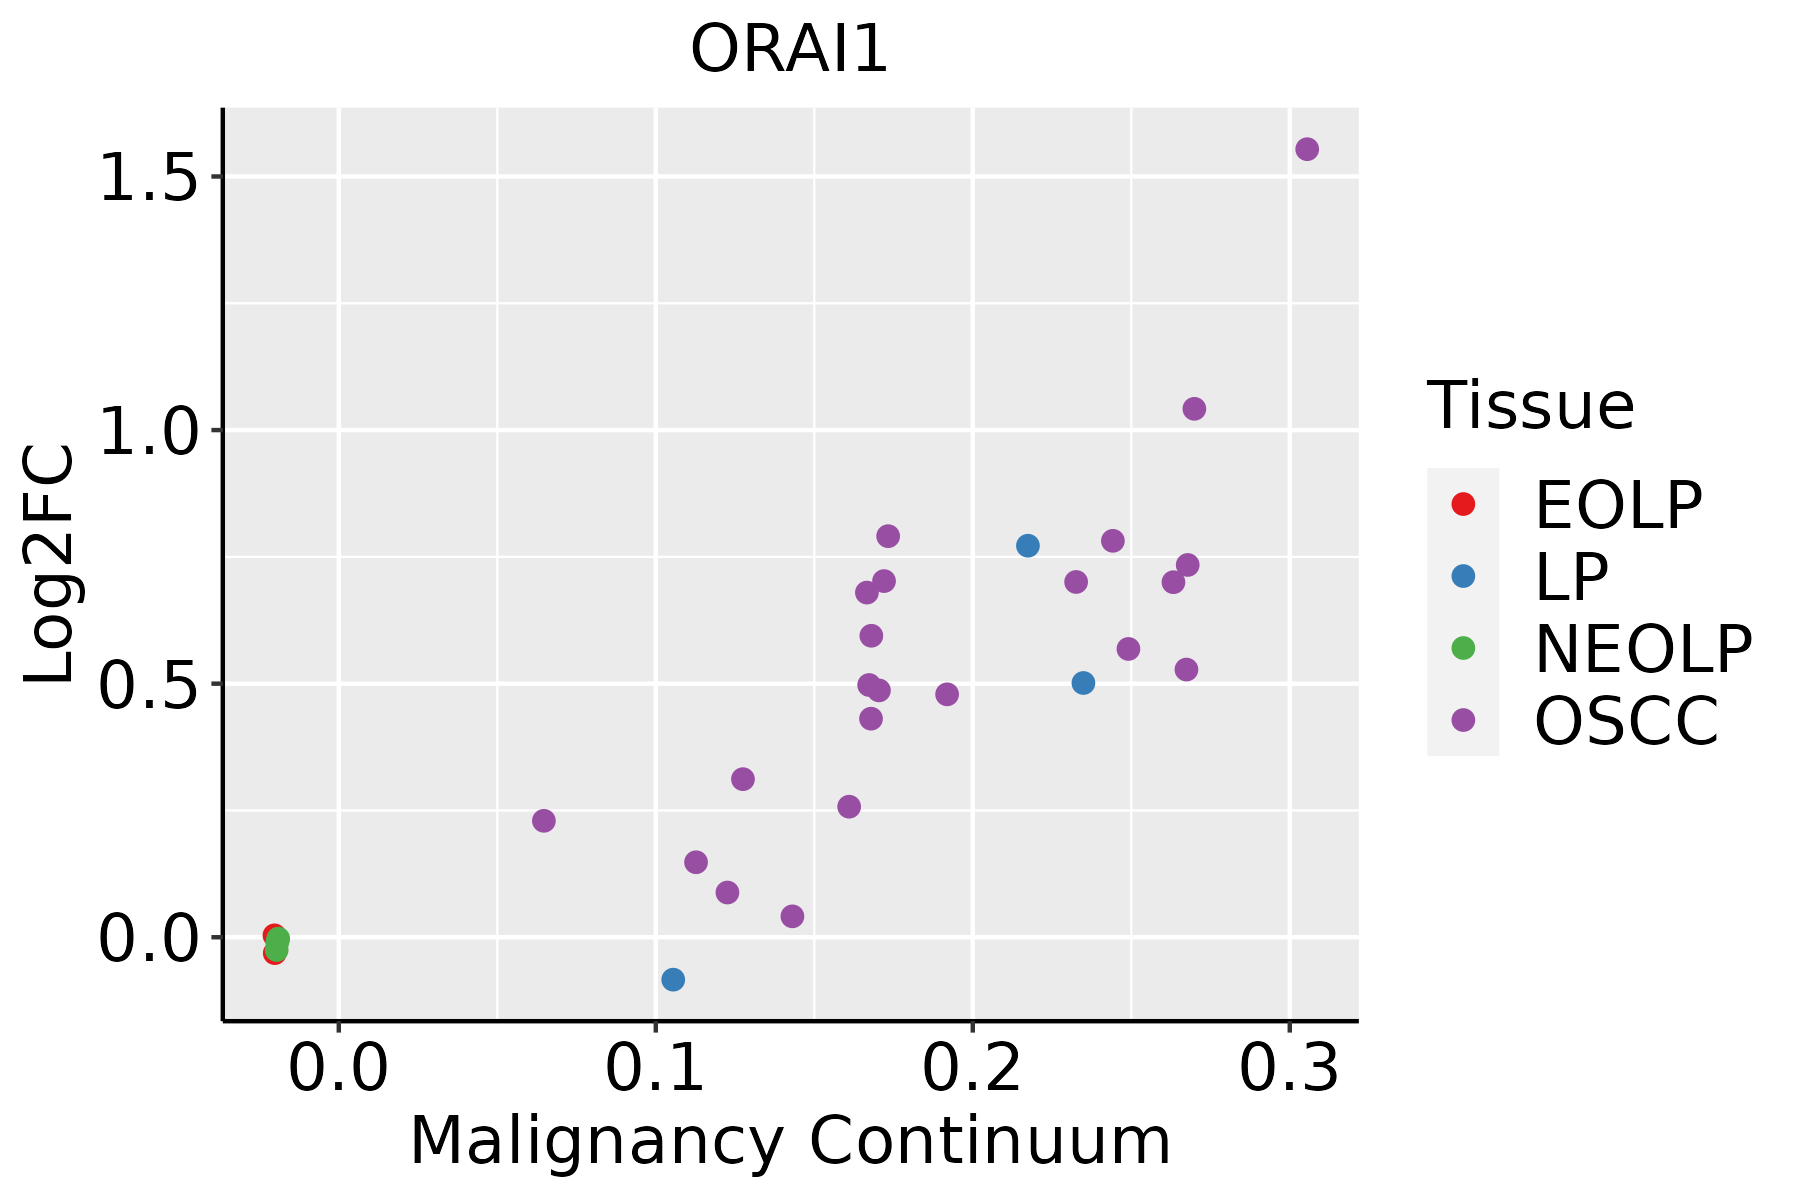 | EOLP: Erosive Oral lichen planus |
| LP: leukoplakia | ||
| NEOLP: Non-erosive oral lichen planus | ||
| OSCC: Oral squamous cell carcinoma | ||
| Skin | 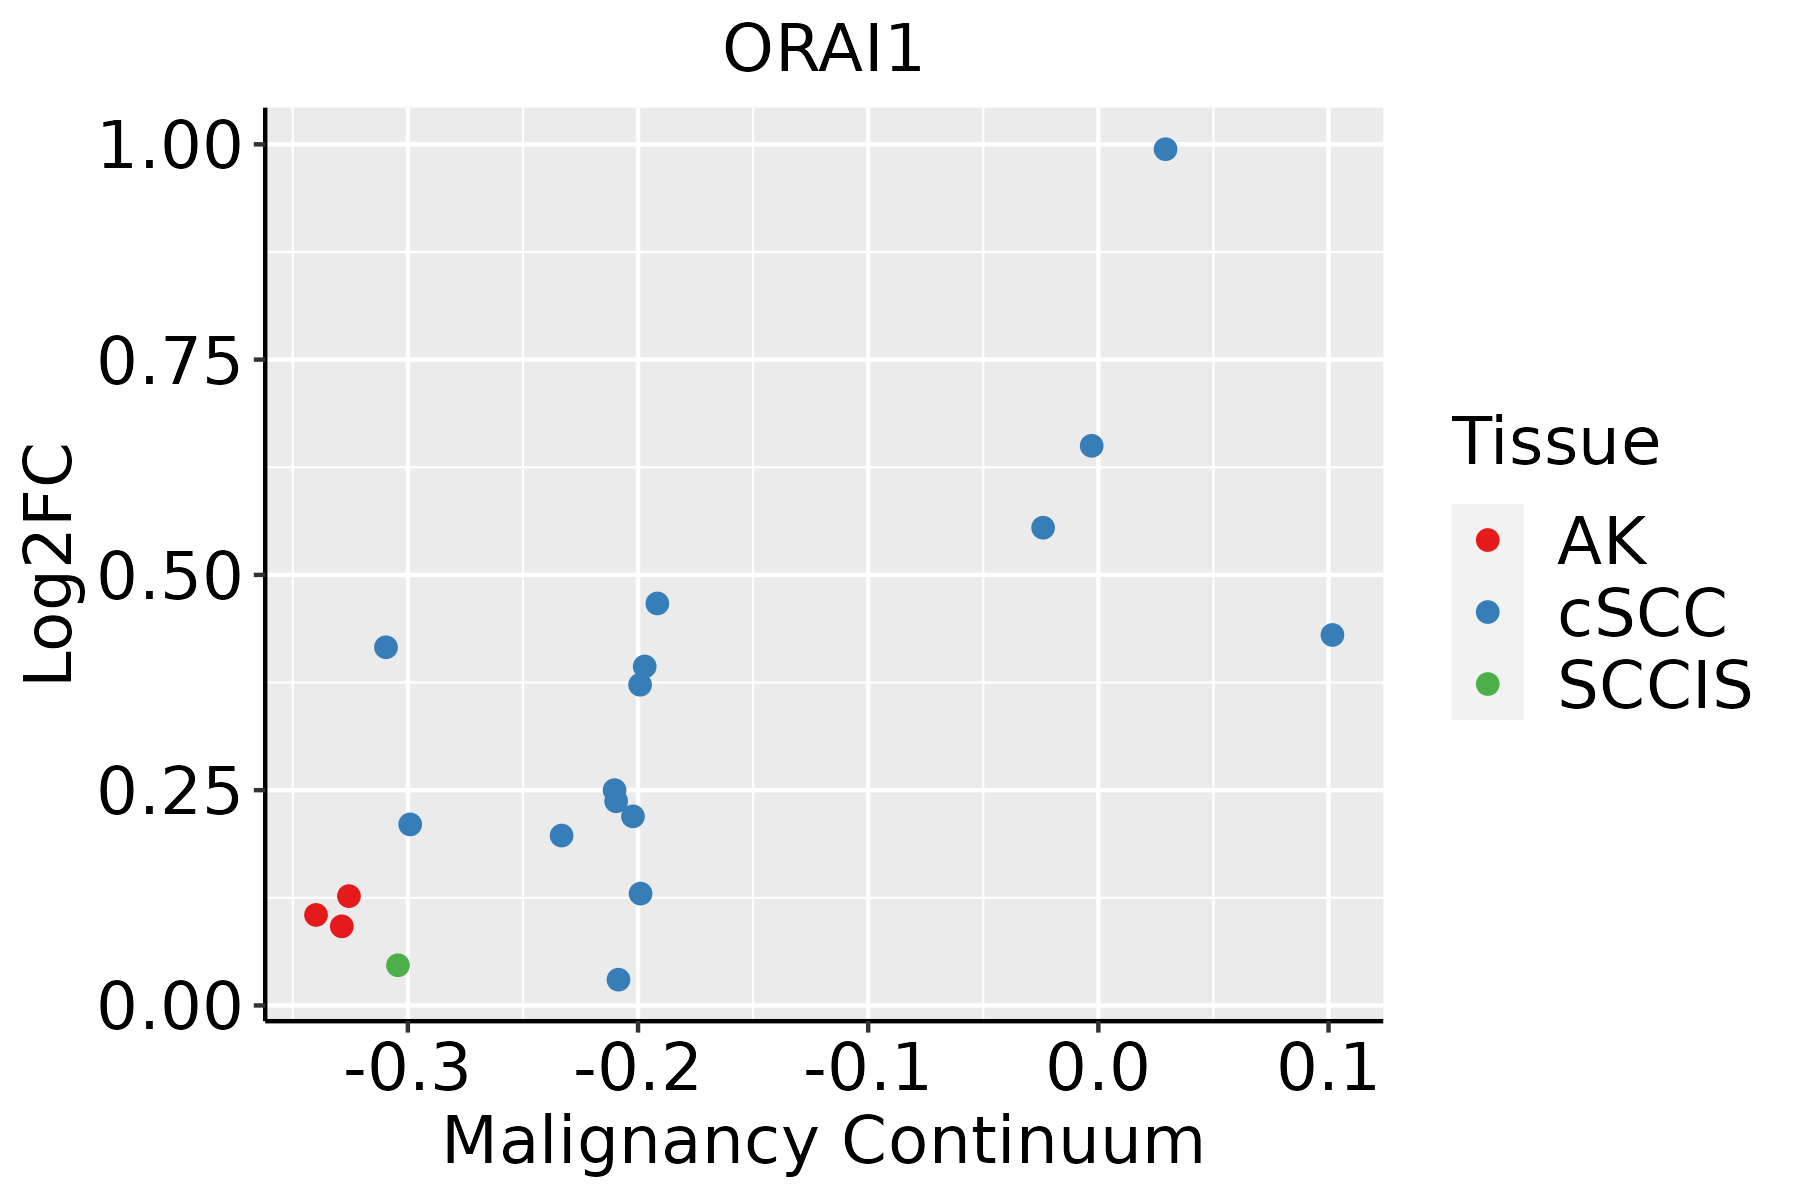 | AK: Actinic keratosis |
| cSCC: Cutaneous squamous cell carcinoma | ||
| SCCIS:squamous cell carcinoma in situ |
| ∗log2FC in expression of this searched gene in stem-like cells from each diseased tissue sample relative to stem-like cells in normal samples in each tissue plotted against the malignancy continuum. Samples are colored based on if they are from different disease stage. |
Top |
Malignant transformation related pathway analysis |
| Find out the enriched GO biological processes and KEGG pathways involved in transition from healthy to precancer to cancer |
| Tissue | Disease Stage | Enriched GO biological Processes |
| Colorectum | AD |  |
| Colorectum | SER |  |
| Colorectum | MSS |  |
| Colorectum | MSI-H |  |
| Colorectum | FAP |  |
| ∗Top 15 enriched GO BP terms are showed in the bar plot of each disease state in each tissue. Each row represents a significant GO biological process which is colored according to the -log10(p.adjust). |
| Page: 1 2 3 4 5 6 7 8 9 |
| GO ID | Tissue | Disease Stage | Description | Gene Ratio | Bg Ratio | pvalue | p.adjust | Count |
| GO:0048732 | Colorectum | AD | gland development | 149/3918 | 436/18723 | 6.07e-11 | 6.33e-09 | 149 |
| GO:0030879 | Colorectum | AD | mammary gland development | 53/3918 | 137/18723 | 1.46e-06 | 4.58e-05 | 53 |
| GO:0061180 | Colorectum | AD | mammary gland epithelium development | 28/3918 | 67/18723 | 8.74e-05 | 1.35e-03 | 28 |
| GO:00487321 | Colorectum | SER | gland development | 112/2897 | 436/18723 | 1.75e-08 | 1.28e-06 | 112 |
| GO:00611801 | Colorectum | SER | mammary gland epithelium development | 22/2897 | 67/18723 | 3.11e-04 | 5.03e-03 | 22 |
| GO:00308791 | Colorectum | SER | mammary gland development | 37/2897 | 137/18723 | 3.61e-04 | 5.61e-03 | 37 |
| GO:00487322 | Colorectum | MSS | gland development | 143/3467 | 436/18723 | 3.85e-13 | 8.01e-11 | 143 |
| GO:00308792 | Colorectum | MSS | mammary gland development | 51/3467 | 137/18723 | 1.88e-07 | 8.26e-06 | 51 |
| GO:00611802 | Colorectum | MSS | mammary gland epithelium development | 28/3467 | 67/18723 | 8.47e-06 | 2.11e-04 | 28 |
| GO:0051349 | Colorectum | MSS | positive regulation of lyase activity | 10/3467 | 23/18723 | 5.06e-03 | 3.47e-02 | 10 |
| GO:00487323 | Colorectum | MSI-H | gland development | 53/1319 | 436/18723 | 7.08e-05 | 2.35e-03 | 53 |
| GO:0048732111 | Esophagus | ESCC | gland development | 269/8552 | 436/18723 | 7.81e-12 | 2.95e-10 | 269 |
| GO:003087914 | Esophagus | ESCC | mammary gland development | 85/8552 | 137/18723 | 8.11e-05 | 6.01e-04 | 85 |
| GO:00611807 | Esophagus | ESCC | mammary gland epithelium development | 43/8552 | 67/18723 | 1.73e-03 | 7.97e-03 | 43 |
| GO:004873222 | Liver | HCC | gland development | 242/7958 | 436/18723 | 2.26e-08 | 5.28e-07 | 242 |
| GO:00308795 | Liver | HCC | mammary gland development | 75/7958 | 137/18723 | 2.52e-03 | 1.22e-02 | 75 |
| GO:004873220 | Oral cavity | OSCC | gland development | 226/7305 | 436/18723 | 2.78e-08 | 5.39e-07 | 226 |
| GO:003087910 | Oral cavity | OSCC | mammary gland development | 69/7305 | 137/18723 | 4.43e-03 | 1.79e-02 | 69 |
| GO:0048732110 | Oral cavity | LP | gland development | 149/4623 | 436/18723 | 4.51e-06 | 9.17e-05 | 149 |
| GO:004873227 | Skin | cSCC | gland development | 167/4864 | 436/18723 | 7.64e-09 | 2.44e-07 | 167 |
| Page: 1 2 |
| Pathway ID | Tissue | Disease Stage | Description | Gene Ratio | Bg Ratio | pvalue | p.adjust | qvalue | Count |
| hsa046112 | Liver | HCC | Platelet activation | 71/4020 | 124/8465 | 1.77e-02 | 4.15e-02 | 2.31e-02 | 71 |
| hsa0461111 | Liver | HCC | Platelet activation | 71/4020 | 124/8465 | 1.77e-02 | 4.15e-02 | 2.31e-02 | 71 |
| Page: 1 |
Top |
Cell-cell communication analysis |
| Identification of potential cell-cell interactions between two cell types and their ligand-receptor pairs for different disease states |
| Ligand | Receptor | LRpair | Pathway | Tissue | Disease Stage |
| Page: 1 |
Top |
Single-cell gene regulatory network inference analysis |
| Find out the significant the regulons (TFs) and the target genes of each regulon across cell types for different disease states |
| TF | Cell Type | Tissue | Disease Stage | Target Gene | RSS | Regulon Activity |
| ∗The dot plots of a searched regulon are shown for all cell subpopulations in each disease state of each tissue based on the regulon specific score inferred using pySCENIC and by calculating the average expression. |
| Page: 1 |
Top |
Somatic mutation of malignant transformation related genes |
| Annotation of somatic variants for genes involved in malignant transformation |
| Hugo Symbol | Variant Class | Variant Classification | dbSNP RS | HGVSc | HGVSp | HGVSp Short | SWISSPROT | BIOTYPE | SIFT | PolyPhen | Tumor Sample Barcode | Tissue | Histology | Sex | Age | Stage | Therapy Types | Drugs | Outcome |
| ORAI1 | SNV | Missense_Mutation | novel | c.709N>C | p.Tyr237His | p.Y237H | protein_coding | deleterious_low_confidence(0) | benign(0.185) | TCGA-D8-A1XK-01 | Breast | breast invasive carcinoma | Female | <65 | I/II | Chemotherapy | doxorubicine+cyclophosphamide | SD | |
| ORAI1 | deletion | Frame_Shift_Del | novel | c.672delN | p.His225ThrfsTer7 | p.H225Tfs*7 | protein_coding | TCGA-EW-A2FV-01 | Breast | breast invasive carcinoma | Female | <65 | III/IV | Chemotherapy | docetaxel | SD | |||
| ORAI1 | SNV | Missense_Mutation | rs782280709 | c.251A>G | p.Asn84Ser | p.N84S | protein_coding | deleterious(0.03) | probably_damaging(0.926) | TCGA-ZJ-AAX4-01 | Cervix | cervical & endocervical cancer | Female | >=65 | I/II | Unknown | Unknown | SD | |
| ORAI1 | SNV | Missense_Mutation | novel | c.614G>A | p.Arg205Gln | p.R205Q | protein_coding | tolerated(0.08) | probably_damaging(0.978) | TCGA-A6-2679-01 | Colorectum | colon adenocarcinoma | Female | >=65 | I/II | Unknown | Unknown | SD | |
| ORAI1 | SNV | Missense_Mutation | novel | c.427N>T | p.Pro143Ser | p.P143S | protein_coding | tolerated_low_confidence(0.77) | benign(0.003) | TCGA-A6-2686-01 | Colorectum | colon adenocarcinoma | Female | >=65 | I/II | Unknown | Unknown | SD | |
| ORAI1 | SNV | Missense_Mutation | rs782538669 | c.310N>T | p.Arg104Cys | p.R104C | protein_coding | deleterious(0) | probably_damaging(0.999) | TCGA-A6-A565-01 | Colorectum | colon adenocarcinoma | Female | <65 | III/IV | Unspecific | 5FU | PD | |
| ORAI1 | SNV | Missense_Mutation | rs368310115 | c.221N>T | p.Ala74Val | p.A74V | protein_coding | deleterious(0) | possibly_damaging(0.869) | TCGA-AA-3821-01 | Colorectum | colon adenocarcinoma | Female | >=65 | I/II | Unknown | Unknown | SD | |
| ORAI1 | SNV | Missense_Mutation | novel | c.481N>A | p.Val161Ile | p.V161I | protein_coding | tolerated(0.27) | benign(0.017) | TCGA-AA-3864-01 | Colorectum | colon adenocarcinoma | Male | >=65 | I/II | Unknown | Unknown | SD | |
| ORAI1 | SNV | Missense_Mutation | novel | c.636N>T | p.Glu212Asp | p.E212D | protein_coding | tolerated(0.07) | probably_damaging(0.978) | TCGA-G4-6588-01 | Colorectum | colon adenocarcinoma | Female | <65 | I/II | Unknown | Unknown | SD | |
| ORAI1 | SNV | Missense_Mutation | novel | c.686A>C | p.His229Pro | p.H229P | protein_coding | tolerated(0.25) | benign(0) | TCGA-A5-A0GP-01 | Endometrium | uterine corpus endometrioid carcinoma | Female | <65 | I/II | Unknown | Unknown | SD |
| Page: 1 2 3 |
Top |
Related drugs of malignant transformation related genes |
| Identification of chemicals and drugs interact with genes involved in malignant transfromation |
| (DGIdb 4.0) |
| Entrez ID | Symbol | Category | Interaction Types | Drug Claim Name | Drug Name | PMIDs |
| 84876 | ORAI1 | TRANSCRIPTION FACTOR, ION CHANNEL, TRANSPORTER | CM2489 | |||
| 84876 | ORAI1 | TRANSCRIPTION FACTOR, ION CHANNEL, TRANSPORTER | blocker | 381118797 | ||
| 84876 | ORAI1 | TRANSCRIPTION FACTOR, ION CHANNEL, TRANSPORTER | blocker | 381118798 | ||
| 84876 | ORAI1 | TRANSCRIPTION FACTOR, ION CHANNEL, TRANSPORTER | RP4010 | |||
| 84876 | ORAI1 | TRANSCRIPTION FACTOR, ION CHANNEL, TRANSPORTER | blocker | 375973230 | ||
| 84876 | ORAI1 | TRANSCRIPTION FACTOR, ION CHANNEL, TRANSPORTER | blocker | 375973229 |
| Page: 1 |

Copyright 2023-Present -The University of Texas Health Science Center at Houston |