
|
|||||
|
 | |
| |
| |
| |
| |
| |
|
Gene: OR51E1 |
Gene summary for OR51E1 |
| Gene information | Species | Human | Gene symbol | OR51E1 | Gene ID | 143503 |
| Gene name | olfactory receptor family 51 subfamily E member 1 | |
| Gene Alias | D-GPCR | |
| Cytomap | 11p15.4 | |
| Gene Type | protein-coding | GO ID | GO:0003008 | UniProtAcc | A0A126GVF8 |
Top |
Malignant transformation analysis |
| Identification of the aberrant gene expression in precancerous and cancerous lesions by comparing the gene expression of stem-like cells in diseased tissues with normal stem cells |
| Entrez ID | Symbol | Replicates | Species | Organ | Tissue | Adj P-value | Log2FC | Malignancy |
| 143503 | OR51E1 | S014 | Human | Liver | HCC | 4.86e-10 | 6.48e-01 | 0.2254 |
| 143503 | OR51E1 | S016 | Human | Liver | HCC | 1.04e-22 | 1.35e+00 | 0.2243 |
| Page: 1 |
| Tissue | Expression Dynamics | Abbreviation |
| Liver | 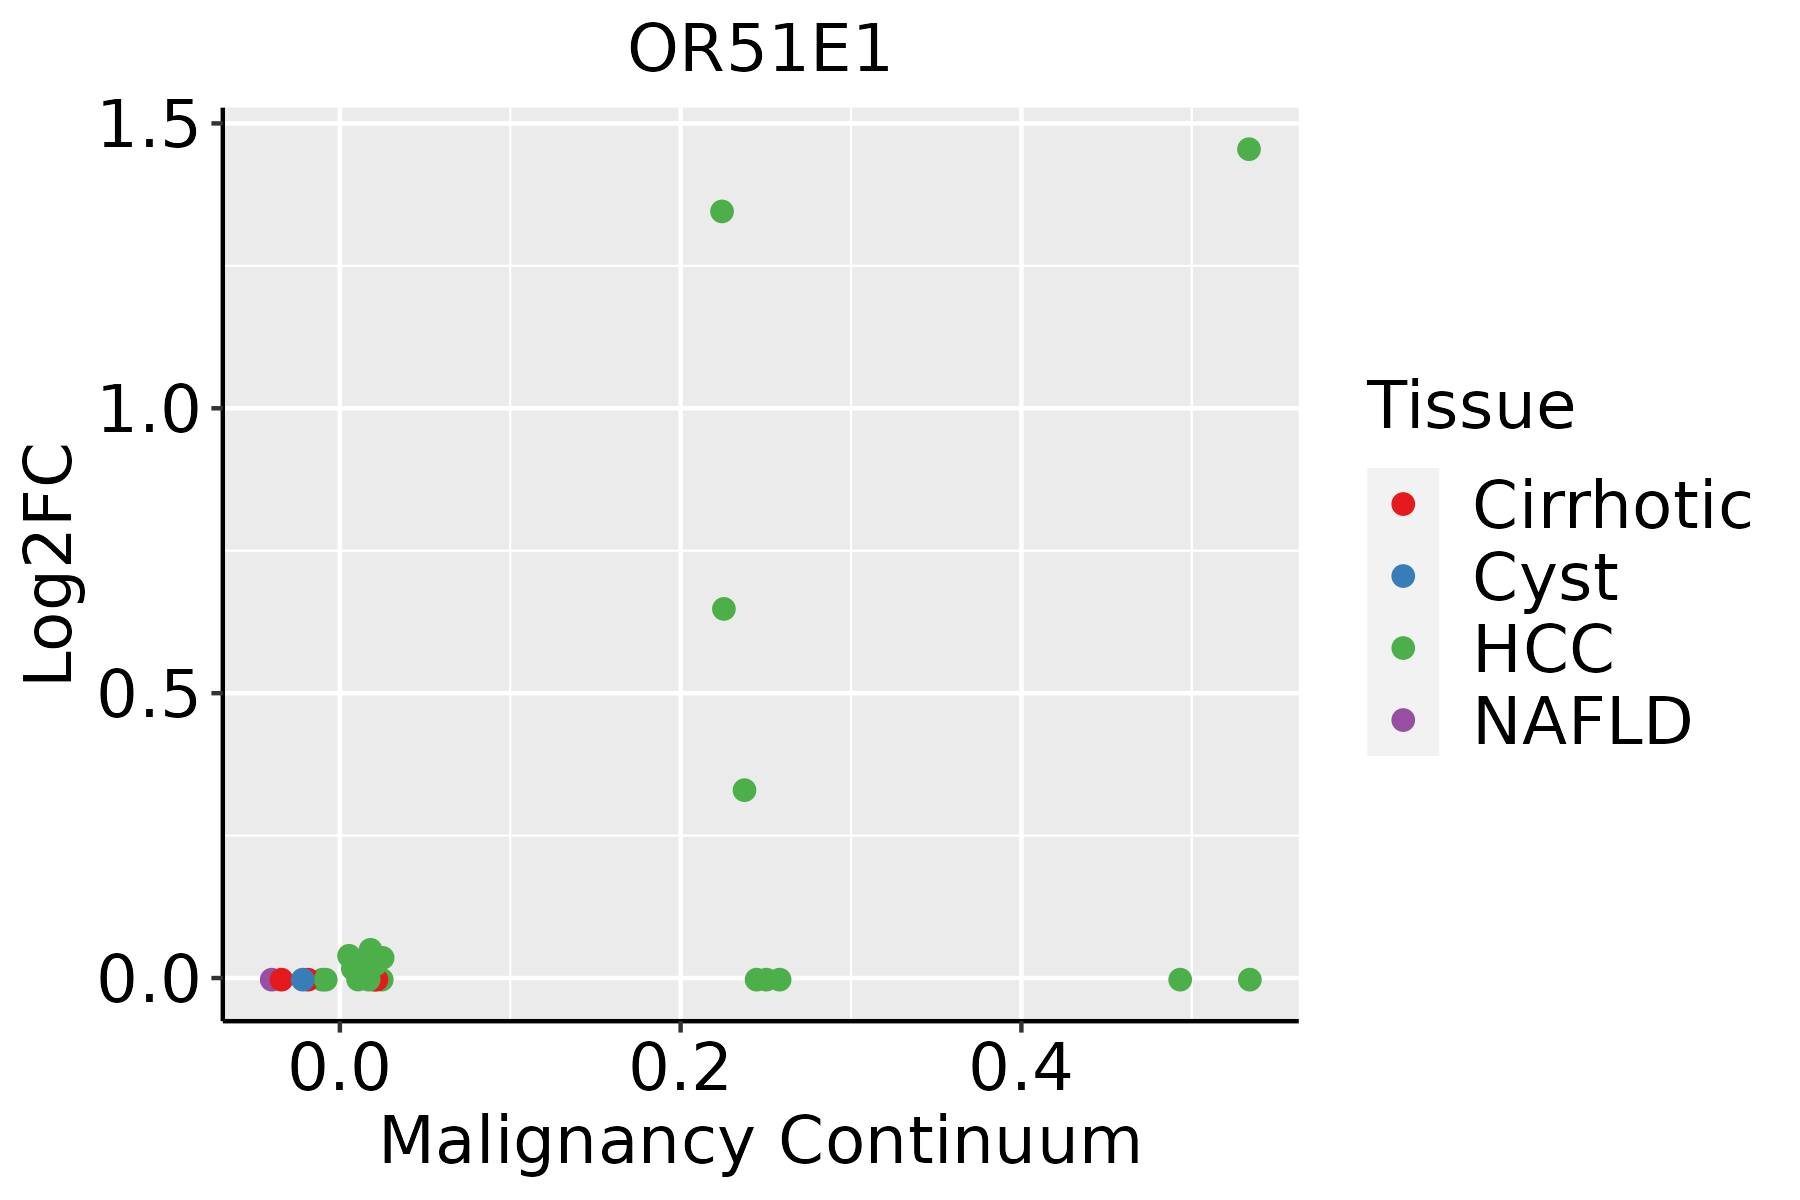 | HCC: Hepatocellular carcinoma |
| NAFLD: Non-alcoholic fatty liver disease |
| ∗log2FC in expression of this searched gene in stem-like cells from each diseased tissue sample relative to stem-like cells in normal samples in each tissue plotted against the malignancy continuum. Samples are colored based on if they are from different disease stage. |
Top |
Malignant transformation related pathway analysis |
| Find out the enriched GO biological processes and KEGG pathways involved in transition from healthy to precancer to cancer |
| Tissue | Disease Stage | Enriched GO biological Processes |
| Colorectum | AD |  |
| Colorectum | SER |  |
| Colorectum | MSS |  |
| Colorectum | MSI-H |  |
| Colorectum | FAP |  |
| ∗Top 15 enriched GO BP terms are showed in the bar plot of each disease state in each tissue. Each row represents a significant GO biological process which is colored according to the -log10(p.adjust). |
| Page: 1 2 3 4 5 6 7 8 9 |
| GO ID | Tissue | Disease Stage | Description | Gene Ratio | Bg Ratio | pvalue | p.adjust | Count |
| Page: 1 |
| Pathway ID | Tissue | Disease Stage | Description | Gene Ratio | Bg Ratio | pvalue | p.adjust | qvalue | Count |
| Page: 1 |
Top |
Cell-cell communication analysis |
| Identification of potential cell-cell interactions between two cell types and their ligand-receptor pairs for different disease states |
| Ligand | Receptor | LRpair | Pathway | Tissue | Disease Stage |
| Page: 1 |
Top |
Single-cell gene regulatory network inference analysis |
| Find out the significant the regulons (TFs) and the target genes of each regulon across cell types for different disease states |
| TF | Cell Type | Tissue | Disease Stage | Target Gene | RSS | Regulon Activity |
| ∗The dot plots of a searched regulon are shown for all cell subpopulations in each disease state of each tissue based on the regulon specific score inferred using pySCENIC and by calculating the average expression. |
| Page: 1 |
Top |
Somatic mutation of malignant transformation related genes |
| Annotation of somatic variants for genes involved in malignant transformation |
| Hugo Symbol | Variant Class | Variant Classification | dbSNP RS | HGVSc | HGVSp | HGVSp Short | SWISSPROT | BIOTYPE | SIFT | PolyPhen | Tumor Sample Barcode | Tissue | Histology | Sex | Age | Stage | Therapy Types | Drugs | Outcome |
| OR51E1 | SNV | Missense_Mutation | rs200993659 | c.910C>T | p.Arg304Cys | p.R304C | Q8TCB6 | protein_coding | deleterious(0) | probably_damaging(0.999) | TCGA-A8-A07F-01 | Breast | breast invasive carcinoma | Female | >=65 | I/II | Hormone Therapy | tamoxiphen | SD |
| OR51E1 | SNV | Missense_Mutation | rs192878981 | c.401N>A | p.Arg134His | p.R134H | Q8TCB6 | protein_coding | tolerated(0.15) | benign(0.024) | TCGA-E9-A1N8-01 | Breast | breast invasive carcinoma | Female | <65 | I/II | Chemotherapy | doxorubicin | SD |
| OR51E1 | SNV | Missense_Mutation | rs201979094 | c.805N>T | p.Arg269Trp | p.R269W | Q8TCB6 | protein_coding | tolerated(0.06) | possibly_damaging(0.54) | TCGA-E9-A1RC-01 | Breast | breast invasive carcinoma | Female | <65 | III/IV | Hormone Therapy | tamoxiphen | SD |
| OR51E1 | SNV | Missense_Mutation | rs575981363 | c.808N>T | p.Arg270Cys | p.R270C | Q8TCB6 | protein_coding | tolerated(0.14) | possibly_damaging(0.54) | TCGA-FU-A23L-01 | Cervix | cervical & endocervical cancer | Female | <65 | I/II | Chemotherapy | cisplatin | CR |
| OR51E1 | SNV | Missense_Mutation | rs779396777 | c.428N>A | p.Arg143His | p.R143H | Q8TCB6 | protein_coding | deleterious(0.03) | probably_damaging(0.979) | TCGA-5M-AAT6-01 | Colorectum | colon adenocarcinoma | Female | <65 | III/IV | Unknown | Unknown | PD |
| OR51E1 | SNV | Missense_Mutation | rs575981363 | c.808N>T | p.Arg270Cys | p.R270C | Q8TCB6 | protein_coding | tolerated(0.14) | possibly_damaging(0.54) | TCGA-AA-3492-01 | Colorectum | colon adenocarcinoma | Female | >=65 | I/II | Unknown | Unknown | SD |
| OR51E1 | SNV | Missense_Mutation | rs146565220 | c.826G>A | p.Val276Ile | p.V276I | Q8TCB6 | protein_coding | tolerated(1) | benign(0.012) | TCGA-AA-3866-01 | Colorectum | colon adenocarcinoma | Female | >=65 | I/II | Unknown | Unknown | SD |
| OR51E1 | SNV | Missense_Mutation | c.722G>A | p.Gly241Asp | p.G241D | Q8TCB6 | protein_coding | deleterious(0.03) | possibly_damaging(0.682) | TCGA-DM-A1HB-01 | Colorectum | colon adenocarcinoma | Male | >=65 | III/IV | Unknown | Unknown | SD | |
| OR51E1 | SNV | Missense_Mutation | c.252N>T | p.Met84Ile | p.M84I | Q8TCB6 | protein_coding | tolerated(0.48) | probably_damaging(0.986) | TCGA-DM-A28F-01 | Colorectum | colon adenocarcinoma | Male | >=65 | III/IV | Unknown | Unknown | SD | |
| OR51E1 | SNV | Missense_Mutation | rs575981363 | c.808N>T | p.Arg270Cys | p.R270C | Q8TCB6 | protein_coding | tolerated(0.14) | possibly_damaging(0.54) | TCGA-G4-6299-01 | Colorectum | colon adenocarcinoma | Male | >=65 | III/IV | Ancillary | leucovorin | SD |
| Page: 1 2 3 4 5 |
Top |
Related drugs of malignant transformation related genes |
| Identification of chemicals and drugs interact with genes involved in malignant transfromation |
| (DGIdb 4.0) |
| Entrez ID | Symbol | Category | Interaction Types | Drug Claim Name | Drug Name | PMIDs |
| Page: 1 |

Copyright 2023-Present -The University of Texas Health Science Center at Houston |