
|
|||||
|
 | |
| |
| |
| |
| |
| |
|
Gene: OPHN1 |
Gene summary for OPHN1 |
| Gene information | Species | Human | Gene symbol | OPHN1 | Gene ID | 4983 |
| Gene name | oligophrenin 1 | |
| Gene Alias | ARHGAP41 | |
| Cytomap | Xq12 | |
| Gene Type | protein-coding | GO ID | GO:0000902 | UniProtAcc | O60890 |
Top |
Malignant transformation analysis |
| Identification of the aberrant gene expression in precancerous and cancerous lesions by comparing the gene expression of stem-like cells in diseased tissues with normal stem cells |
| Entrez ID | Symbol | Replicates | Species | Organ | Tissue | Adj P-value | Log2FC | Malignancy |
| 4983 | OPHN1 | AEH-subject1 | Human | Endometrium | AEH | 2.40e-03 | 3.08e-01 | -0.3059 |
| 4983 | OPHN1 | AEH-subject3 | Human | Endometrium | AEH | 2.16e-08 | 3.63e-01 | -0.2576 |
| 4983 | OPHN1 | AEH-subject5 | Human | Endometrium | AEH | 5.67e-21 | 6.06e-01 | -0.2953 |
| 4983 | OPHN1 | EEC-subject5 | Human | Endometrium | EEC | 5.50e-10 | 3.82e-01 | -0.249 |
| 4983 | OPHN1 | LZE4T | Human | Esophagus | ESCC | 2.37e-07 | 1.38e-01 | 0.0811 |
| 4983 | OPHN1 | LZE5T | Human | Esophagus | ESCC | 8.66e-04 | 2.08e-01 | 0.0514 |
| 4983 | OPHN1 | LZE7T | Human | Esophagus | ESCC | 8.95e-03 | 2.35e-01 | 0.0667 |
| 4983 | OPHN1 | LZE24T | Human | Esophagus | ESCC | 2.31e-19 | 4.24e-01 | 0.0596 |
| 4983 | OPHN1 | LZE21T | Human | Esophagus | ESCC | 2.04e-03 | 1.68e-01 | 0.0655 |
| 4983 | OPHN1 | P1T-E | Human | Esophagus | ESCC | 2.79e-03 | 1.70e-01 | 0.0875 |
| 4983 | OPHN1 | P2T-E | Human | Esophagus | ESCC | 2.09e-21 | 3.13e-01 | 0.1177 |
| 4983 | OPHN1 | P4T-E | Human | Esophagus | ESCC | 4.16e-11 | 2.27e-01 | 0.1323 |
| 4983 | OPHN1 | P5T-E | Human | Esophagus | ESCC | 5.29e-05 | 1.06e-01 | 0.1327 |
| 4983 | OPHN1 | P8T-E | Human | Esophagus | ESCC | 2.75e-13 | 2.45e-01 | 0.0889 |
| 4983 | OPHN1 | P9T-E | Human | Esophagus | ESCC | 1.21e-04 | 6.57e-02 | 0.1131 |
| 4983 | OPHN1 | P10T-E | Human | Esophagus | ESCC | 9.38e-13 | 8.35e-02 | 0.116 |
| 4983 | OPHN1 | P11T-E | Human | Esophagus | ESCC | 5.61e-11 | 3.62e-01 | 0.1426 |
| 4983 | OPHN1 | P12T-E | Human | Esophagus | ESCC | 2.93e-16 | 2.03e-01 | 0.1122 |
| 4983 | OPHN1 | P15T-E | Human | Esophagus | ESCC | 3.80e-03 | 9.08e-02 | 0.1149 |
| 4983 | OPHN1 | P16T-E | Human | Esophagus | ESCC | 3.72e-16 | 2.68e-01 | 0.1153 |
| Page: 1 2 3 4 5 |
| Tissue | Expression Dynamics | Abbreviation |
| Endometrium |  | AEH: Atypical endometrial hyperplasia |
| EEC: Endometrioid Cancer | ||
| Esophagus | 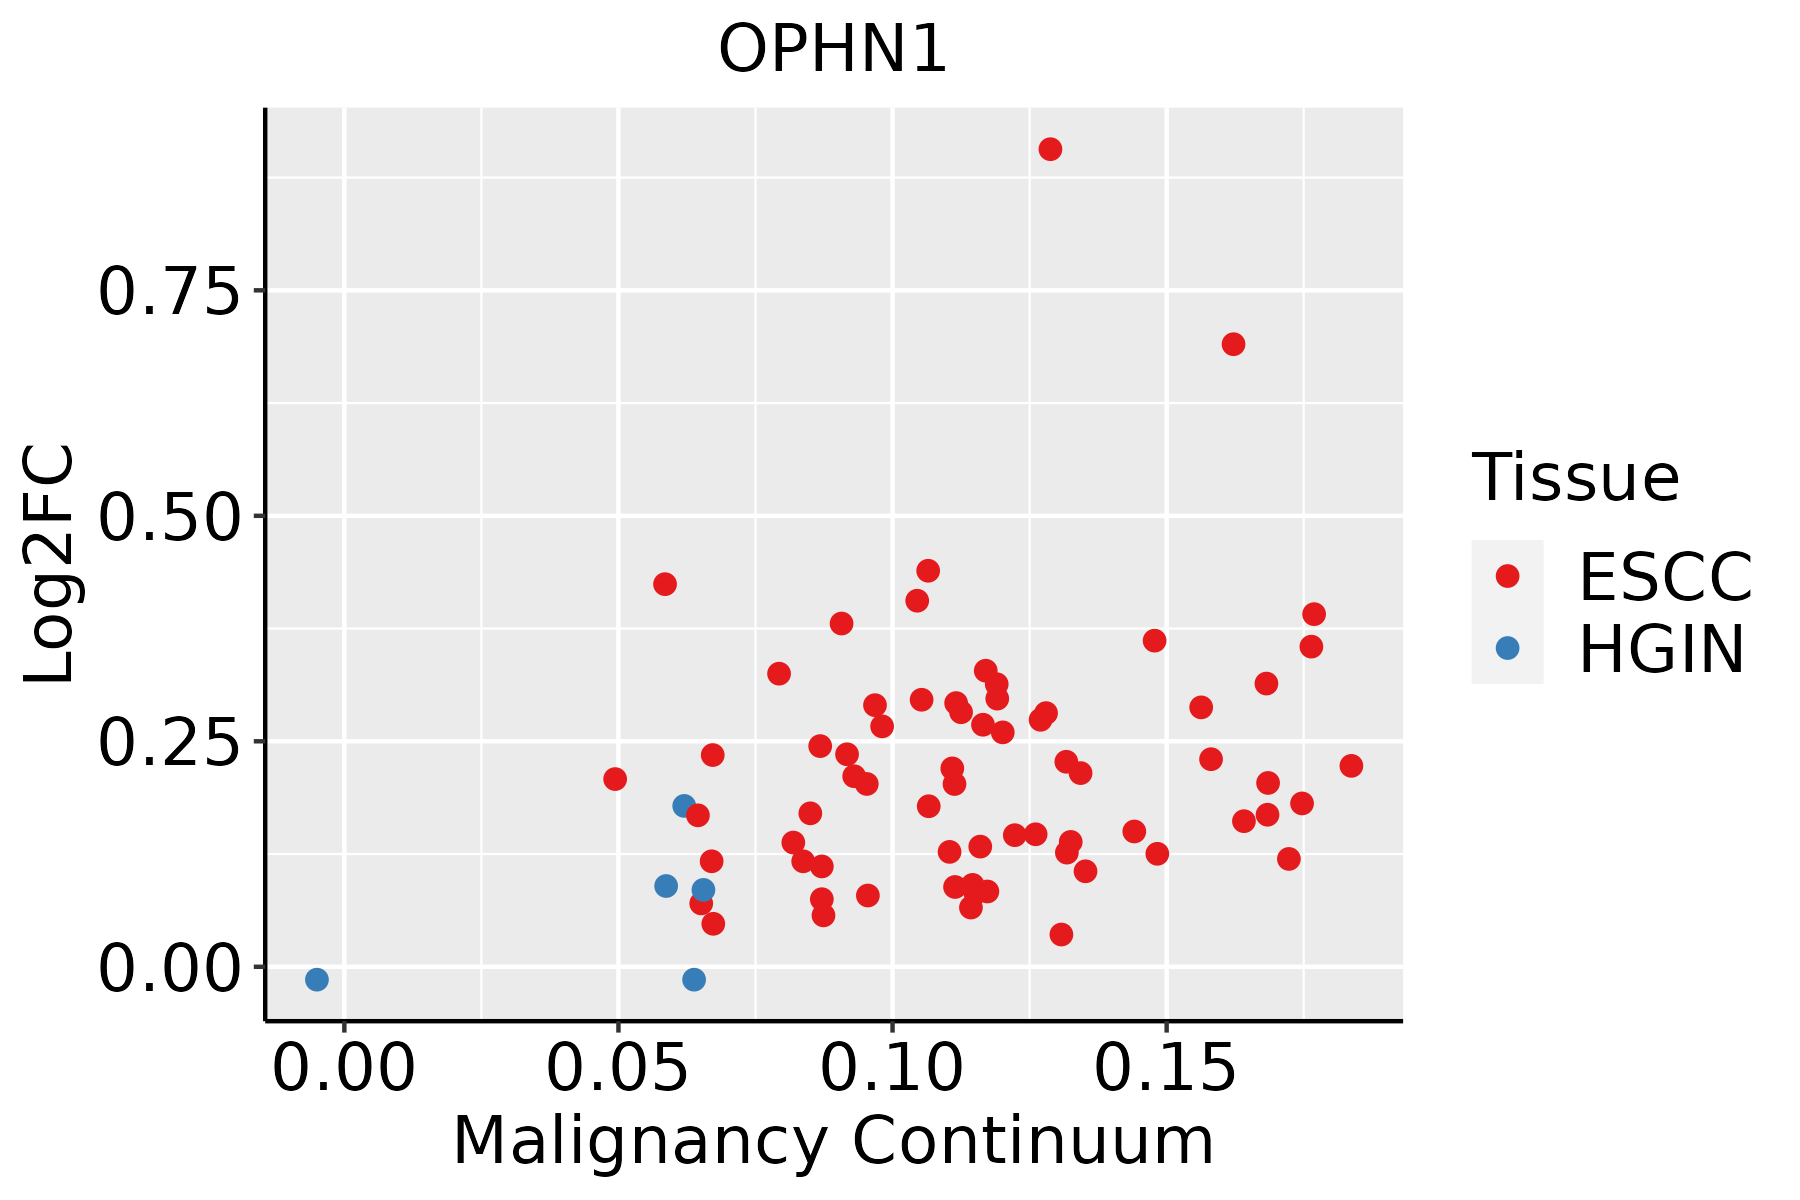 | ESCC: Esophageal squamous cell carcinoma |
| HGIN: High-grade intraepithelial neoplasias | ||
| LGIN: Low-grade intraepithelial neoplasias | ||
| Lung | 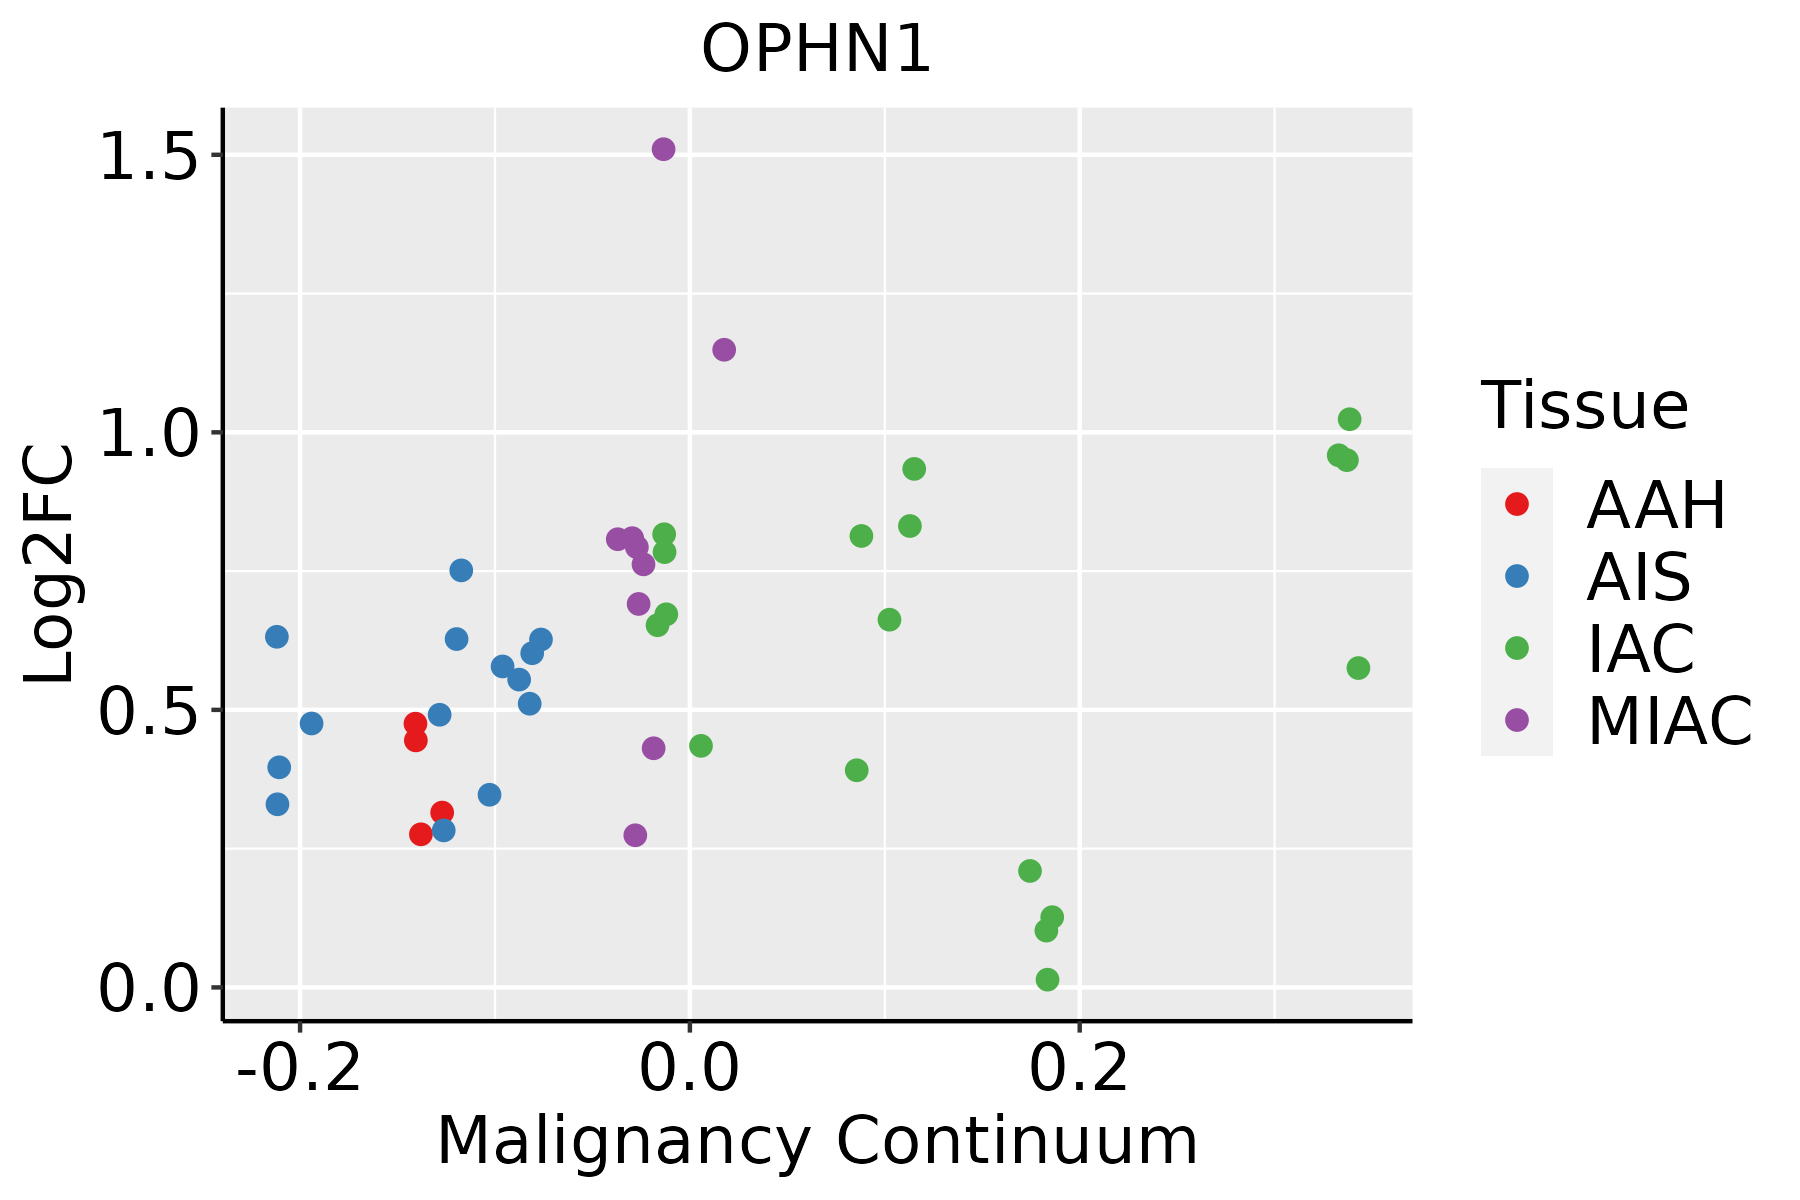 | AAH: Atypical adenomatous hyperplasia |
| AIS: Adenocarcinoma in situ | ||
| IAC: Invasive lung adenocarcinoma | ||
| MIA: Minimally invasive adenocarcinoma |
| ∗log2FC in expression of this searched gene in stem-like cells from each diseased tissue sample relative to stem-like cells in normal samples in each tissue plotted against the malignancy continuum. Samples are colored based on if they are from different disease stage. |
Top |
Malignant transformation related pathway analysis |
| Find out the enriched GO biological processes and KEGG pathways involved in transition from healthy to precancer to cancer |
| Tissue | Disease Stage | Enriched GO biological Processes |
| Colorectum | AD |  |
| Colorectum | SER |  |
| Colorectum | MSS |  |
| Colorectum | MSI-H |  |
| Colorectum | FAP |  |
| ∗Top 15 enriched GO BP terms are showed in the bar plot of each disease state in each tissue. Each row represents a significant GO biological process which is colored according to the -log10(p.adjust). |
| Page: 1 2 3 4 5 6 7 8 9 |
| GO ID | Tissue | Disease Stage | Description | Gene Ratio | Bg Ratio | pvalue | p.adjust | Count |
| GO:004217616 | Endometrium | AEH | regulation of protein catabolic process | 100/2100 | 391/18723 | 9.58e-16 | 3.59e-13 | 100 |
| GO:190336216 | Endometrium | AEH | regulation of cellular protein catabolic process | 70/2100 | 255/18723 | 5.40e-13 | 1.25e-10 | 70 |
| GO:001049816 | Endometrium | AEH | proteasomal protein catabolic process | 108/2100 | 490/18723 | 2.73e-12 | 4.67e-10 | 108 |
| GO:190305016 | Endometrium | AEH | regulation of proteolysis involved in cellular protein catabolic process | 58/2100 | 221/18723 | 3.58e-10 | 3.77e-08 | 58 |
| GO:006113616 | Endometrium | AEH | regulation of proteasomal protein catabolic process | 49/2100 | 187/18723 | 8.64e-09 | 5.96e-07 | 49 |
| GO:000716310 | Endometrium | AEH | establishment or maintenance of cell polarity | 54/2100 | 218/18723 | 1.30e-08 | 8.47e-07 | 54 |
| GO:004217715 | Endometrium | AEH | negative regulation of protein catabolic process | 34/2100 | 121/18723 | 2.67e-07 | 1.17e-05 | 34 |
| GO:00074098 | Endometrium | AEH | axonogenesis | 81/2100 | 418/18723 | 5.54e-07 | 2.12e-05 | 81 |
| GO:00615648 | Endometrium | AEH | axon development | 88/2100 | 467/18723 | 6.39e-07 | 2.38e-05 | 88 |
| GO:190336310 | Endometrium | AEH | negative regulation of cellular protein catabolic process | 24/2100 | 75/18723 | 1.18e-06 | 3.85e-05 | 24 |
| GO:00300109 | Endometrium | AEH | establishment of cell polarity | 36/2100 | 143/18723 | 2.19e-06 | 6.49e-05 | 36 |
| GO:00343299 | Endometrium | AEH | cell junction assembly | 78/2100 | 420/18723 | 4.80e-06 | 1.24e-04 | 78 |
| GO:190305110 | Endometrium | AEH | negative regulation of proteolysis involved in cellular protein catabolic process | 20/2100 | 64/18723 | 1.34e-05 | 2.88e-04 | 20 |
| GO:003133016 | Endometrium | AEH | negative regulation of cellular catabolic process | 53/2100 | 262/18723 | 1.40e-05 | 2.99e-04 | 53 |
| GO:00510567 | Endometrium | AEH | regulation of small GTPase mediated signal transduction | 59/2100 | 302/18723 | 1.43e-05 | 3.03e-04 | 59 |
| GO:00482598 | Endometrium | AEH | regulation of receptor-mediated endocytosis | 28/2100 | 110/18723 | 2.28e-05 | 4.35e-04 | 28 |
| GO:00072657 | Endometrium | AEH | Ras protein signal transduction | 63/2100 | 337/18723 | 3.09e-05 | 5.66e-04 | 63 |
| GO:00301009 | Endometrium | AEH | regulation of endocytosis | 44/2100 | 211/18723 | 3.39e-05 | 6.05e-04 | 44 |
| GO:00068988 | Endometrium | AEH | receptor-mediated endocytosis | 49/2100 | 244/18723 | 3.54e-05 | 6.24e-04 | 49 |
| GO:000989515 | Endometrium | AEH | negative regulation of catabolic process | 60/2100 | 320/18723 | 4.32e-05 | 7.28e-04 | 60 |
| Page: 1 2 3 4 5 6 7 8 9 10 11 12 |
| Pathway ID | Tissue | Disease Stage | Description | Gene Ratio | Bg Ratio | pvalue | p.adjust | qvalue | Count |
| Page: 1 |
Top |
Cell-cell communication analysis |
| Identification of potential cell-cell interactions between two cell types and their ligand-receptor pairs for different disease states |
| Ligand | Receptor | LRpair | Pathway | Tissue | Disease Stage |
| Page: 1 |
Top |
Single-cell gene regulatory network inference analysis |
| Find out the significant the regulons (TFs) and the target genes of each regulon across cell types for different disease states |
| TF | Cell Type | Tissue | Disease Stage | Target Gene | RSS | Regulon Activity |
| ∗The dot plots of a searched regulon are shown for all cell subpopulations in each disease state of each tissue based on the regulon specific score inferred using pySCENIC and by calculating the average expression. |
| Page: 1 |
Top |
Somatic mutation of malignant transformation related genes |
| Annotation of somatic variants for genes involved in malignant transformation |
| Hugo Symbol | Variant Class | Variant Classification | dbSNP RS | HGVSc | HGVSp | HGVSp Short | SWISSPROT | BIOTYPE | SIFT | PolyPhen | Tumor Sample Barcode | Tissue | Histology | Sex | Age | Stage | Therapy Types | Drugs | Outcome |
| OPHN1 | SNV | Missense_Mutation | c.1280N>G | p.Pro427Arg | p.P427R | O60890 | protein_coding | tolerated(0.19) | probably_damaging(0.914) | TCGA-A8-A08T-01 | Breast | breast invasive carcinoma | Female | <65 | III/IV | Unknown | Unknown | PD | |
| OPHN1 | SNV | Missense_Mutation | c.1258C>A | p.Leu420Met | p.L420M | O60890 | protein_coding | deleterious(0) | probably_damaging(0.991) | TCGA-D8-A1JD-01 | Breast | breast invasive carcinoma | Female | <65 | I/II | Chemotherapy | adriamycin | SD | |
| OPHN1 | SNV | Missense_Mutation | c.1054T>C | p.Ser352Pro | p.S352P | O60890 | protein_coding | deleterious(0) | possibly_damaging(0.855) | TCGA-E9-A1ND-01 | Breast | breast invasive carcinoma | Female | >=65 | I/II | Hormone Therapy | aromasin | SD | |
| OPHN1 | SNV | Missense_Mutation | c.2269N>A | p.Pro757Thr | p.P757T | O60890 | protein_coding | tolerated_low_confidence(0.9) | benign(0.003) | TCGA-EW-A1IZ-01 | Breast | breast invasive carcinoma | Female | <65 | III/IV | Chemotherapy | taxotere | SD | |
| OPHN1 | insertion | Nonsense_Mutation | novel | c.378_379insTCTTTGATTTCATTGAGCAGTGGTTTCTAGTTCTCCTTGAAG | p.Phe126_Thr127insSerLeuIleSerLeuSerSerGlyPheTerPheSerLeuLys | p.F126_T127insSLISLSSGF*FSLK | O60890 | protein_coding | TCGA-A2-A0CP-01 | Breast | breast invasive carcinoma | Female | <65 | I/II | Chemotherapy | cytoxan | SD | ||
| OPHN1 | SNV | Missense_Mutation | c.1672N>A | p.Glu558Lys | p.E558K | O60890 | protein_coding | deleterious(0) | probably_damaging(0.968) | TCGA-2W-A8YY-01 | Cervix | cervical & endocervical cancer | Female | <65 | I/II | Chemotherapy | cisplatin | CR | |
| OPHN1 | SNV | Missense_Mutation | c.604N>A | p.Ala202Thr | p.A202T | O60890 | protein_coding | deleterious(0.03) | benign(0.048) | TCGA-C5-A3HE-01 | Cervix | cervical & endocervical cancer | Female | <65 | I/II | Unknown | Unknown | PD | |
| OPHN1 | SNV | Missense_Mutation | c.1441N>T | p.Arg481Cys | p.R481C | O60890 | protein_coding | deleterious(0) | probably_damaging(0.998) | TCGA-C5-A8XJ-01 | Cervix | cervical & endocervical cancer | Female | >=65 | I/II | Chemotherapy | cisplatin | SD | |
| OPHN1 | SNV | Missense_Mutation | c.2132C>T | p.Pro711Leu | p.P711L | O60890 | protein_coding | deleterious(0.05) | benign(0.023) | TCGA-FU-A3HZ-01 | Cervix | cervical & endocervical cancer | Female | <65 | I/II | Chemotherapy | cisplatin | CR | |
| OPHN1 | SNV | Missense_Mutation | novel | c.1343N>A | p.Ser448Tyr | p.S448Y | O60890 | protein_coding | deleterious(0.02) | possibly_damaging(0.9) | TCGA-VS-A94X-01 | Cervix | cervical & endocervical cancer | Female | <65 | I/II | Chemotherapy | cisplatin | PD |
| Page: 1 2 3 4 5 6 7 8 9 10 11 |
Top |
Related drugs of malignant transformation related genes |
| Identification of chemicals and drugs interact with genes involved in malignant transfromation |
| (DGIdb 4.0) |
| Entrez ID | Symbol | Category | Interaction Types | Drug Claim Name | Drug Name | PMIDs |
| Page: 1 |

Copyright 2023-Present -The University of Texas Health Science Center at Houston |