
|
|||||
|
 | |
| |
| |
| |
| |
| |
|
Gene: OPA3 |
Gene summary for OPA3 |
| Gene information | Species | Human | Gene symbol | OPA3 | Gene ID | 80207 |
| Gene name | outer mitochondrial membrane lipid metabolism regulator OPA3 | |
| Gene Alias | MGA3 | |
| Cytomap | 19q13.32 | |
| Gene Type | protein-coding | GO ID | GO:0003008 | UniProtAcc | Q9H6K4 |
Top |
Malignant transformation analysis |
| Identification of the aberrant gene expression in precancerous and cancerous lesions by comparing the gene expression of stem-like cells in diseased tissues with normal stem cells |
| Entrez ID | Symbol | Replicates | Species | Organ | Tissue | Adj P-value | Log2FC | Malignancy |
| 80207 | OPA3 | LZE4T | Human | Esophagus | ESCC | 4.75e-06 | 2.45e-01 | 0.0811 |
| 80207 | OPA3 | LZE7T | Human | Esophagus | ESCC | 5.86e-03 | 2.49e-01 | 0.0667 |
| 80207 | OPA3 | LZE21D1 | Human | Esophagus | HGIN | 7.92e-03 | 1.93e-01 | 0.0632 |
| 80207 | OPA3 | LZE24T | Human | Esophagus | ESCC | 2.90e-05 | 1.00e-01 | 0.0596 |
| 80207 | OPA3 | P1T-E | Human | Esophagus | ESCC | 1.34e-02 | 2.06e-01 | 0.0875 |
| 80207 | OPA3 | P2T-E | Human | Esophagus | ESCC | 3.07e-11 | 2.01e-01 | 0.1177 |
| 80207 | OPA3 | P4T-E | Human | Esophagus | ESCC | 6.74e-12 | 2.38e-01 | 0.1323 |
| 80207 | OPA3 | P5T-E | Human | Esophagus | ESCC | 9.27e-09 | 2.62e-01 | 0.1327 |
| 80207 | OPA3 | P8T-E | Human | Esophagus | ESCC | 2.83e-19 | 3.60e-01 | 0.0889 |
| 80207 | OPA3 | P9T-E | Human | Esophagus | ESCC | 6.05e-08 | 1.93e-01 | 0.1131 |
| 80207 | OPA3 | P10T-E | Human | Esophagus | ESCC | 1.12e-20 | 4.51e-01 | 0.116 |
| 80207 | OPA3 | P11T-E | Human | Esophagus | ESCC | 5.70e-09 | 2.45e-01 | 0.1426 |
| 80207 | OPA3 | P12T-E | Human | Esophagus | ESCC | 4.60e-16 | 2.38e-01 | 0.1122 |
| 80207 | OPA3 | P15T-E | Human | Esophagus | ESCC | 5.28e-15 | 2.96e-01 | 0.1149 |
| 80207 | OPA3 | P16T-E | Human | Esophagus | ESCC | 8.45e-04 | 6.89e-02 | 0.1153 |
| 80207 | OPA3 | P17T-E | Human | Esophagus | ESCC | 3.91e-02 | 2.03e-01 | 0.1278 |
| 80207 | OPA3 | P20T-E | Human | Esophagus | ESCC | 2.07e-19 | 2.21e-01 | 0.1124 |
| 80207 | OPA3 | P21T-E | Human | Esophagus | ESCC | 2.36e-09 | 1.26e-01 | 0.1617 |
| 80207 | OPA3 | P22T-E | Human | Esophagus | ESCC | 1.17e-08 | 1.99e-01 | 0.1236 |
| 80207 | OPA3 | P23T-E | Human | Esophagus | ESCC | 5.56e-17 | 3.34e-01 | 0.108 |
| Page: 1 2 3 4 |
| Tissue | Expression Dynamics | Abbreviation |
| Esophagus |  | ESCC: Esophageal squamous cell carcinoma |
| HGIN: High-grade intraepithelial neoplasias | ||
| LGIN: Low-grade intraepithelial neoplasias | ||
| Liver | 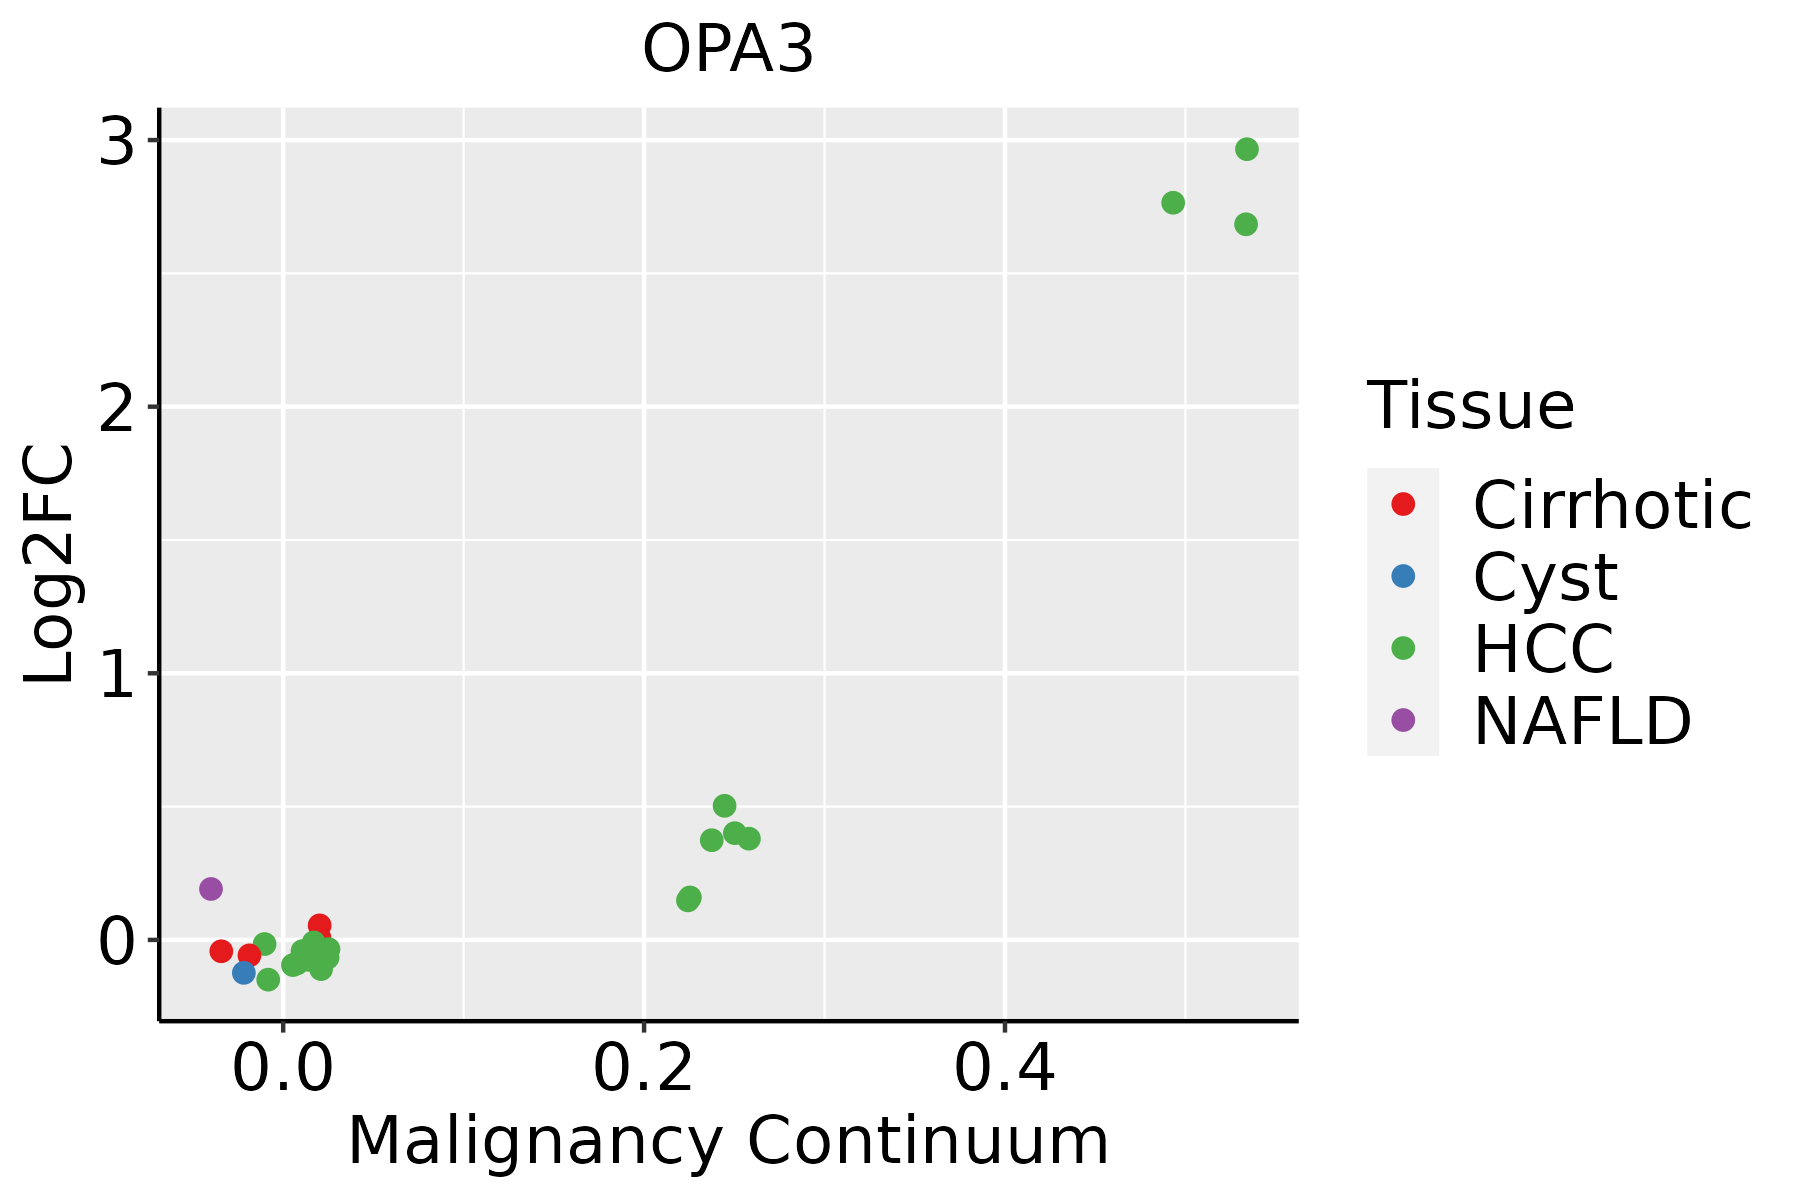 | HCC: Hepatocellular carcinoma |
| NAFLD: Non-alcoholic fatty liver disease |
| ∗log2FC in expression of this searched gene in stem-like cells from each diseased tissue sample relative to stem-like cells in normal samples in each tissue plotted against the malignancy continuum. Samples are colored based on if they are from different disease stage. |
Top |
Malignant transformation related pathway analysis |
| Find out the enriched GO biological processes and KEGG pathways involved in transition from healthy to precancer to cancer |
| Tissue | Disease Stage | Enriched GO biological Processes |
| Colorectum | AD |  |
| Colorectum | SER |  |
| Colorectum | MSS |  |
| Colorectum | MSI-H |  |
| Colorectum | FAP |  |
| ∗Top 15 enriched GO BP terms are showed in the bar plot of each disease state in each tissue. Each row represents a significant GO biological process which is colored according to the -log10(p.adjust). |
| Page: 1 2 3 4 5 6 7 8 9 |
| GO ID | Tissue | Disease Stage | Description | Gene Ratio | Bg Ratio | pvalue | p.adjust | Count |
| GO:00192168 | Esophagus | ESCC | regulation of lipid metabolic process | 172/8552 | 331/18723 | 1.20e-02 | 4.02e-02 | 172 |
| GO:00192162 | Liver | HCC | regulation of lipid metabolic process | 181/7958 | 331/18723 | 4.58e-06 | 5.79e-05 | 181 |
| Page: 1 |
| Pathway ID | Tissue | Disease Stage | Description | Gene Ratio | Bg Ratio | pvalue | p.adjust | qvalue | Count |
| Page: 1 |
Top |
Cell-cell communication analysis |
| Identification of potential cell-cell interactions between two cell types and their ligand-receptor pairs for different disease states |
| Ligand | Receptor | LRpair | Pathway | Tissue | Disease Stage |
| Page: 1 |
Top |
Single-cell gene regulatory network inference analysis |
| Find out the significant the regulons (TFs) and the target genes of each regulon across cell types for different disease states |
| TF | Cell Type | Tissue | Disease Stage | Target Gene | RSS | Regulon Activity |
| ∗The dot plots of a searched regulon are shown for all cell subpopulations in each disease state of each tissue based on the regulon specific score inferred using pySCENIC and by calculating the average expression. |
| Page: 1 |
Top |
Somatic mutation of malignant transformation related genes |
| Annotation of somatic variants for genes involved in malignant transformation |
| Hugo Symbol | Variant Class | Variant Classification | dbSNP RS | HGVSc | HGVSp | HGVSp Short | SWISSPROT | BIOTYPE | SIFT | PolyPhen | Tumor Sample Barcode | Tissue | Histology | Sex | Age | Stage | Therapy Types | Drugs | Outcome |
| OPA3 | SNV | Missense_Mutation | c.232N>A | p.Glu78Lys | p.E78K | Q9H6K4 | protein_coding | deleterious(0) | probably_damaging(0.946) | TCGA-A2-A0EY-01 | Breast | breast invasive carcinoma | Female | <65 | I/II | Chemotherapy | adriamycin | SD | |
| OPA3 | SNV | Missense_Mutation | c.329N>A | p.Arg110His | p.R110H | Q9H6K4 | protein_coding | tolerated(0.49) | benign(0.007) | TCGA-CK-4951-01 | Colorectum | colon adenocarcinoma | Female | >=65 | I/II | Unknown | Unknown | PD | |
| OPA3 | SNV | Missense_Mutation | novel | c.133C>T | p.Pro45Ser | p.P45S | Q9H6K4 | protein_coding | deleterious(0.01) | probably_damaging(0.999) | TCGA-A5-A0G2-01 | Endometrium | uterine corpus endometrioid carcinoma | Female | <65 | III/IV | Unknown | Unknown | SD |
| OPA3 | SNV | Missense_Mutation | novel | c.307C>T | p.Arg103Cys | p.R103C | Q9H6K4 | protein_coding | deleterious(0) | probably_damaging(0.999) | TCGA-AP-A1DM-01 | Endometrium | uterine corpus endometrioid carcinoma | Female | <65 | I/II | Unknown | Unknown | SD |
| OPA3 | SNV | Missense_Mutation | novel | c.89N>T | p.Ala30Val | p.A30V | Q9H6K4 | protein_coding | tolerated(0.27) | possibly_damaging(0.742) | TCGA-AX-A1C4-01 | Endometrium | uterine corpus endometrioid carcinoma | Female | <65 | I/II | Unknown | Unknown | SD |
| OPA3 | SNV | Missense_Mutation | novel | c.185N>A | p.Gly62Asp | p.G62D | Q9H6K4 | protein_coding | deleterious(0.01) | probably_damaging(1) | TCGA-DI-A1BU-01 | Endometrium | uterine corpus endometrioid carcinoma | Female | <65 | I/II | Chemotherapy | paclitaxel | SD |
| OPA3 | SNV | Missense_Mutation | novel | c.149N>G | p.His50Arg | p.H50R | Q9H6K4 | protein_coding | deleterious(0) | probably_damaging(0.997) | TCGA-EO-A22R-01 | Endometrium | uterine corpus endometrioid carcinoma | Female | <65 | I/II | Unknown | Unknown | SD |
| OPA3 | SNV | Missense_Mutation | novel | c.114N>T | p.Lys38Asn | p.K38N | Q9H6K4 | protein_coding | deleterious(0.04) | probably_damaging(0.935) | TCGA-EO-A22R-01 | Endometrium | uterine corpus endometrioid carcinoma | Female | <65 | I/II | Unknown | Unknown | SD |
| OPA3 | SNV | Missense_Mutation | novel | c.204N>G | p.Ile68Met | p.I68M | Q9H6K4 | protein_coding | deleterious(0.01) | possibly_damaging(0.778) | TCGA-2Y-A9H3-01 | Liver | liver hepatocellular carcinoma | Male | <65 | I/II | Unknown | Unknown | PD |
| OPA3 | SNV | Missense_Mutation | c.270C>A | p.Phe90Leu | p.F90L | Q9H6K4 | protein_coding | deleterious(0) | probably_damaging(0.995) | TCGA-DD-A73A-01 | Liver | liver hepatocellular carcinoma | Male | >=65 | I/II | Unknown | Unknown | SD |
| Page: 1 2 |
Top |
Related drugs of malignant transformation related genes |
| Identification of chemicals and drugs interact with genes involved in malignant transfromation |
| (DGIdb 4.0) |
| Entrez ID | Symbol | Category | Interaction Types | Drug Claim Name | Drug Name | PMIDs |
| Page: 1 |

Copyright 2023-Present -The University of Texas Health Science Center at Houston |