
|
|||||
|
 | |
| |
| |
| |
| |
| |
|
Gene: OPA1 |
Gene summary for OPA1 |
| Gene information | Species | Human | Gene symbol | OPA1 | Gene ID | 4976 |
| Gene name | OPA1 mitochondrial dynamin like GTPase | |
| Gene Alias | BERHS | |
| Cytomap | 3q29 | |
| Gene Type | protein-coding | GO ID | GO:0000002 | UniProtAcc | O60313 |
Top |
Malignant transformation analysis |
| Identification of the aberrant gene expression in precancerous and cancerous lesions by comparing the gene expression of stem-like cells in diseased tissues with normal stem cells |
| Entrez ID | Symbol | Replicates | Species | Organ | Tissue | Adj P-value | Log2FC | Malignancy |
| 4976 | OPA1 | CCI_2 | Human | Cervix | CC | 5.47e-13 | 1.44e+00 | 0.5249 |
| 4976 | OPA1 | CCI_3 | Human | Cervix | CC | 1.68e-18 | 1.10e+00 | 0.516 |
| 4976 | OPA1 | HTA11_3410_2000001011 | Human | Colorectum | AD | 7.04e-12 | -4.80e-01 | 0.0155 |
| 4976 | OPA1 | HTA11_2487_2000001011 | Human | Colorectum | SER | 4.07e-05 | -4.14e-01 | -0.1808 |
| 4976 | OPA1 | HTA11_3361_2000001011 | Human | Colorectum | AD | 1.15e-03 | -4.87e-01 | -0.1207 |
| 4976 | OPA1 | HTA11_696_2000001011 | Human | Colorectum | AD | 3.80e-06 | -3.16e-01 | -0.1464 |
| 4976 | OPA1 | HTA11_866_2000001011 | Human | Colorectum | AD | 3.74e-03 | -3.29e-01 | -0.1001 |
| 4976 | OPA1 | HTA11_5212_2000001011 | Human | Colorectum | AD | 4.86e-02 | -3.72e-01 | -0.2061 |
| 4976 | OPA1 | HTA11_7862_2000001011 | Human | Colorectum | AD | 8.06e-03 | -5.56e-01 | -0.0179 |
| 4976 | OPA1 | HTA11_866_3004761011 | Human | Colorectum | AD | 2.40e-08 | -5.15e-01 | 0.096 |
| 4976 | OPA1 | HTA11_10711_2000001011 | Human | Colorectum | AD | 4.92e-05 | -4.43e-01 | 0.0338 |
| 4976 | OPA1 | HTA11_7696_3000711011 | Human | Colorectum | AD | 7.45e-07 | -4.32e-01 | 0.0674 |
| 4976 | OPA1 | HTA11_6818_2000001021 | Human | Colorectum | AD | 1.21e-04 | -5.01e-01 | 0.0588 |
| 4976 | OPA1 | HTA11_99999970781_79442 | Human | Colorectum | MSS | 4.67e-07 | -3.20e-01 | 0.294 |
| 4976 | OPA1 | HTA11_99999971662_82457 | Human | Colorectum | MSS | 6.02e-12 | -4.16e-01 | 0.3859 |
| 4976 | OPA1 | HTA11_99999973899_84307 | Human | Colorectum | MSS | 8.42e-05 | -6.14e-01 | 0.2585 |
| 4976 | OPA1 | HTA11_99999974143_84620 | Human | Colorectum | MSS | 1.79e-17 | -5.18e-01 | 0.3005 |
| 4976 | OPA1 | F007 | Human | Colorectum | FAP | 6.91e-06 | -4.28e-01 | 0.1176 |
| 4976 | OPA1 | A001-C-207 | Human | Colorectum | FAP | 8.03e-07 | -3.88e-01 | 0.1278 |
| 4976 | OPA1 | A015-C-203 | Human | Colorectum | FAP | 3.25e-32 | -4.97e-01 | -0.1294 |
| Page: 1 2 3 4 5 6 7 8 9 |
| Tissue | Expression Dynamics | Abbreviation |
| Cervix |  | CC: Cervix cancer |
| HSIL_HPV: HPV-infected high-grade squamous intraepithelial lesions | ||
| N_HPV: HPV-infected normal cervix | ||
| Colorectum (GSE201348) |  | FAP: Familial adenomatous polyposis |
| CRC: Colorectal cancer | ||
| Colorectum (HTA11) |  | AD: Adenomas |
| SER: Sessile serrated lesions | ||
| MSI-H: Microsatellite-high colorectal cancer | ||
| MSS: Microsatellite stable colorectal cancer | ||
| Esophagus | 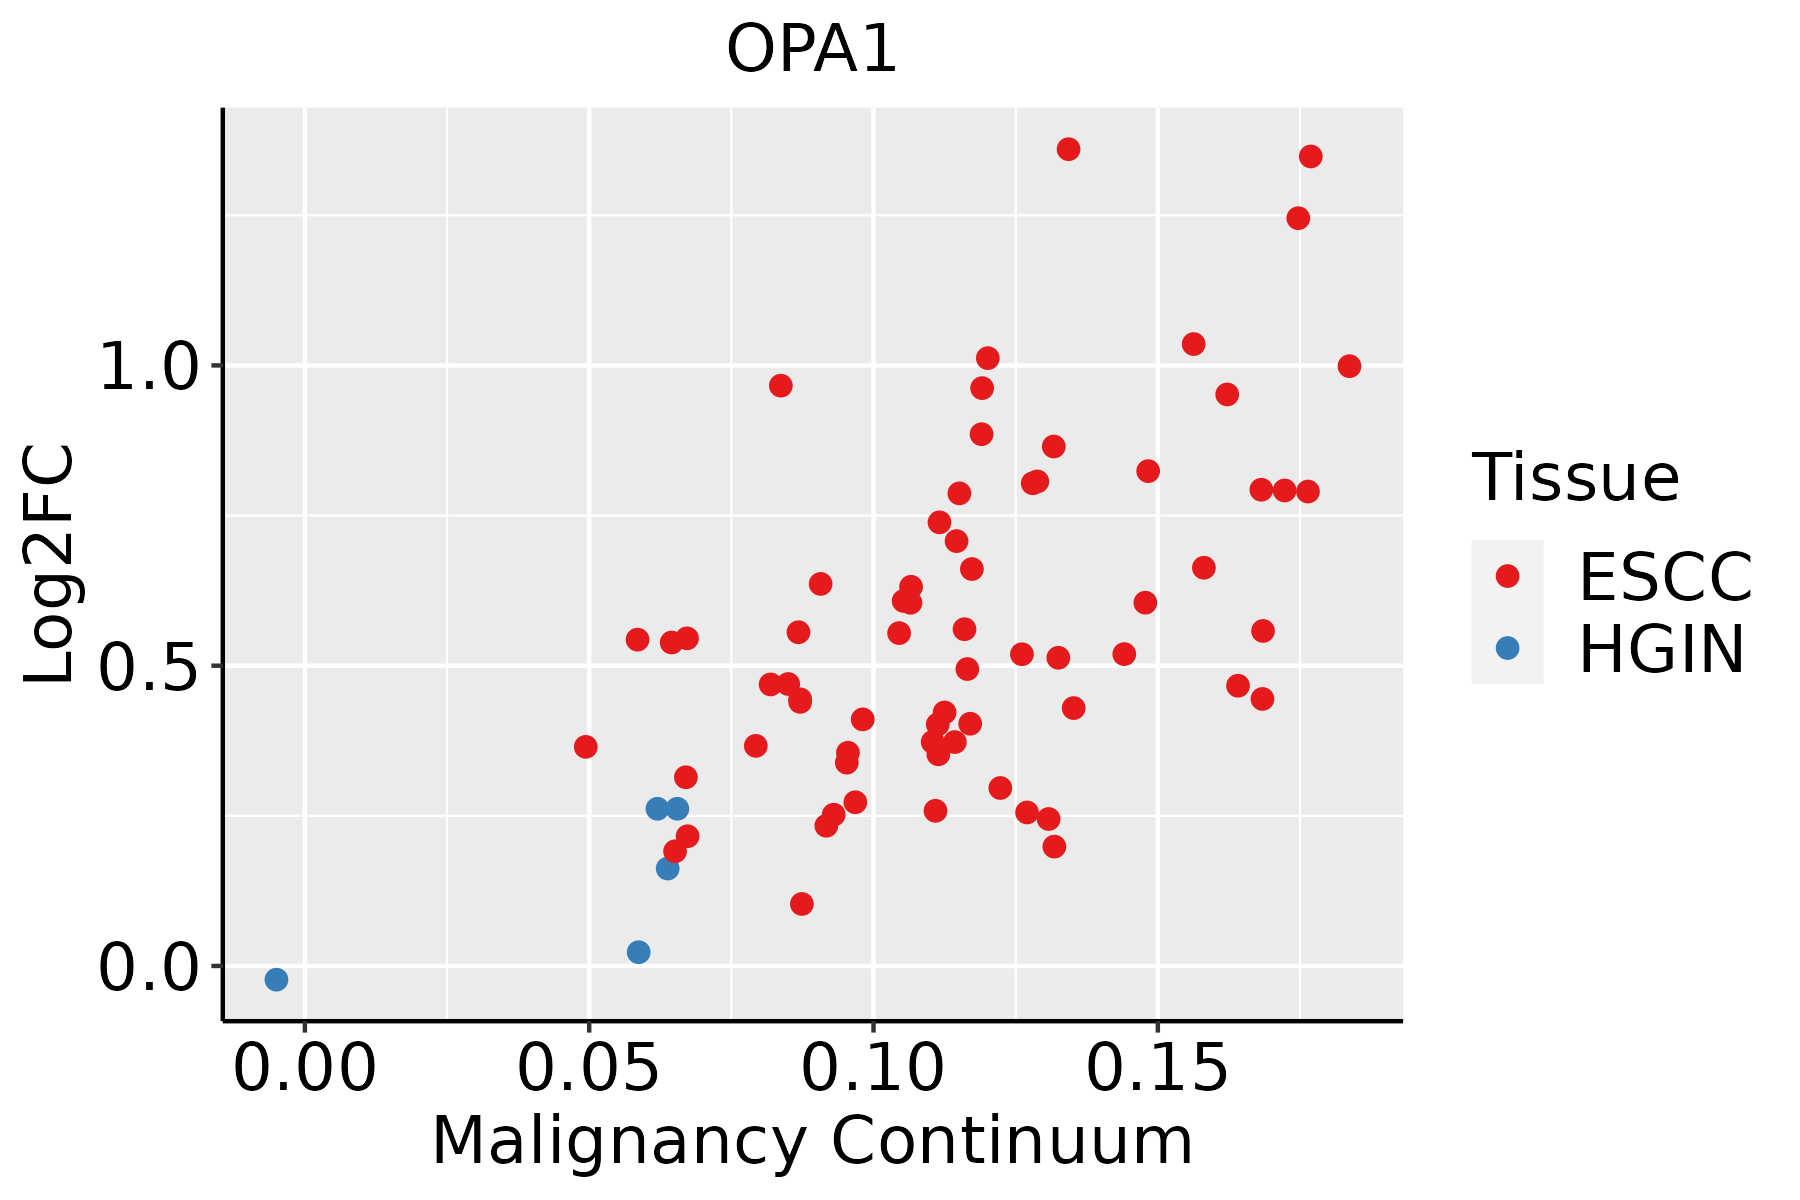 | ESCC: Esophageal squamous cell carcinoma |
| HGIN: High-grade intraepithelial neoplasias | ||
| LGIN: Low-grade intraepithelial neoplasias | ||
| Liver | 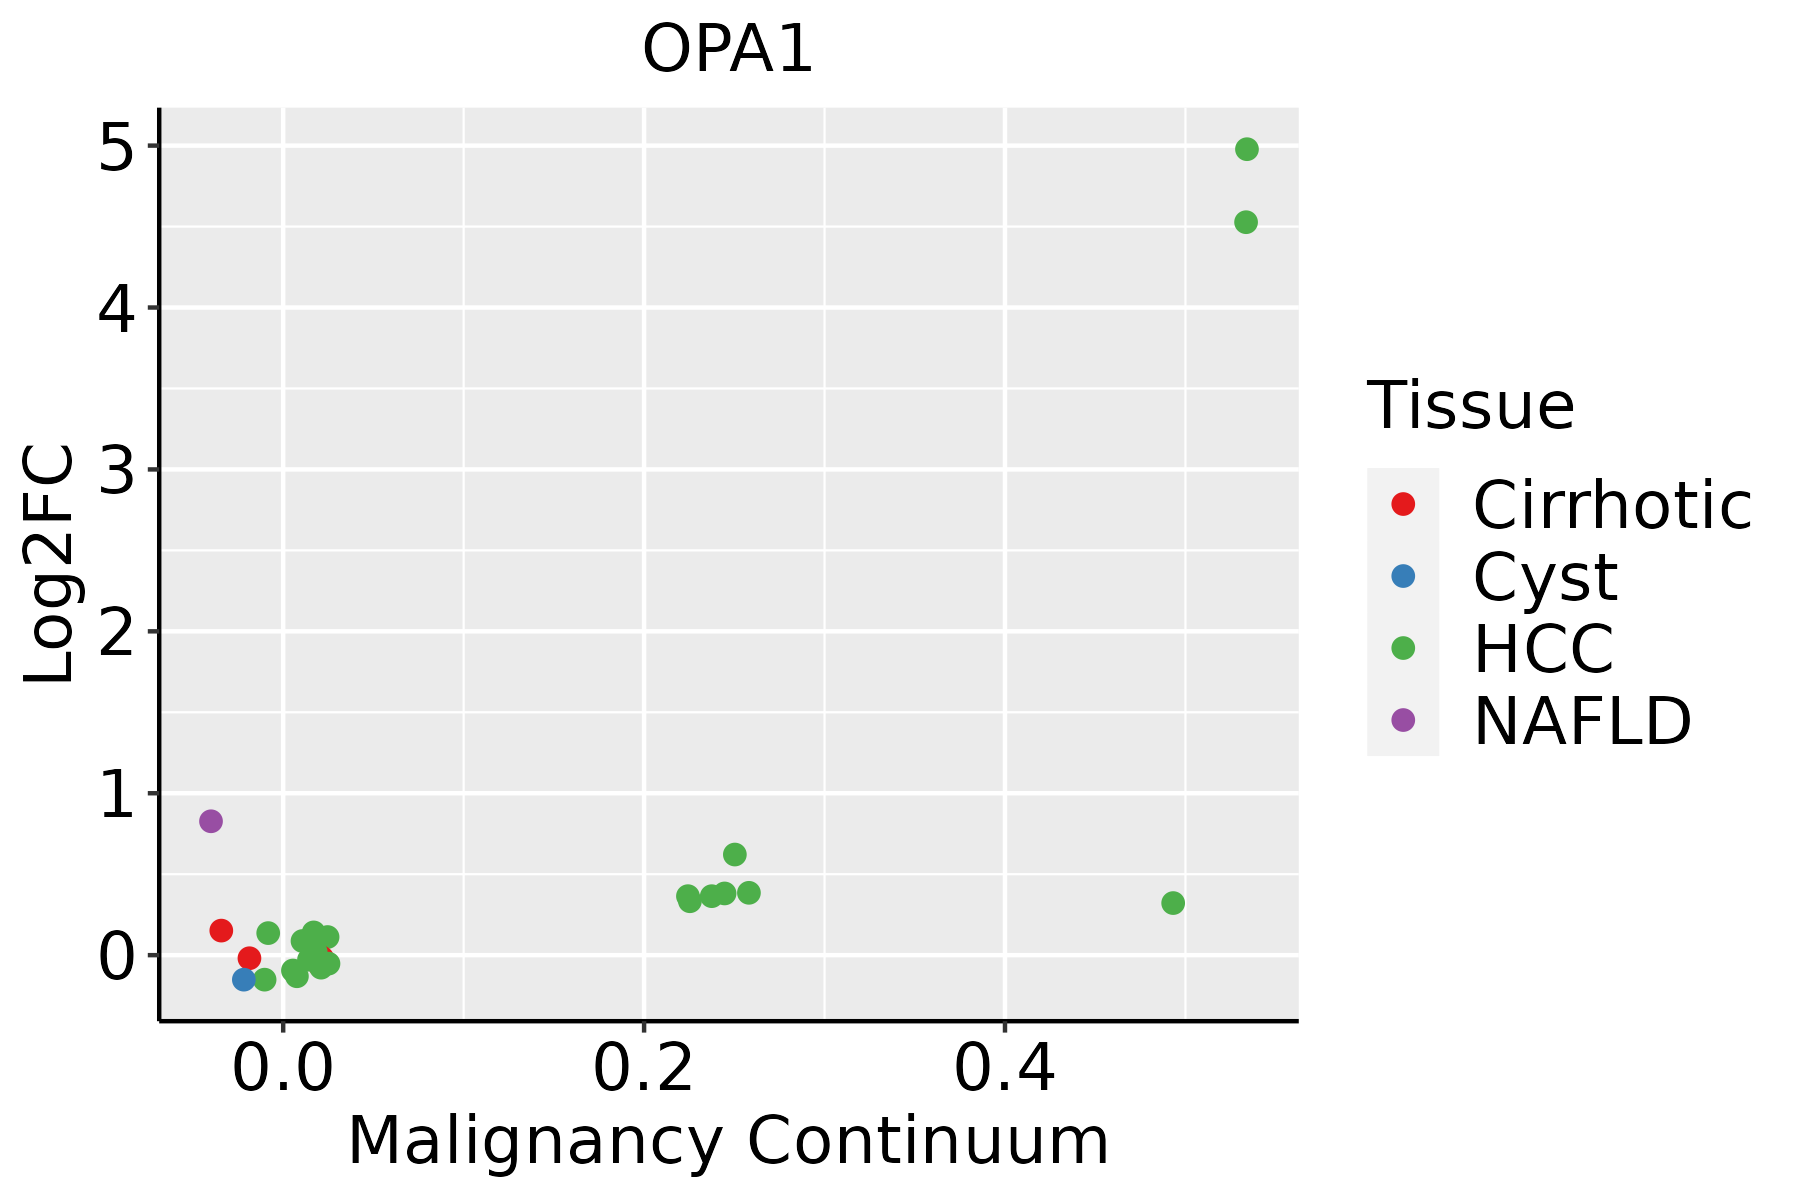 | HCC: Hepatocellular carcinoma |
| NAFLD: Non-alcoholic fatty liver disease | ||
| Oral Cavity | 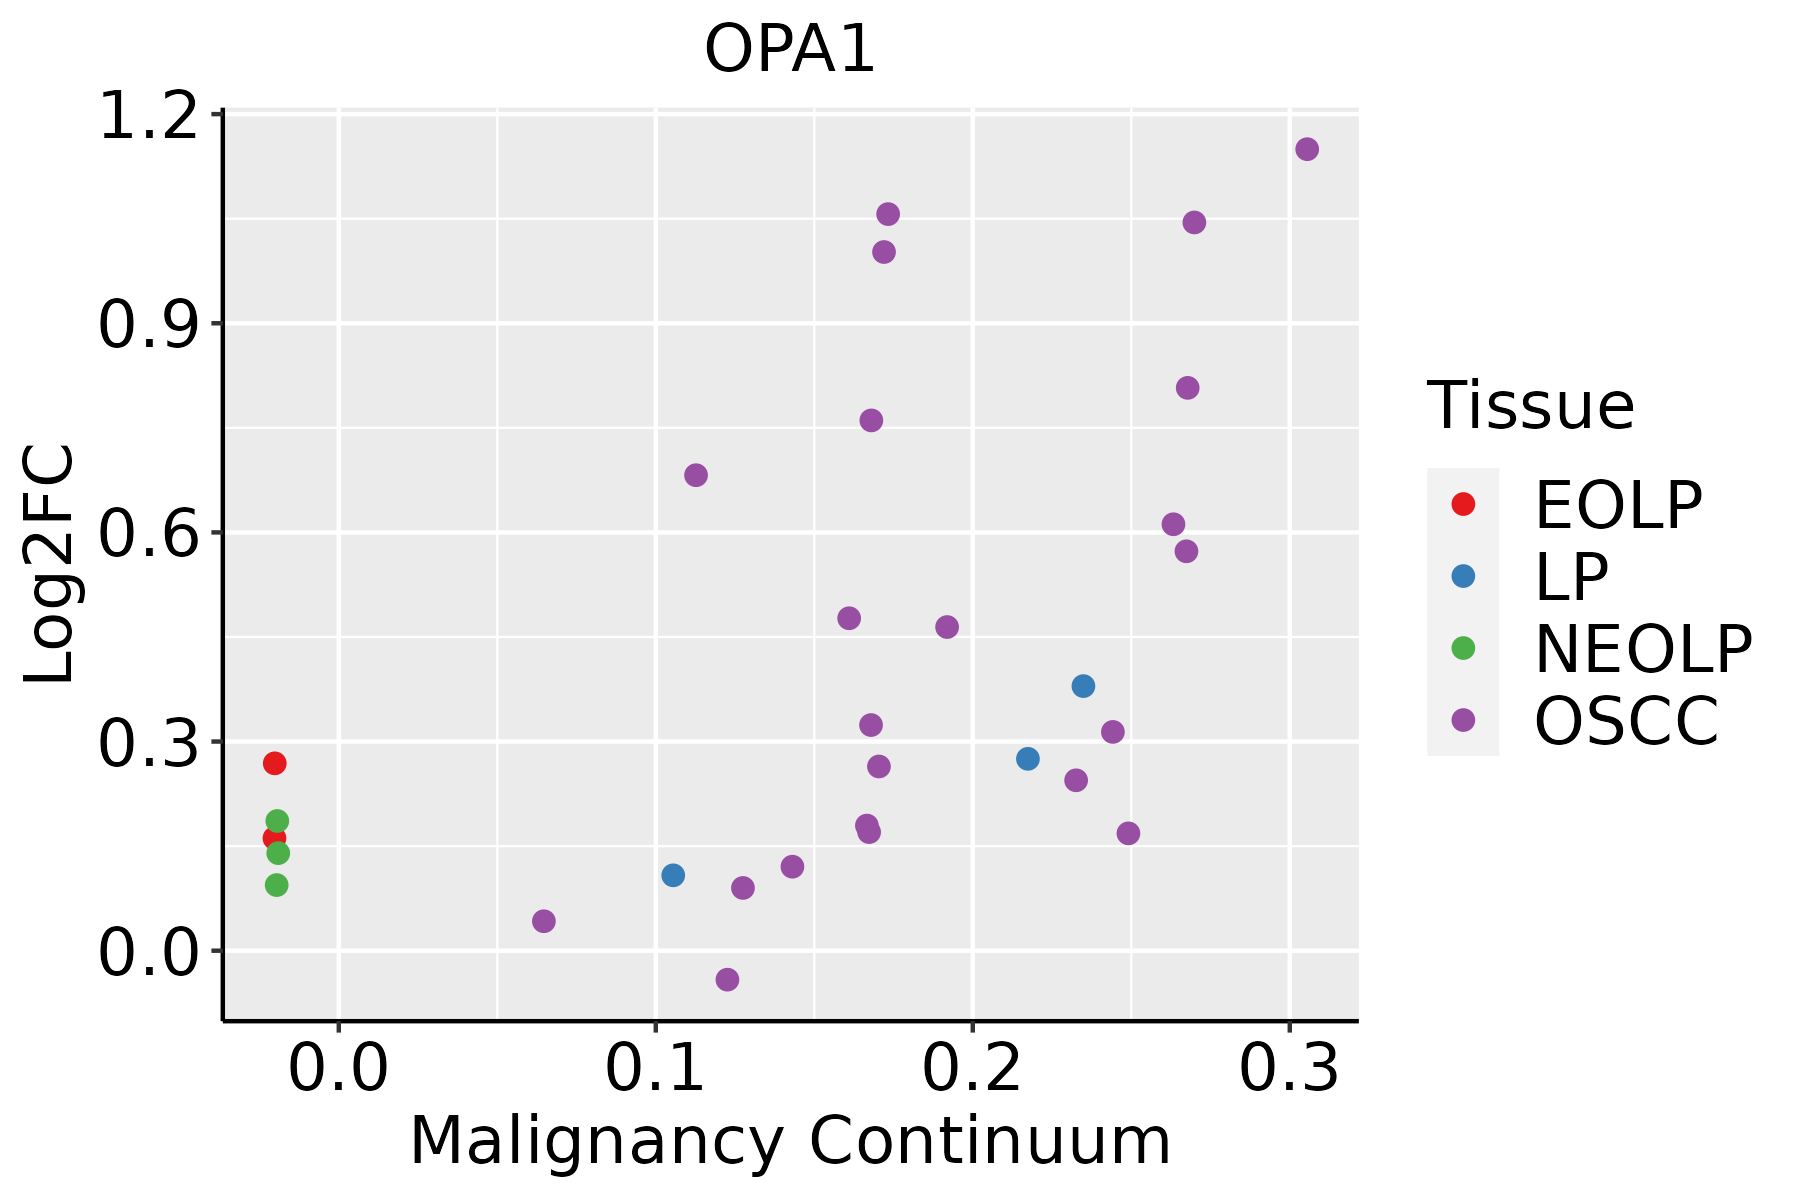 | EOLP: Erosive Oral lichen planus |
| LP: leukoplakia | ||
| NEOLP: Non-erosive oral lichen planus | ||
| OSCC: Oral squamous cell carcinoma | ||
| Skin | 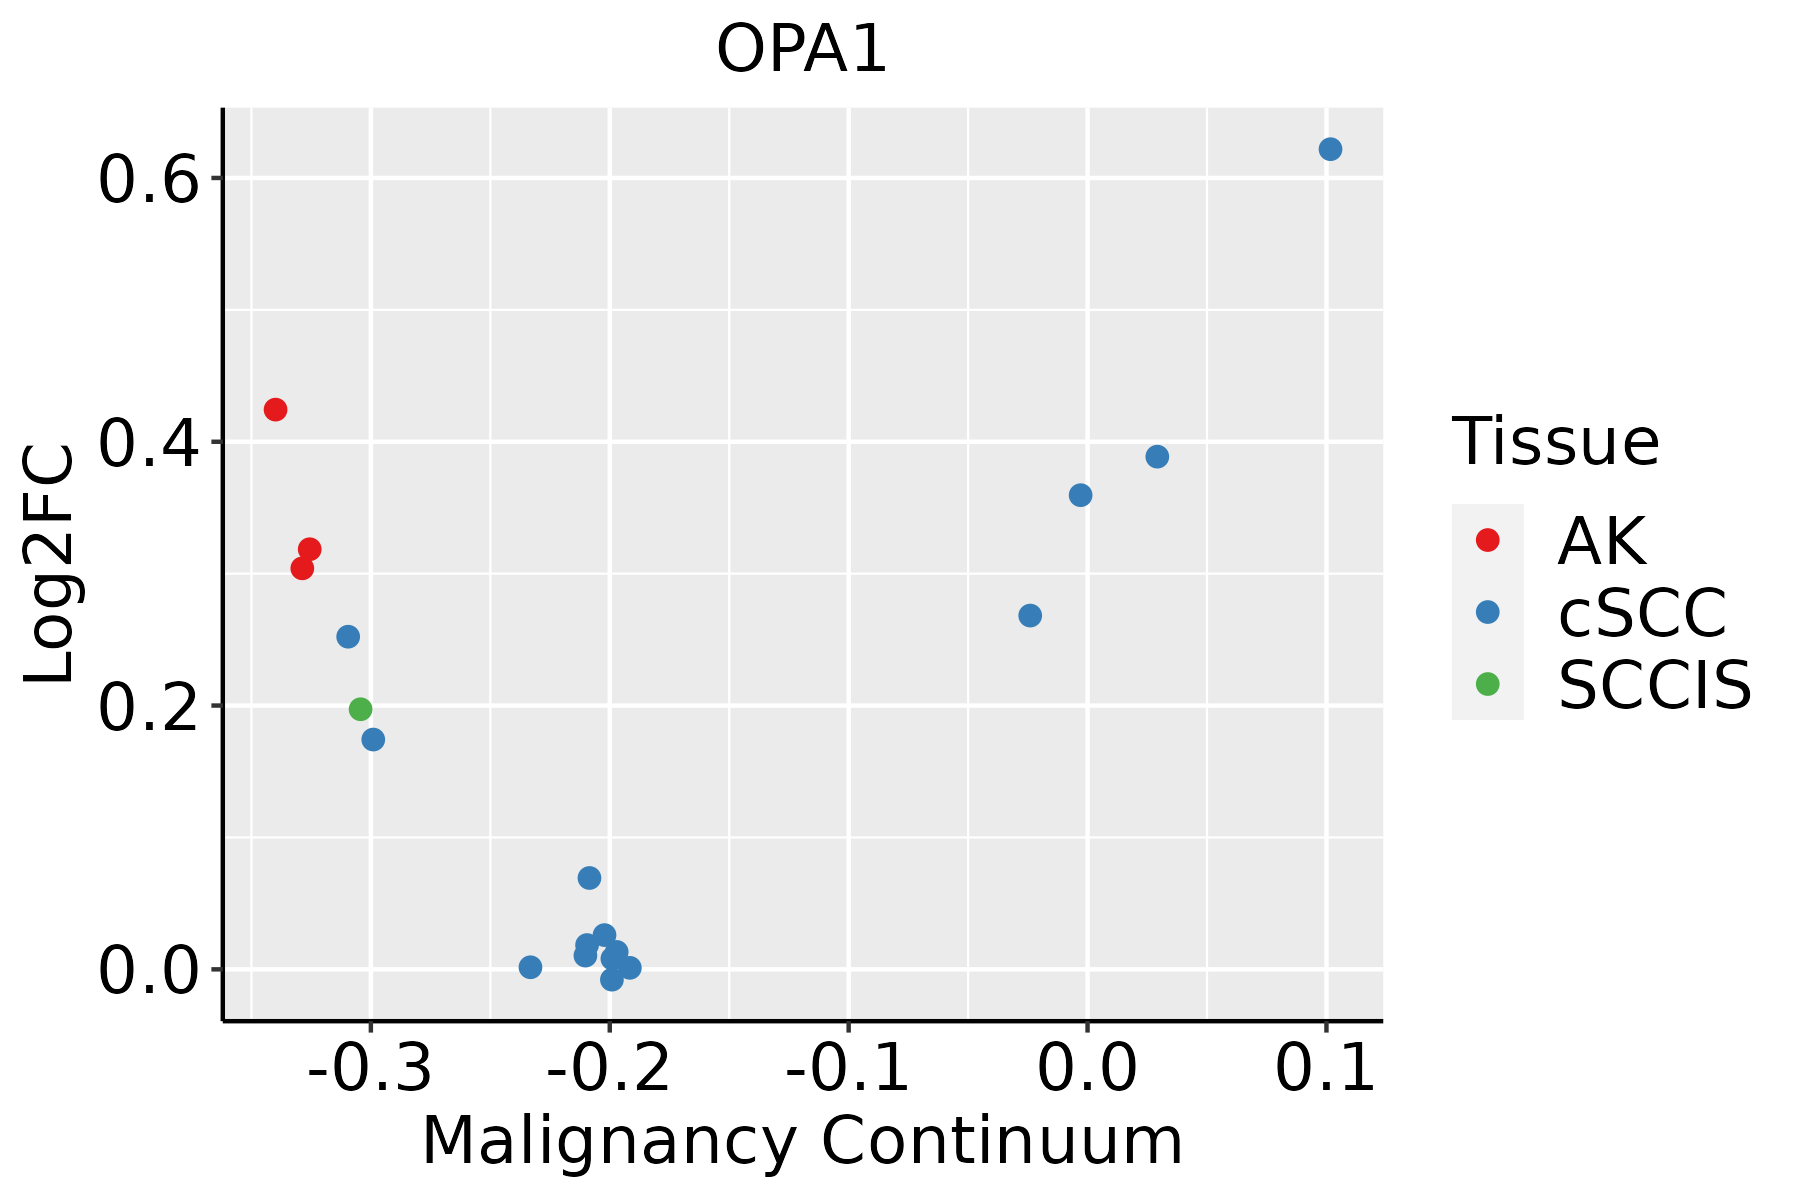 | AK: Actinic keratosis |
| cSCC: Cutaneous squamous cell carcinoma | ||
| SCCIS:squamous cell carcinoma in situ | ||
| Thyroid | 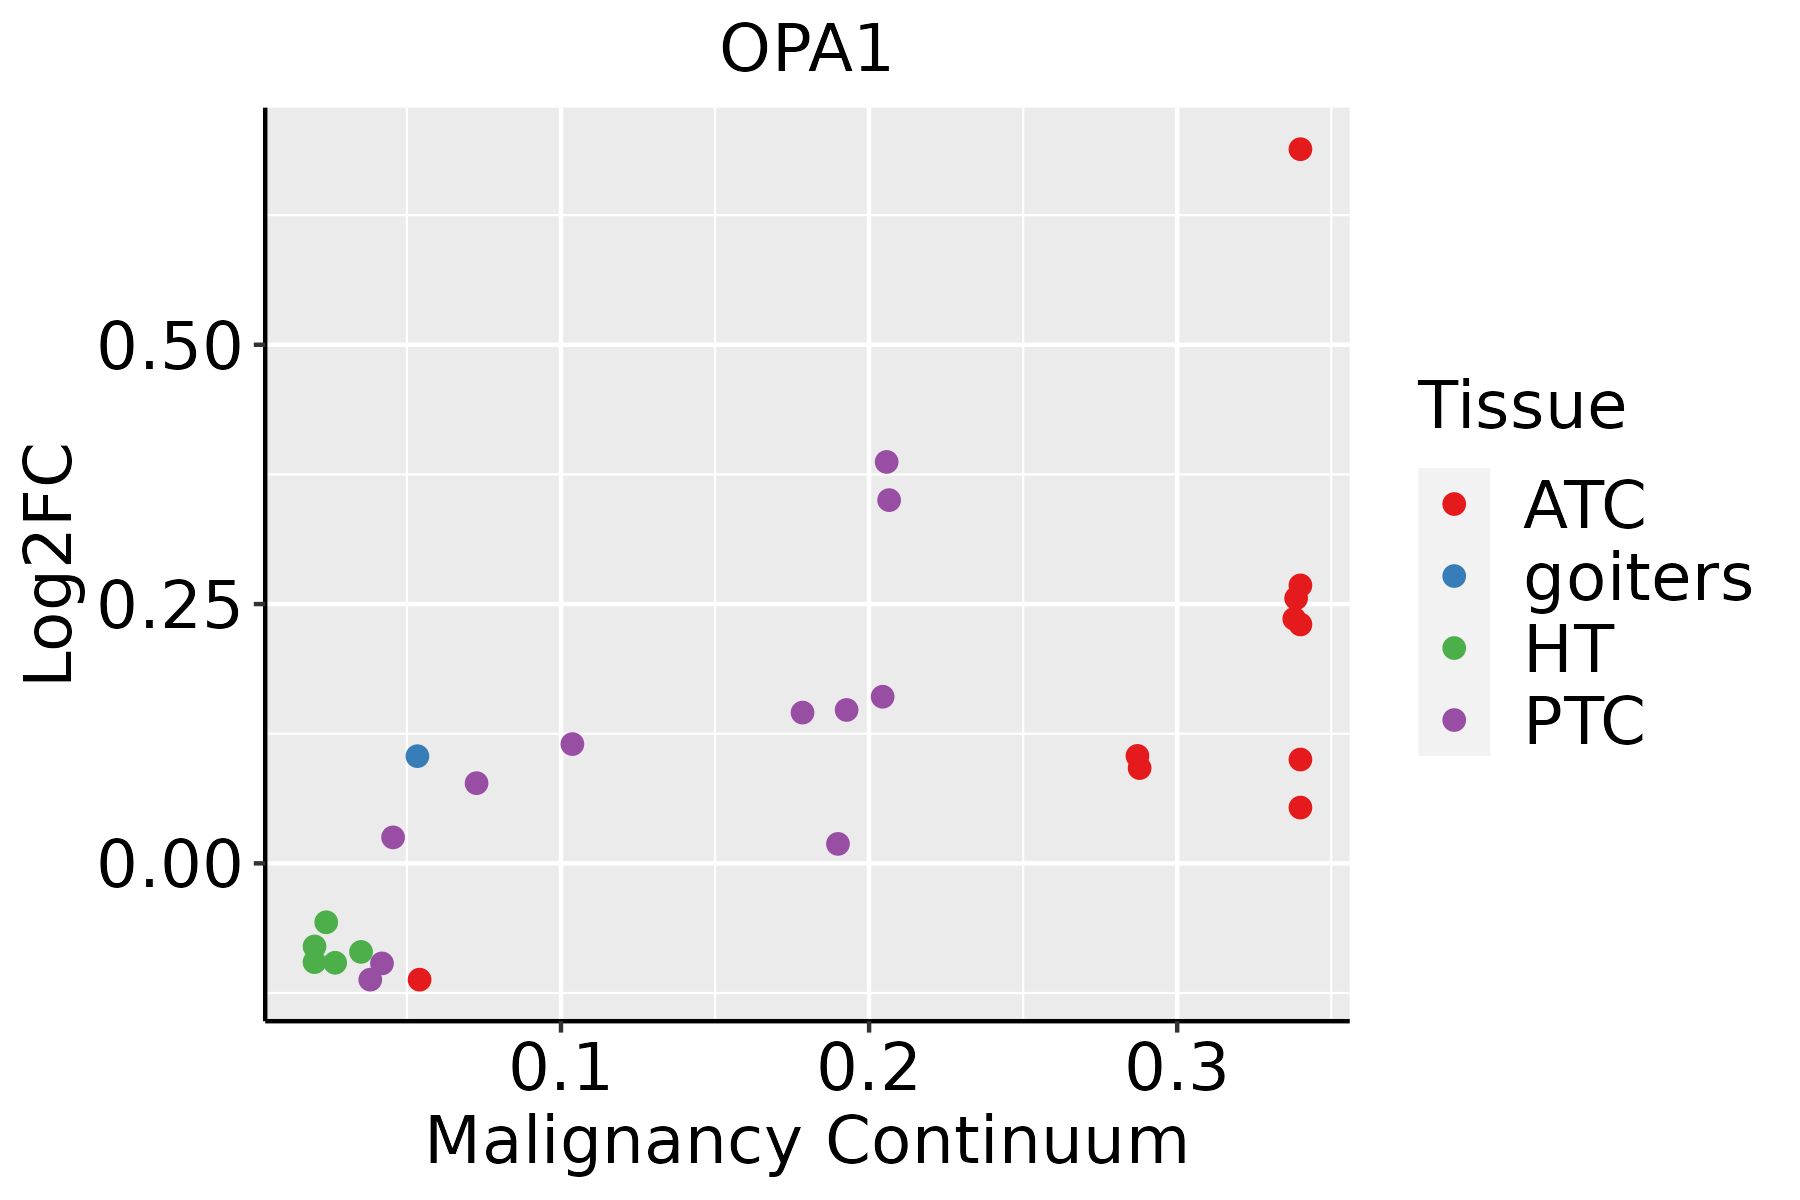 | ATC: Anaplastic thyroid cancer |
| HT: Hashimoto's thyroiditis | ||
| PTC: Papillary thyroid cancer |
| ∗log2FC in expression of this searched gene in stem-like cells from each diseased tissue sample relative to stem-like cells in normal samples in each tissue plotted against the malignancy continuum. Samples are colored based on if they are from different disease stage. |
Top |
Malignant transformation related pathway analysis |
| Find out the enriched GO biological processes and KEGG pathways involved in transition from healthy to precancer to cancer |
| Tissue | Disease Stage | Enriched GO biological Processes |
| Colorectum | AD |  |
| Colorectum | SER |  |
| Colorectum | MSS |  |
| Colorectum | MSI-H |  |
| Colorectum | FAP |  |
| ∗Top 15 enriched GO BP terms are showed in the bar plot of each disease state in each tissue. Each row represents a significant GO biological process which is colored according to the -log10(p.adjust). |
| Page: 1 2 3 4 5 6 7 8 9 |
| GO ID | Tissue | Disease Stage | Description | Gene Ratio | Bg Ratio | pvalue | p.adjust | Count |
| GO:009719310 | Cervix | CC | intrinsic apoptotic signaling pathway | 85/2311 | 288/18723 | 4.56e-15 | 6.46e-12 | 85 |
| GO:200123310 | Cervix | CC | regulation of apoptotic signaling pathway | 96/2311 | 356/18723 | 4.08e-14 | 3.05e-11 | 96 |
| GO:002260410 | Cervix | CC | regulation of cell morphogenesis | 84/2311 | 309/18723 | 1.00e-12 | 4.29e-10 | 84 |
| GO:200124210 | Cervix | CC | regulation of intrinsic apoptotic signaling pathway | 52/2311 | 164/18723 | 5.06e-11 | 1.01e-08 | 52 |
| GO:200123410 | Cervix | CC | negative regulation of apoptotic signaling pathway | 56/2311 | 224/18723 | 1.39e-07 | 6.70e-06 | 56 |
| GO:00107699 | Cervix | CC | regulation of cell morphogenesis involved in differentiation | 31/2311 | 96/18723 | 2.43e-07 | 1.05e-05 | 31 |
| GO:00075689 | Cervix | CC | aging | 75/2311 | 339/18723 | 2.75e-07 | 1.13e-05 | 75 |
| GO:00091449 | Cervix | CC | purine nucleoside triphosphate metabolic process | 29/2311 | 88/18723 | 3.62e-07 | 1.45e-05 | 29 |
| GO:00068399 | Cervix | CC | mitochondrial transport | 60/2311 | 254/18723 | 4.21e-07 | 1.67e-05 | 60 |
| GO:00163587 | Cervix | CC | dendrite development | 58/2311 | 243/18723 | 4.52e-07 | 1.76e-05 | 58 |
| GO:00092058 | Cervix | CC | purine ribonucleoside triphosphate metabolic process | 27/2311 | 82/18723 | 9.24e-07 | 3.25e-05 | 27 |
| GO:190589710 | Cervix | CC | regulation of response to endoplasmic reticulum stress | 27/2311 | 82/18723 | 9.24e-07 | 3.25e-05 | 27 |
| GO:00091998 | Cervix | CC | ribonucleoside triphosphate metabolic process | 28/2311 | 89/18723 | 1.65e-06 | 5.44e-05 | 28 |
| GO:00109757 | Cervix | CC | regulation of neuron projection development | 88/2311 | 445/18723 | 4.26e-06 | 1.09e-04 | 88 |
| GO:00107206 | Cervix | CC | positive regulation of cell development | 64/2311 | 298/18723 | 5.69e-06 | 1.41e-04 | 64 |
| GO:003166710 | Cervix | CC | response to nutrient levels | 92/2311 | 474/18723 | 5.80e-06 | 1.42e-04 | 92 |
| GO:003497610 | Cervix | CC | response to endoplasmic reticulum stress | 57/2311 | 256/18723 | 5.81e-06 | 1.42e-04 | 57 |
| GO:190357310 | Cervix | CC | negative regulation of response to endoplasmic reticulum stress | 17/2311 | 44/18723 | 8.57e-06 | 1.97e-04 | 17 |
| GO:00091419 | Cervix | CC | nucleoside triphosphate metabolic process | 31/2311 | 112/18723 | 9.38e-06 | 2.11e-04 | 31 |
| GO:00313467 | Cervix | CC | positive regulation of cell projection organization | 72/2311 | 353/18723 | 1.04e-05 | 2.32e-04 | 72 |
| Page: 1 2 3 4 5 6 7 8 9 10 11 12 13 14 15 16 17 18 19 20 21 22 23 24 25 26 27 28 29 30 31 32 33 34 35 36 37 38 39 40 41 42 43 44 45 46 47 48 49 50 51 52 53 54 55 56 57 58 59 60 61 62 63 64 65 66 67 68 69 70 71 72 73 74 75 |
| Pathway ID | Tissue | Disease Stage | Description | Gene Ratio | Bg Ratio | pvalue | p.adjust | qvalue | Count |
| hsa0501716 | Cervix | CC | Spinocerebellar ataxia | 35/1267 | 143/8465 | 1.77e-03 | 7.21e-03 | 4.26e-03 | 35 |
| hsa0501717 | Cervix | CC | Spinocerebellar ataxia | 35/1267 | 143/8465 | 1.77e-03 | 7.21e-03 | 4.26e-03 | 35 |
| hsa05017 | Colorectum | AD | Spinocerebellar ataxia | 60/2092 | 143/8465 | 3.78e-06 | 4.35e-05 | 2.78e-05 | 60 |
| hsa050171 | Colorectum | AD | Spinocerebellar ataxia | 60/2092 | 143/8465 | 3.78e-06 | 4.35e-05 | 2.78e-05 | 60 |
| hsa050172 | Colorectum | SER | Spinocerebellar ataxia | 46/1580 | 143/8465 | 6.78e-05 | 7.51e-04 | 5.45e-04 | 46 |
| hsa050173 | Colorectum | SER | Spinocerebellar ataxia | 46/1580 | 143/8465 | 6.78e-05 | 7.51e-04 | 5.45e-04 | 46 |
| hsa050174 | Colorectum | MSS | Spinocerebellar ataxia | 60/1875 | 143/8465 | 7.14e-08 | 1.26e-06 | 7.71e-07 | 60 |
| hsa050175 | Colorectum | MSS | Spinocerebellar ataxia | 60/1875 | 143/8465 | 7.14e-08 | 1.26e-06 | 7.71e-07 | 60 |
| hsa050178 | Colorectum | FAP | Spinocerebellar ataxia | 37/1404 | 143/8465 | 2.94e-03 | 1.29e-02 | 7.86e-03 | 37 |
| hsa050179 | Colorectum | FAP | Spinocerebellar ataxia | 37/1404 | 143/8465 | 2.94e-03 | 1.29e-02 | 7.86e-03 | 37 |
| hsa0501727 | Esophagus | HGIN | Spinocerebellar ataxia | 43/1383 | 143/8465 | 2.68e-05 | 3.64e-04 | 2.89e-04 | 43 |
| hsa05017112 | Esophagus | HGIN | Spinocerebellar ataxia | 43/1383 | 143/8465 | 2.68e-05 | 3.64e-04 | 2.89e-04 | 43 |
| hsa0501728 | Esophagus | ESCC | Spinocerebellar ataxia | 94/4205 | 143/8465 | 6.77e-05 | 2.90e-04 | 1.48e-04 | 94 |
| hsa0501736 | Esophagus | ESCC | Spinocerebellar ataxia | 94/4205 | 143/8465 | 6.77e-05 | 2.90e-04 | 1.48e-04 | 94 |
| hsa0501721 | Liver | HCC | Spinocerebellar ataxia | 92/4020 | 143/8465 | 3.20e-05 | 1.88e-04 | 1.04e-04 | 92 |
| hsa0501731 | Liver | HCC | Spinocerebellar ataxia | 92/4020 | 143/8465 | 3.20e-05 | 1.88e-04 | 1.04e-04 | 92 |
| hsa0501725 | Oral cavity | OSCC | Spinocerebellar ataxia | 86/3704 | 143/8465 | 5.21e-05 | 2.08e-04 | 1.06e-04 | 86 |
| hsa05017111 | Oral cavity | OSCC | Spinocerebellar ataxia | 86/3704 | 143/8465 | 5.21e-05 | 2.08e-04 | 1.06e-04 | 86 |
| hsa0501742 | Oral cavity | EOLP | Spinocerebellar ataxia | 30/1218 | 143/8465 | 1.96e-02 | 4.94e-02 | 2.91e-02 | 30 |
| hsa0501752 | Oral cavity | EOLP | Spinocerebellar ataxia | 30/1218 | 143/8465 | 1.96e-02 | 4.94e-02 | 2.91e-02 | 30 |
| Page: 1 2 |
Top |
Cell-cell communication analysis |
| Identification of potential cell-cell interactions between two cell types and their ligand-receptor pairs for different disease states |
| Ligand | Receptor | LRpair | Pathway | Tissue | Disease Stage |
| Page: 1 |
Top |
Single-cell gene regulatory network inference analysis |
| Find out the significant the regulons (TFs) and the target genes of each regulon across cell types for different disease states |
| TF | Cell Type | Tissue | Disease Stage | Target Gene | RSS | Regulon Activity |
| ∗The dot plots of a searched regulon are shown for all cell subpopulations in each disease state of each tissue based on the regulon specific score inferred using pySCENIC and by calculating the average expression. |
| Page: 1 |
Top |
Somatic mutation of malignant transformation related genes |
| Annotation of somatic variants for genes involved in malignant transformation |
| Hugo Symbol | Variant Class | Variant Classification | dbSNP RS | HGVSc | HGVSp | HGVSp Short | SWISSPROT | BIOTYPE | SIFT | PolyPhen | Tumor Sample Barcode | Tissue | Histology | Sex | Age | Stage | Therapy Types | Drugs | Outcome |
| OPA1 | SNV | Missense_Mutation | novel | c.2534N>G | p.Tyr845Cys | p.Y845C | O60313 | protein_coding | tolerated(0.14) | possibly_damaging(0.865) | TCGA-A2-A25D-01 | Breast | breast invasive carcinoma | Female | >=65 | III/IV | Hormone Therapy | tamoxiphen | SD |
| OPA1 | SNV | Missense_Mutation | rs760300107 | c.1861N>T | p.Arg621Cys | p.R621C | O60313 | protein_coding | deleterious(0) | probably_damaging(0.943) | TCGA-A8-A090-01 | Breast | breast invasive carcinoma | Female | >=65 | I/II | Unknown | Unknown | SD |
| OPA1 | SNV | Missense_Mutation | novel | c.1709N>C | p.Met570Thr | p.M570T | O60313 | protein_coding | tolerated(0.16) | benign(0.007) | TCGA-AN-A046-01 | Breast | breast invasive carcinoma | Female | >=65 | I/II | Unknown | Unknown | SD |
| OPA1 | SNV | Missense_Mutation | novel | c.201C>G | p.Asn67Lys | p.N67K | O60313 | protein_coding | tolerated(0.72) | benign(0) | TCGA-B6-A0RS-01 | Breast | breast invasive carcinoma | Female | <65 | I/II | Unknown | Unknown | PD |
| OPA1 | SNV | Missense_Mutation | c.801G>C | p.Gln267His | p.Q267H | O60313 | protein_coding | deleterious(0.01) | possibly_damaging(0.742) | TCGA-C8-A1HM-01 | Breast | breast invasive carcinoma | Female | >=65 | I/II | Chemotherapy | doxorubicin | CR | |
| OPA1 | SNV | Missense_Mutation | c.2203G>C | p.Asp735His | p.D735H | O60313 | protein_coding | deleterious(0.03) | probably_damaging(0.984) | TCGA-C8-A26Y-01 | Breast | breast invasive carcinoma | Female | >=65 | I/II | Unknown | Unknown | SD | |
| OPA1 | deletion | In_Frame_Del | c.824_826delNNN | p.Glu276del | p.E276del | O60313 | protein_coding | TCGA-A8-A09V-01 | Breast | breast invasive carcinoma | Female | <65 | I/II | Hormone Therapy | tamoxiphen | SD | |||
| OPA1 | insertion | Frame_Shift_Ins | novel | c.1999_2000insTACC | p.Thr667IlefsTer6 | p.T667Ifs*6 | O60313 | protein_coding | TCGA-AR-A0TU-01 | Breast | breast invasive carcinoma | Female | <65 | I/II | Unspecific | Doxorubicin | SD | ||
| OPA1 | SNV | Missense_Mutation | c.2318C>A | p.Ser773Tyr | p.S773Y | O60313 | protein_coding | deleterious(0.04) | benign(0.163) | TCGA-2W-A8YY-01 | Cervix | cervical & endocervical cancer | Female | <65 | I/II | Chemotherapy | cisplatin | CR | |
| OPA1 | SNV | Missense_Mutation | c.1783N>C | p.Glu595Gln | p.E595Q | O60313 | protein_coding | deleterious(0.02) | possibly_damaging(0.48) | TCGA-DR-A0ZM-01 | Cervix | cervical & endocervical cancer | Female | <65 | III/IV | Unspecific | Cisplatin | SD |
| Page: 1 2 3 4 5 6 7 8 |
Top |
Related drugs of malignant transformation related genes |
| Identification of chemicals and drugs interact with genes involved in malignant transfromation |
| (DGIdb 4.0) |
| Entrez ID | Symbol | Category | Interaction Types | Drug Claim Name | Drug Name | PMIDs |
| Page: 1 |

Copyright 2023-Present -The University of Texas Health Science Center at Houston |