
|
|||||
|
 | |
| |
| |
| |
| |
| |
|
Gene: ONECUT2 |
Gene summary for ONECUT2 |
| Gene information | Species | Human | Gene symbol | ONECUT2 | Gene ID | 9480 |
| Gene name | one cut homeobox 2 | |
| Gene Alias | OC-2 | |
| Cytomap | 18q21.31 | |
| Gene Type | protein-coding | GO ID | GO:0001889 | UniProtAcc | O95948 |
Top |
Malignant transformation analysis |
| Identification of the aberrant gene expression in precancerous and cancerous lesions by comparing the gene expression of stem-like cells in diseased tissues with normal stem cells |
| Entrez ID | Symbol | Replicates | Species | Organ | Tissue | Adj P-value | Log2FC | Malignancy |
| 9480 | ONECUT2 | S43 | Human | Liver | Cirrhotic | 3.64e-09 | -2.14e-01 | -0.0187 |
| 9480 | ONECUT2 | HCC1_Meng | Human | Liver | HCC | 2.65e-74 | 7.07e-02 | 0.0246 |
| 9480 | ONECUT2 | cirrhotic1 | Human | Liver | Cirrhotic | 1.46e-02 | 1.61e-01 | 0.0202 |
| 9480 | ONECUT2 | HCC1 | Human | Liver | HCC | 6.00e-27 | 6.01e+00 | 0.5336 |
| 9480 | ONECUT2 | HCC2 | Human | Liver | HCC | 3.22e-35 | 5.30e+00 | 0.5341 |
| 9480 | ONECUT2 | HCC5 | Human | Liver | HCC | 1.65e-03 | 3.59e+00 | 0.4932 |
| 9480 | ONECUT2 | Pt13.a | Human | Liver | HCC | 3.33e-03 | -2.25e-01 | 0.021 |
| 9480 | ONECUT2 | Pt13.b | Human | Liver | HCC | 2.98e-04 | -1.12e-01 | 0.0251 |
| 9480 | ONECUT2 | Pt14.a | Human | Liver | HCC | 4.54e-05 | 6.06e-01 | 0.0169 |
| 9480 | ONECUT2 | Pt14.b | Human | Liver | HCC | 7.12e-06 | 3.58e-01 | 0.018 |
| 9480 | ONECUT2 | S014 | Human | Liver | HCC | 4.41e-15 | 1.24e+00 | 0.2254 |
| 9480 | ONECUT2 | S015 | Human | Liver | HCC | 7.16e-12 | 1.25e+00 | 0.2375 |
| 9480 | ONECUT2 | S016 | Human | Liver | HCC | 4.97e-19 | 1.09e+00 | 0.2243 |
| 9480 | ONECUT2 | S027 | Human | Liver | HCC | 1.74e-05 | 9.39e-01 | 0.2446 |
| 9480 | ONECUT2 | S028 | Human | Liver | HCC | 9.48e-18 | 1.04e+00 | 0.2503 |
| 9480 | ONECUT2 | S029 | Human | Liver | HCC | 2.02e-07 | 8.18e-01 | 0.2581 |
| Page: 1 |
| Tissue | Expression Dynamics | Abbreviation |
| Liver | 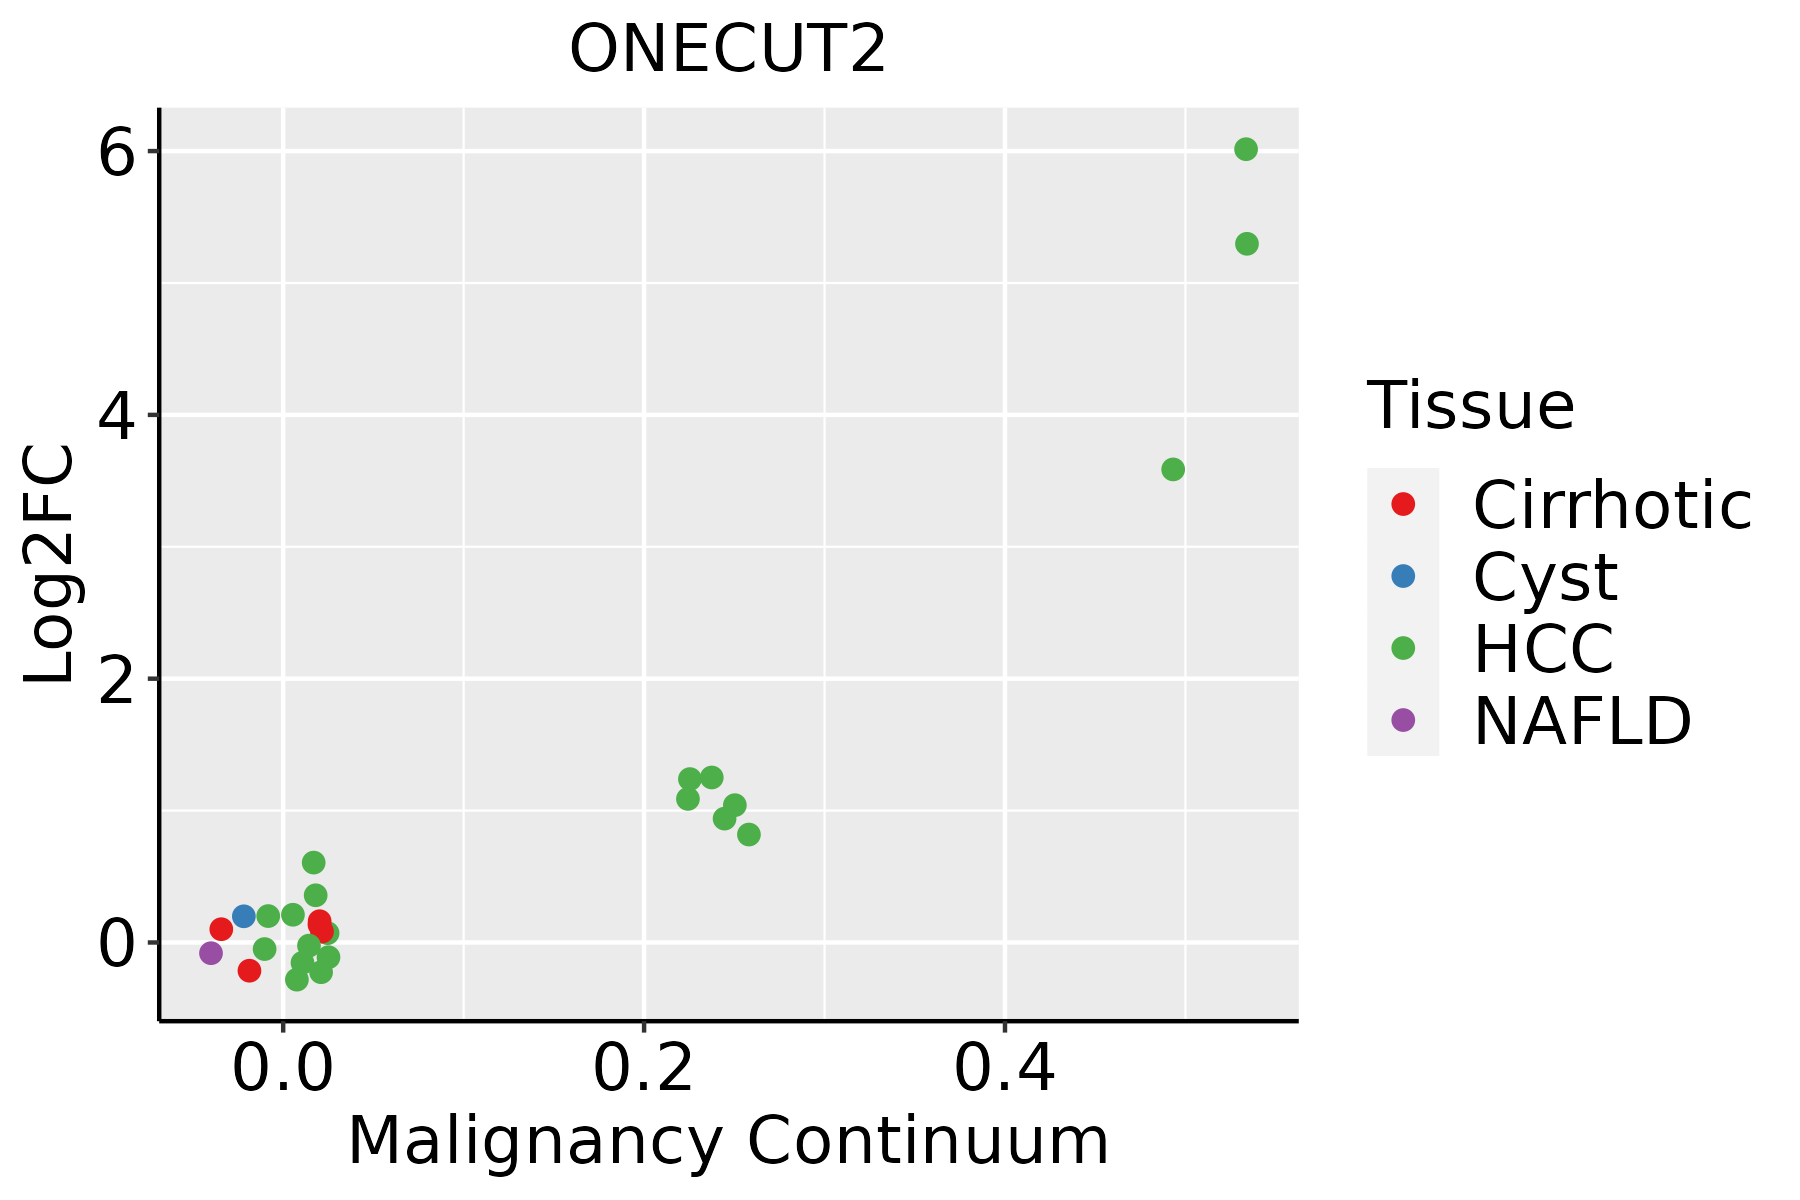 | HCC: Hepatocellular carcinoma |
| NAFLD: Non-alcoholic fatty liver disease |
| ∗log2FC in expression of this searched gene in stem-like cells from each diseased tissue sample relative to stem-like cells in normal samples in each tissue plotted against the malignancy continuum. Samples are colored based on if they are from different disease stage. |
Top |
Malignant transformation related pathway analysis |
| Find out the enriched GO biological processes and KEGG pathways involved in transition from healthy to precancer to cancer |
| Tissue | Disease Stage | Enriched GO biological Processes |
| Colorectum | AD |  |
| Colorectum | SER |  |
| Colorectum | MSS |  |
| Colorectum | MSI-H |  |
| Colorectum | FAP |  |
| ∗Top 15 enriched GO BP terms are showed in the bar plot of each disease state in each tissue. Each row represents a significant GO biological process which is colored according to the -log10(p.adjust). |
| Page: 1 2 3 4 5 6 7 8 9 |
| GO ID | Tissue | Disease Stage | Description | Gene Ratio | Bg Ratio | pvalue | p.adjust | Count |
| GO:000188912 | Liver | Cirrhotic | liver development | 81/4634 | 147/18723 | 2.99e-15 | 3.35e-13 | 81 |
| GO:006100812 | Liver | Cirrhotic | hepaticobiliary system development | 82/4634 | 150/18723 | 3.72e-15 | 4.09e-13 | 82 |
| GO:004873212 | Liver | Cirrhotic | gland development | 154/4634 | 436/18723 | 4.03e-07 | 9.42e-06 | 154 |
| GO:001081012 | Liver | Cirrhotic | regulation of cell-substrate adhesion | 88/4634 | 221/18723 | 4.89e-07 | 1.10e-05 | 88 |
| GO:007155911 | Liver | Cirrhotic | response to transforming growth factor beta | 96/4634 | 256/18723 | 3.55e-06 | 6.09e-05 | 96 |
| GO:003158912 | Liver | Cirrhotic | cell-substrate adhesion | 128/4634 | 363/18723 | 4.10e-06 | 6.90e-05 | 128 |
| GO:000195211 | Liver | Cirrhotic | regulation of cell-matrix adhesion | 55/4634 | 128/18723 | 4.64e-06 | 7.65e-05 | 55 |
| GO:007156011 | Liver | Cirrhotic | cellular response to transforming growth factor beta stimulus | 93/4634 | 250/18723 | 7.34e-06 | 1.13e-04 | 93 |
| GO:000716011 | Liver | Cirrhotic | cell-matrix adhesion | 85/4634 | 233/18723 | 4.06e-05 | 4.83e-04 | 85 |
| GO:000206412 | Liver | Cirrhotic | epithelial cell development | 80/4634 | 220/18723 | 7.63e-05 | 8.44e-04 | 80 |
| GO:000717911 | Liver | Cirrhotic | transforming growth factor beta receptor signaling pathway | 71/4634 | 198/18723 | 3.02e-04 | 2.65e-03 | 71 |
| GO:190384411 | Liver | Cirrhotic | regulation of cellular response to transforming growth factor beta stimulus | 47/4634 | 131/18723 | 2.87e-03 | 1.65e-02 | 47 |
| GO:000717811 | Liver | Cirrhotic | transmembrane receptor protein serine/threonine kinase signaling pathway | 111/4634 | 355/18723 | 2.98e-03 | 1.70e-02 | 111 |
| GO:00170152 | Liver | Cirrhotic | regulation of transforming growth factor beta receptor signaling pathway | 46/4634 | 128/18723 | 3.04e-03 | 1.72e-02 | 46 |
| GO:000188922 | Liver | HCC | liver development | 108/7958 | 147/18723 | 2.16e-14 | 1.41e-12 | 108 |
| GO:006100822 | Liver | HCC | hepaticobiliary system development | 109/7958 | 150/18723 | 5.72e-14 | 3.42e-12 | 109 |
| GO:004873222 | Liver | HCC | gland development | 242/7958 | 436/18723 | 2.26e-08 | 5.28e-07 | 242 |
| GO:007155921 | Liver | HCC | response to transforming growth factor beta | 141/7958 | 256/18723 | 3.08e-05 | 3.16e-04 | 141 |
| GO:001081022 | Liver | HCC | regulation of cell-substrate adhesion | 123/7958 | 221/18723 | 5.15e-05 | 4.90e-04 | 123 |
| GO:007156021 | Liver | HCC | cellular response to transforming growth factor beta stimulus | 137/7958 | 250/18723 | 5.47e-05 | 5.14e-04 | 137 |
| Page: 1 2 |
| Pathway ID | Tissue | Disease Stage | Description | Gene Ratio | Bg Ratio | pvalue | p.adjust | qvalue | Count |
| Page: 1 |
Top |
Cell-cell communication analysis |
| Identification of potential cell-cell interactions between two cell types and their ligand-receptor pairs for different disease states |
| Ligand | Receptor | LRpair | Pathway | Tissue | Disease Stage |
| Page: 1 |
Top |
Single-cell gene regulatory network inference analysis |
| Find out the significant the regulons (TFs) and the target genes of each regulon across cell types for different disease states |
| TF | Cell Type | Tissue | Disease Stage | Target Gene | RSS | Regulon Activity |
| ONECUT2 | COL | Cervix | HSIL_HPV | TM4SF4,SLC40A1,GATM, etc. | 3.19e-01 |  |
| ONECUT2 | GOB | Esophagus | ADJ | SEC61G,CALML4,LGALS4, etc. | 2.14e-01 |  |
| ONECUT2 | LYMEND | Liver | Cirrhotic | ITIH3,MT-ND1,MT-ND2, etc. | 3.89e-01 |  |
| ONECUT2 | LYMEND | Liver | Healthy | ITIH3,MT-ND1,MT-ND2, etc. | 1.50e-01 |  |
| ∗The dot plots of a searched regulon are shown for all cell subpopulations in each disease state of each tissue based on the regulon specific score inferred using pySCENIC and by calculating the average expression. |
| Page: 1 |
Top |
Somatic mutation of malignant transformation related genes |
| Annotation of somatic variants for genes involved in malignant transformation |
| Hugo Symbol | Variant Class | Variant Classification | dbSNP RS | HGVSc | HGVSp | HGVSp Short | SWISSPROT | BIOTYPE | SIFT | PolyPhen | Tumor Sample Barcode | Tissue | Histology | Sex | Age | Stage | Therapy Types | Drugs | Outcome |
| ONECUT2 | SNV | Missense_Mutation | rs760843135 | c.1435N>T | p.Arg479Cys | p.R479C | O95948 | protein_coding | deleterious(0) | possibly_damaging(0.656) | TCGA-A7-A0CE-01 | Breast | breast invasive carcinoma | Female | <65 | I/II | Chemotherapy | adriamycin | SD |
| ONECUT2 | SNV | Missense_Mutation | c.482C>G | p.Ser161Cys | p.S161C | O95948 | protein_coding | deleterious(0) | probably_damaging(0.984) | TCGA-AC-A23H-01 | Breast | breast invasive carcinoma | Female | >=65 | I/II | Unknown | Unknown | PD | |
| ONECUT2 | SNV | Missense_Mutation | c.739C>T | p.Pro247Ser | p.P247S | O95948 | protein_coding | tolerated(0.47) | benign(0) | TCGA-D8-A1J8-01 | Breast | breast invasive carcinoma | Female | >=65 | I/II | Hormone Therapy | nolvadex | SD | |
| ONECUT2 | SNV | Missense_Mutation | rs866569959 | c.595N>T | p.Arg199Cys | p.R199C | O95948 | protein_coding | deleterious(0) | probably_damaging(0.99) | TCGA-2W-A8YY-01 | Cervix | cervical & endocervical cancer | Female | <65 | I/II | Chemotherapy | cisplatin | CR |
| ONECUT2 | SNV | Missense_Mutation | rs771314671 | c.1438N>T | p.Arg480Cys | p.R480C | O95948 | protein_coding | deleterious(0) | probably_damaging(0.997) | TCGA-C5-A7CH-01 | Cervix | cervical & endocervical cancer | Female | <65 | I/II | Unspecific | SD | |
| ONECUT2 | SNV | Missense_Mutation | c.1243N>C | p.Glu415Gln | p.E415Q | O95948 | protein_coding | deleterious(0.03) | probably_damaging(0.965) | TCGA-IR-A3LK-01 | Cervix | cervical & endocervical cancer | Female | >=65 | I/II | Chemotherapy | cisplatin | PD | |
| ONECUT2 | SNV | Missense_Mutation | novel | c.1487N>A | p.Ser496Tyr | p.S496Y | O95948 | protein_coding | deleterious_low_confidence(0) | possibly_damaging(0.521) | TCGA-VS-A9UP-01 | Cervix | cervical & endocervical cancer | Female | <65 | I/II | Chemotherapy | cisplatin | PD |
| ONECUT2 | SNV | Missense_Mutation | novel | c.1307T>C | p.Leu436Pro | p.L436P | O95948 | protein_coding | deleterious(0.01) | probably_damaging(0.929) | TCGA-A6-A565-01 | Colorectum | colon adenocarcinoma | Female | <65 | III/IV | Unspecific | 5FU | PD |
| ONECUT2 | SNV | Missense_Mutation | c.1203N>C | p.Gln401His | p.Q401H | O95948 | protein_coding | deleterious(0) | probably_damaging(0.991) | TCGA-AY-6196-01 | Colorectum | colon adenocarcinoma | Male | <65 | III/IV | Unknown | Unknown | SD | |
| ONECUT2 | SNV | Missense_Mutation | c.449N>T | p.Thr150Met | p.T150M | O95948 | protein_coding | deleterious(0) | probably_damaging(0.991) | TCGA-CM-4746-01 | Colorectum | colon adenocarcinoma | Male | <65 | I/II | Unknown | Unknown | SD |
| Page: 1 2 3 4 5 |
Top |
Related drugs of malignant transformation related genes |
| Identification of chemicals and drugs interact with genes involved in malignant transfromation |
| (DGIdb 4.0) |
| Entrez ID | Symbol | Category | Interaction Types | Drug Claim Name | Drug Name | PMIDs |
| Page: 1 |

Copyright 2023-Present -The University of Texas Health Science Center at Houston |