
|
|||||
|
 | |
| |
| |
| |
| |
| |
|
Gene: OLFML2A |
Gene summary for OLFML2A |
| Gene information | Species | Human | Gene symbol | OLFML2A | Gene ID | 169611 |
| Gene name | olfactomedin like 2A | |
| Gene Alias | PRO34319 | |
| Cytomap | 9q33.3 | |
| Gene Type | protein-coding | GO ID | GO:0008150 | UniProtAcc | Q68BL7 |
Top |
Malignant transformation analysis |
| Identification of the aberrant gene expression in precancerous and cancerous lesions by comparing the gene expression of stem-like cells in diseased tissues with normal stem cells |
| Entrez ID | Symbol | Replicates | Species | Organ | Tissue | Adj P-value | Log2FC | Malignancy |
| 169611 | OLFML2A | P2T-E | Human | Esophagus | ESCC | 1.14e-14 | 2.30e-01 | 0.1177 |
| 169611 | OLFML2A | P4T-E | Human | Esophagus | ESCC | 3.97e-11 | 2.94e-01 | 0.1323 |
| 169611 | OLFML2A | P5T-E | Human | Esophagus | ESCC | 3.89e-04 | 1.17e-02 | 0.1327 |
| 169611 | OLFML2A | P8T-E | Human | Esophagus | ESCC | 2.97e-21 | 4.84e-01 | 0.0889 |
| 169611 | OLFML2A | P9T-E | Human | Esophagus | ESCC | 4.96e-04 | 2.06e-01 | 0.1131 |
| 169611 | OLFML2A | P10T-E | Human | Esophagus | ESCC | 3.97e-09 | 1.99e-01 | 0.116 |
| 169611 | OLFML2A | P11T-E | Human | Esophagus | ESCC | 1.82e-23 | 8.77e-01 | 0.1426 |
| 169611 | OLFML2A | P12T-E | Human | Esophagus | ESCC | 1.61e-17 | 3.16e-01 | 0.1122 |
| 169611 | OLFML2A | P15T-E | Human | Esophagus | ESCC | 5.72e-18 | 4.14e-01 | 0.1149 |
| 169611 | OLFML2A | P20T-E | Human | Esophagus | ESCC | 3.54e-08 | 2.04e-01 | 0.1124 |
| 169611 | OLFML2A | P21T-E | Human | Esophagus | ESCC | 2.62e-18 | 5.74e-01 | 0.1617 |
| 169611 | OLFML2A | P22T-E | Human | Esophagus | ESCC | 6.40e-14 | 1.35e-01 | 0.1236 |
| 169611 | OLFML2A | P26T-E | Human | Esophagus | ESCC | 5.17e-20 | 4.45e-01 | 0.1276 |
| 169611 | OLFML2A | P27T-E | Human | Esophagus | ESCC | 3.42e-18 | 2.44e-01 | 0.1055 |
| 169611 | OLFML2A | P30T-E | Human | Esophagus | ESCC | 7.10e-05 | 2.47e-01 | 0.137 |
| 169611 | OLFML2A | P31T-E | Human | Esophagus | ESCC | 9.01e-12 | 2.82e-01 | 0.1251 |
| 169611 | OLFML2A | P32T-E | Human | Esophagus | ESCC | 5.43e-03 | 2.97e-01 | 0.1666 |
| 169611 | OLFML2A | P37T-E | Human | Esophagus | ESCC | 1.66e-10 | 3.65e-01 | 0.1371 |
| 169611 | OLFML2A | P42T-E | Human | Esophagus | ESCC | 1.26e-10 | 4.02e-01 | 0.1175 |
| 169611 | OLFML2A | P44T-E | Human | Esophagus | ESCC | 7.87e-04 | 1.81e-01 | 0.1096 |
| Page: 1 2 |
| Tissue | Expression Dynamics | Abbreviation |
| Esophagus |  | ESCC: Esophageal squamous cell carcinoma |
| HGIN: High-grade intraepithelial neoplasias | ||
| LGIN: Low-grade intraepithelial neoplasias | ||
| Oral Cavity | 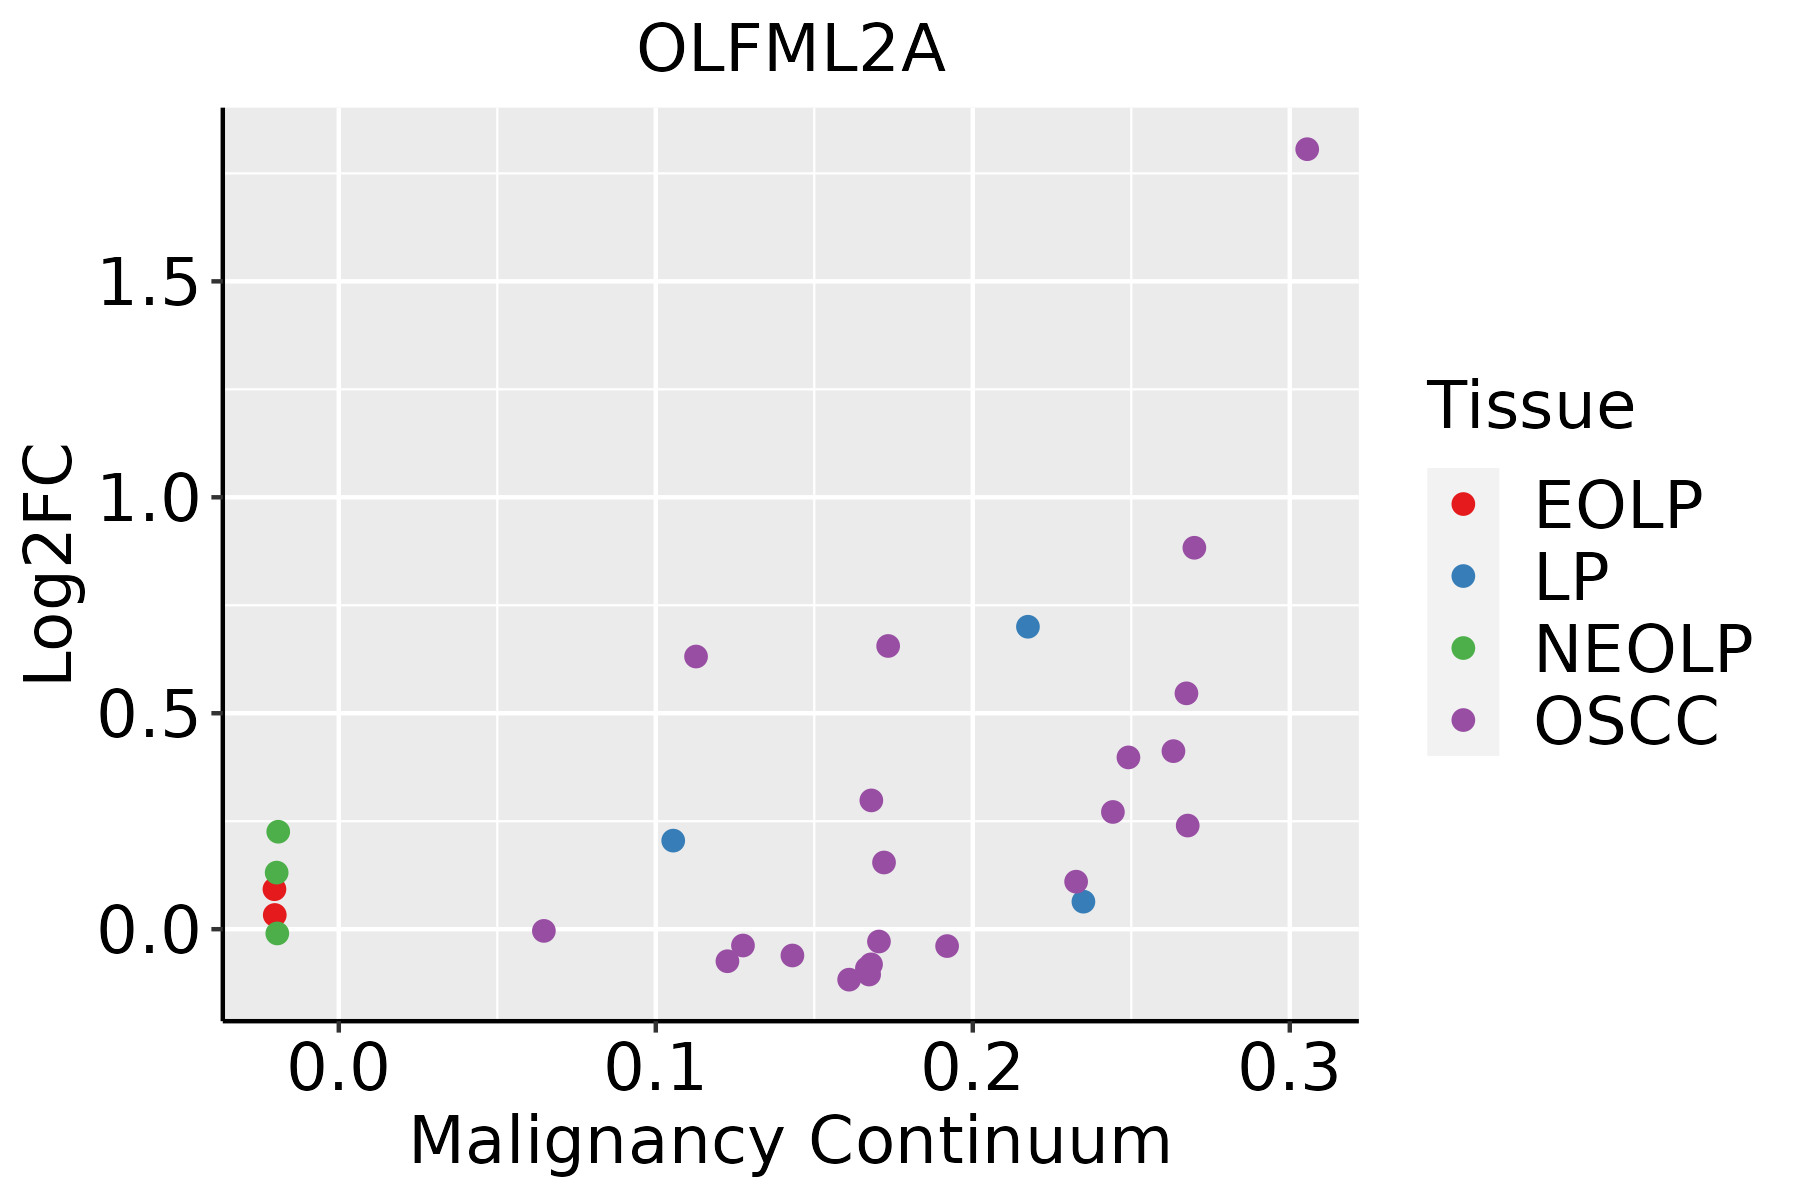 | EOLP: Erosive Oral lichen planus |
| LP: leukoplakia | ||
| NEOLP: Non-erosive oral lichen planus | ||
| OSCC: Oral squamous cell carcinoma |
| ∗log2FC in expression of this searched gene in stem-like cells from each diseased tissue sample relative to stem-like cells in normal samples in each tissue plotted against the malignancy continuum. Samples are colored based on if they are from different disease stage. |
Top |
Malignant transformation related pathway analysis |
| Find out the enriched GO biological processes and KEGG pathways involved in transition from healthy to precancer to cancer |
| Tissue | Disease Stage | Enriched GO biological Processes |
| Colorectum | AD |  |
| Colorectum | SER |  |
| Colorectum | MSS |  |
| Colorectum | MSI-H |  |
| Colorectum | FAP |  |
| ∗Top 15 enriched GO BP terms are showed in the bar plot of each disease state in each tissue. Each row represents a significant GO biological process which is colored according to the -log10(p.adjust). |
| Page: 1 2 3 4 5 6 7 8 9 |
| GO ID | Tissue | Disease Stage | Description | Gene Ratio | Bg Ratio | pvalue | p.adjust | Count |
| GO:00301984 | Esophagus | ESCC | extracellular matrix organization | 171/8552 | 301/18723 | 6.08e-05 | 4.67e-04 | 171 |
| GO:00430624 | Esophagus | ESCC | extracellular structure organization | 171/8552 | 302/18723 | 7.73e-05 | 5.76e-04 | 171 |
| GO:00452294 | Esophagus | ESCC | external encapsulating structure organization | 172/8552 | 304/18723 | 7.80e-05 | 5.80e-04 | 172 |
| GO:00301983 | Oral cavity | OSCC | extracellular matrix organization | 146/7305 | 301/18723 | 4.67e-04 | 2.77e-03 | 146 |
| GO:00452293 | Oral cavity | OSCC | external encapsulating structure organization | 147/7305 | 304/18723 | 5.30e-04 | 3.08e-03 | 147 |
| GO:00430623 | Oral cavity | OSCC | extracellular structure organization | 146/7305 | 302/18723 | 5.59e-04 | 3.23e-03 | 146 |
| Page: 1 |
| Pathway ID | Tissue | Disease Stage | Description | Gene Ratio | Bg Ratio | pvalue | p.adjust | qvalue | Count |
| Page: 1 |
Top |
Cell-cell communication analysis |
| Identification of potential cell-cell interactions between two cell types and their ligand-receptor pairs for different disease states |
| Ligand | Receptor | LRpair | Pathway | Tissue | Disease Stage |
| Page: 1 |
Top |
Single-cell gene regulatory network inference analysis |
| Find out the significant the regulons (TFs) and the target genes of each regulon across cell types for different disease states |
| TF | Cell Type | Tissue | Disease Stage | Target Gene | RSS | Regulon Activity |
| ∗The dot plots of a searched regulon are shown for all cell subpopulations in each disease state of each tissue based on the regulon specific score inferred using pySCENIC and by calculating the average expression. |
| Page: 1 |
Top |
Somatic mutation of malignant transformation related genes |
| Annotation of somatic variants for genes involved in malignant transformation |
| Hugo Symbol | Variant Class | Variant Classification | dbSNP RS | HGVSc | HGVSp | HGVSp Short | SWISSPROT | BIOTYPE | SIFT | PolyPhen | Tumor Sample Barcode | Tissue | Histology | Sex | Age | Stage | Therapy Types | Drugs | Outcome |
| OLFML2A | SNV | Missense_Mutation | c.1423N>A | p.Ala475Thr | p.A475T | Q68BL7 | protein_coding | deleterious(0) | probably_damaging(0.984) | TCGA-AC-A23H-01 | Breast | breast invasive carcinoma | Female | >=65 | I/II | Unknown | Unknown | PD | |
| OLFML2A | SNV | Missense_Mutation | c.1522N>A | p.Glu508Lys | p.E508K | Q68BL7 | protein_coding | deleterious(0.01) | benign(0.038) | TCGA-AC-A23H-01 | Breast | breast invasive carcinoma | Female | >=65 | I/II | Unknown | Unknown | PD | |
| OLFML2A | SNV | Missense_Mutation | rs199680116 | c.1762N>A | p.Val588Met | p.V588M | Q68BL7 | protein_coding | deleterious(0) | probably_damaging(0.993) | TCGA-AC-A5XU-01 | Breast | breast invasive carcinoma | Female | >=65 | I/II | Hormone Therapy | letrozole | SD |
| OLFML2A | SNV | Missense_Mutation | c.831N>T | p.Lys277Asn | p.K277N | Q68BL7 | protein_coding | deleterious(0.01) | possibly_damaging(0.478) | TCGA-E2-A1B4-01 | Breast | breast invasive carcinoma | Female | >=65 | III/IV | Hormone Therapy | arimidex | SD | |
| OLFML2A | insertion | Frame_Shift_Ins | rs769664558 | c.1208_1209insC | p.Val406CysfsTer51 | p.V406Cfs*51 | Q68BL7 | protein_coding | TCGA-BH-A0BP-01 | Breast | breast invasive carcinoma | Female | >=65 | I/II | Unknown | Unknown | SD | ||
| OLFML2A | SNV | Missense_Mutation | novel | c.1747N>T | p.Gly583Cys | p.G583C | Q68BL7 | protein_coding | deleterious(0) | probably_damaging(1) | TCGA-2W-A8YY-01 | Cervix | cervical & endocervical cancer | Female | <65 | I/II | Chemotherapy | cisplatin | CR |
| OLFML2A | SNV | Missense_Mutation | rs777350219 | c.1211C>T | p.Pro404Leu | p.P404L | Q68BL7 | protein_coding | tolerated(0.14) | benign(0.021) | TCGA-C5-A1BN-01 | Cervix | cervical & endocervical cancer | Female | <65 | I/II | Chemotherapy | cisplatin | PD |
| OLFML2A | SNV | Missense_Mutation | c.1636N>A | p.Glu546Lys | p.E546K | Q68BL7 | protein_coding | deleterious(0) | possibly_damaging(0.678) | TCGA-VS-A8QA-01 | Cervix | cervical & endocervical cancer | Female | <65 | I/II | Unknown | Unknown | SD | |
| OLFML2A | SNV | Missense_Mutation | novel | c.554C>G | p.Ser185Cys | p.S185C | Q68BL7 | protein_coding | deleterious(0) | probably_damaging(0.999) | TCGA-ZJ-A8QR-01 | Cervix | cervical & endocervical cancer | Female | <65 | I/II | Unknown | Unknown | SD |
| OLFML2A | SNV | Missense_Mutation | rs368549348 | c.1573N>A | p.Val525Met | p.V525M | Q68BL7 | protein_coding | deleterious(0) | probably_damaging(1) | TCGA-A6-2680-01 | Colorectum | colon adenocarcinoma | Female | >=65 | I/II | Unknown | Unknown | SD |
| Page: 1 2 3 4 5 6 7 8 9 |
Top |
Related drugs of malignant transformation related genes |
| Identification of chemicals and drugs interact with genes involved in malignant transfromation |
| (DGIdb 4.0) |
| Entrez ID | Symbol | Category | Interaction Types | Drug Claim Name | Drug Name | PMIDs |
| Page: 1 |

Copyright 2023-Present -The University of Texas Health Science Center at Houston |