
|
|||||
|
 | |
| |
| |
| |
| |
| |
|
Gene: OLFM4 |
Gene summary for OLFM4 |
| Gene information | Species | Human | Gene symbol | OLFM4 | Gene ID | 10562 |
| Gene name | olfactomedin 4 | |
| Gene Alias | GC1 | |
| Cytomap | 13q14.3 | |
| Gene Type | protein-coding | GO ID | GO:0000902 | UniProtAcc | A0A024QZ95 |
Top |
Malignant transformation analysis |
| Identification of the aberrant gene expression in precancerous and cancerous lesions by comparing the gene expression of stem-like cells in diseased tissues with normal stem cells |
| Entrez ID | Symbol | Replicates | Species | Organ | Tissue | Adj P-value | Log2FC | Malignancy |
| 10562 | OLFM4 | HTA11_3410_2000001011 | Human | Colorectum | AD | 2.07e-55 | 2.55e+00 | 0.0155 |
| 10562 | OLFM4 | HTA11_2951_2000001011 | Human | Colorectum | AD | 1.43e-13 | 1.73e+00 | 0.0216 |
| 10562 | OLFM4 | HTA11_1938_2000001011 | Human | Colorectum | AD | 6.45e-35 | 2.85e+00 | -0.0811 |
| 10562 | OLFM4 | HTA11_2112_2000001011 | Human | Colorectum | SER | 8.93e-07 | 1.14e+00 | -0.2196 |
| 10562 | OLFM4 | HTA11_696_2000001011 | Human | Colorectum | AD | 2.50e-17 | 1.87e+00 | -0.1464 |
| 10562 | OLFM4 | HTA11_1391_2000001011 | Human | Colorectum | AD | 9.24e-32 | 4.31e+00 | -0.059 |
| 10562 | OLFM4 | HTA11_546_2000001011 | Human | Colorectum | AD | 8.96e-05 | 1.60e+00 | -0.0842 |
| 10562 | OLFM4 | HTA11_866_3004761011 | Human | Colorectum | AD | 1.40e-34 | 3.12e+00 | 0.096 |
| 10562 | OLFM4 | HTA11_4255_2000001011 | Human | Colorectum | SER | 3.52e-09 | 2.66e+00 | 0.0446 |
| 10562 | OLFM4 | HTA11_8622_2000001021 | Human | Colorectum | SER | 7.39e-22 | 2.90e+00 | 0.0528 |
| 10562 | OLFM4 | HTA11_7663_2000001011 | Human | Colorectum | SER | 1.36e-14 | 2.35e+00 | 0.0131 |
| 10562 | OLFM4 | HTA11_6801_2000001011 | Human | Colorectum | SER | 8.03e-26 | 4.30e+00 | 0.0171 |
| 10562 | OLFM4 | HTA11_10711_2000001011 | Human | Colorectum | AD | 9.90e-24 | 1.64e+00 | 0.0338 |
| 10562 | OLFM4 | HTA11_7696_3000711011 | Human | Colorectum | AD | 1.69e-71 | 3.19e+00 | 0.0674 |
| 10562 | OLFM4 | HTA11_6818_2000001011 | Human | Colorectum | AD | 2.80e-09 | 2.56e+00 | 0.0112 |
| 10562 | OLFM4 | HTA11_7469_2000001011 | Human | Colorectum | AD | 1.74e-04 | 1.54e+00 | -0.0124 |
| 10562 | OLFM4 | HTA11_11156_2000001011 | Human | Colorectum | AD | 1.92e-04 | 1.23e+00 | 0.0397 |
| 10562 | OLFM4 | HTA11_99999970781_79442 | Human | Colorectum | MSS | 1.40e-47 | 3.14e+00 | 0.294 |
| 10562 | OLFM4 | HTA11_99999965062_69753 | Human | Colorectum | MSI-H | 6.55e-03 | 3.06e-01 | 0.3487 |
| 10562 | OLFM4 | HTA11_99999965104_69814 | Human | Colorectum | MSS | 1.45e-11 | 2.09e+00 | 0.281 |
| Page: 1 2 3 4 5 |
| Tissue | Expression Dynamics | Abbreviation |
| Colorectum (GSE201348) |  | FAP: Familial adenomatous polyposis |
| CRC: Colorectal cancer | ||
| Colorectum (HTA11) |  | AD: Adenomas |
| SER: Sessile serrated lesions | ||
| MSI-H: Microsatellite-high colorectal cancer | ||
| MSS: Microsatellite stable colorectal cancer | ||
| Endometrium | 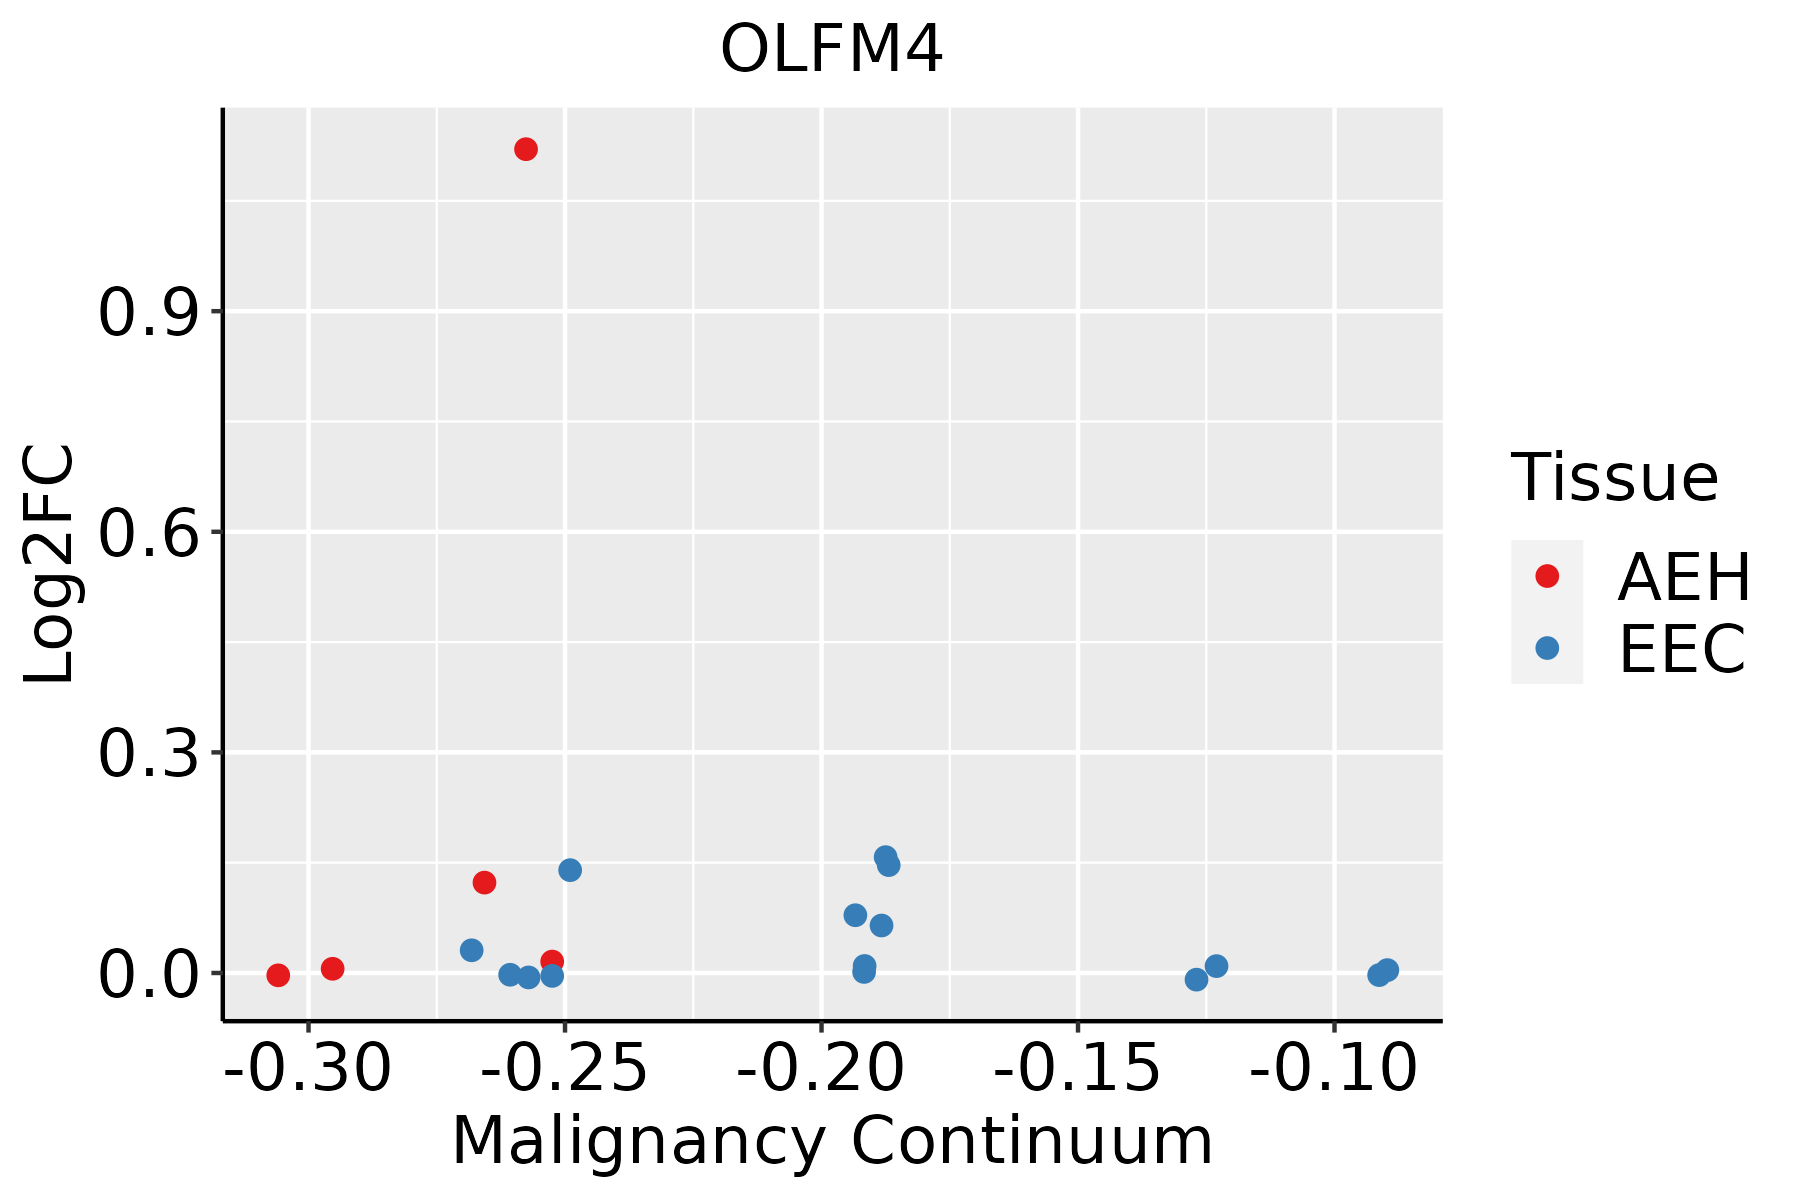 | AEH: Atypical endometrial hyperplasia |
| EEC: Endometrioid Cancer | ||
| GC |  | CAG: Chronic atrophic gastritis |
| CAG with IM: Chronic atrophic gastritis with intestinal metaplasia | ||
| CSG: Chronic superficial gastritis | ||
| GC: Gastric cancer | ||
| SIM: Severe intestinal metaplasia | ||
| WIM: Wild intestinal metaplasia | ||
| Prostate | 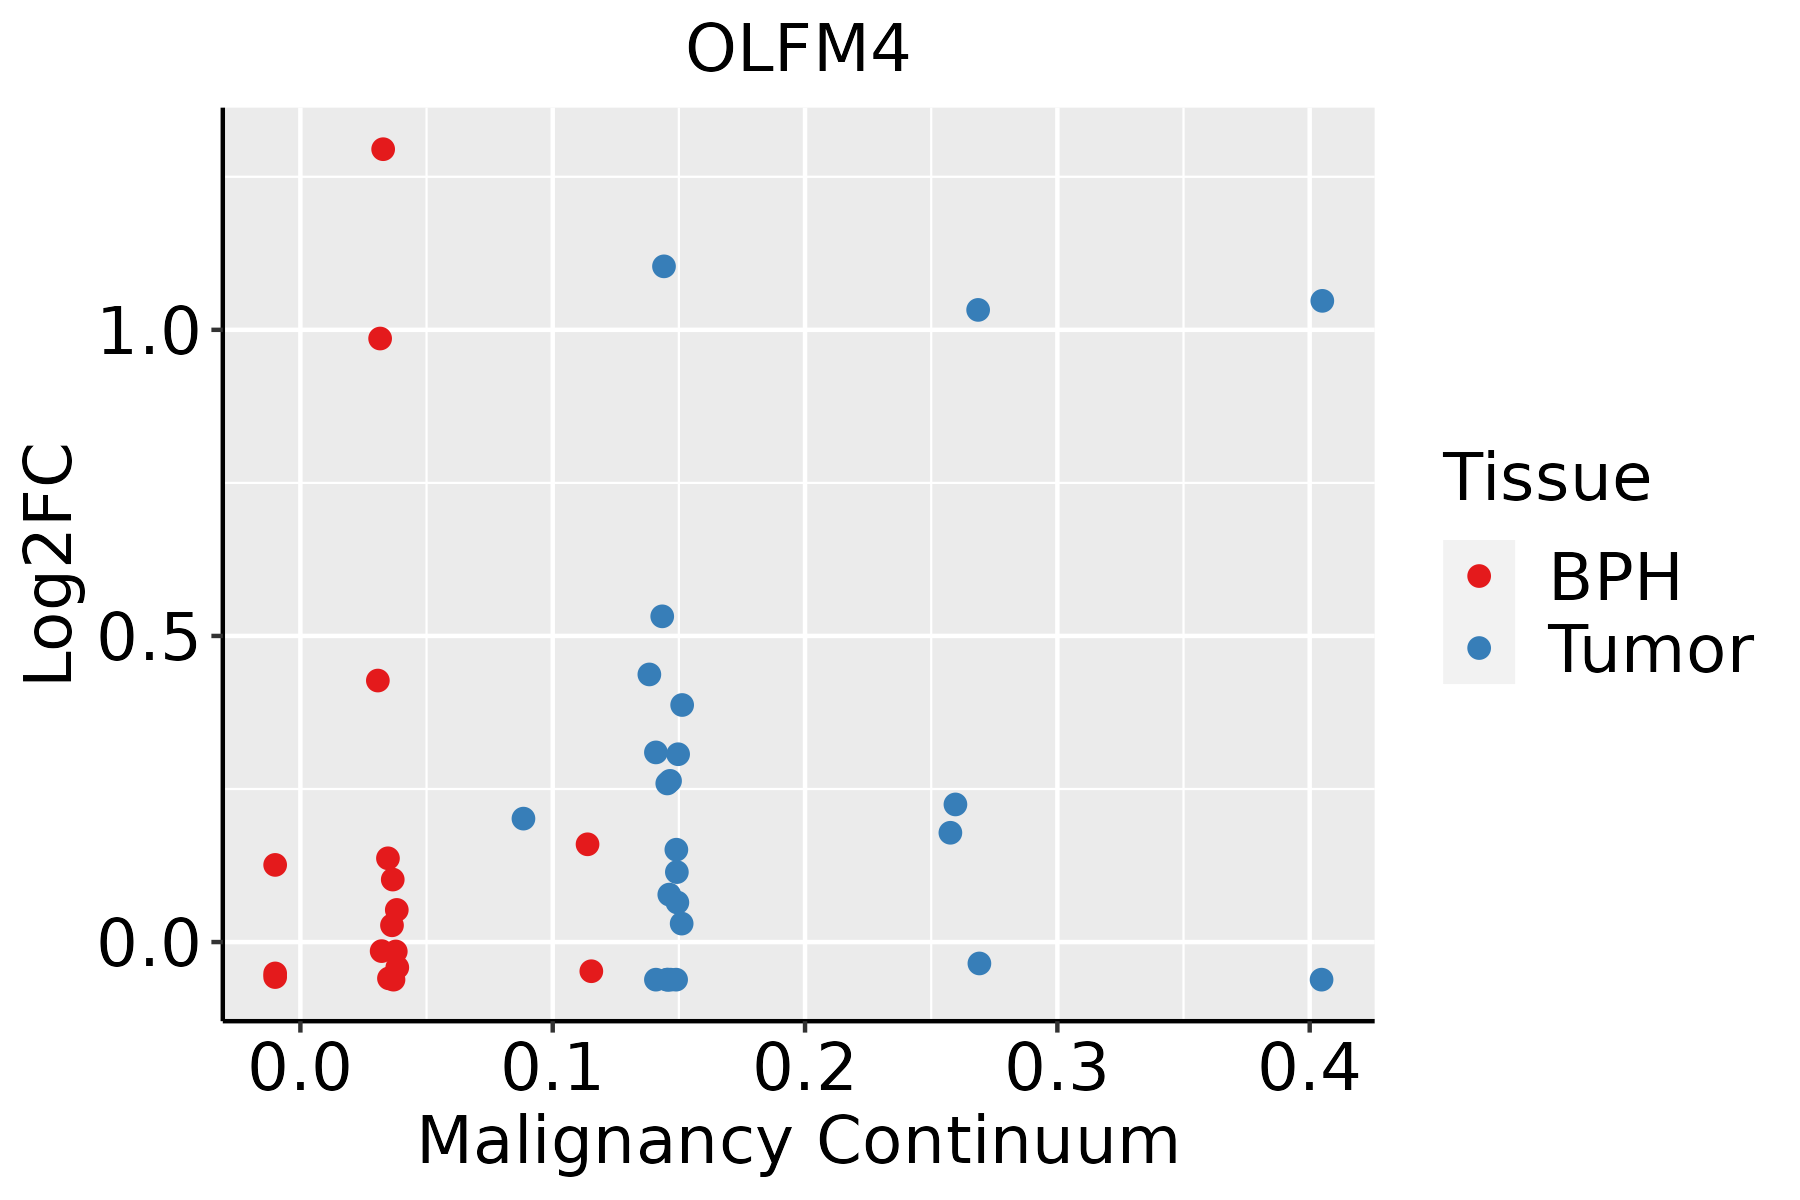 | BPH: Benign Prostatic Hyperplasia |
| ∗log2FC in expression of this searched gene in stem-like cells from each diseased tissue sample relative to stem-like cells in normal samples in each tissue plotted against the malignancy continuum. Samples are colored based on if they are from different disease stage. |
Top |
Malignant transformation related pathway analysis |
| Find out the enriched GO biological processes and KEGG pathways involved in transition from healthy to precancer to cancer |
| Tissue | Disease Stage | Enriched GO biological Processes |
| Colorectum | AD |  |
| Colorectum | SER |  |
| Colorectum | MSS |  |
| Colorectum | MSI-H |  |
| Colorectum | FAP |  |
| ∗Top 15 enriched GO BP terms are showed in the bar plot of each disease state in each tissue. Each row represents a significant GO biological process which is colored according to the -log10(p.adjust). |
| Page: 1 2 3 4 5 6 7 8 9 |
| GO ID | Tissue | Disease Stage | Description | Gene Ratio | Bg Ratio | pvalue | p.adjust | Count |
| GO:0022604 | Colorectum | AD | regulation of cell morphogenesis | 109/3918 | 309/18723 | 3.08e-09 | 2.07e-07 | 109 |
| GO:0010811 | Colorectum | AD | positive regulation of cell-substrate adhesion | 53/3918 | 123/18723 | 2.30e-08 | 1.27e-06 | 53 |
| GO:0010810 | Colorectum | AD | regulation of cell-substrate adhesion | 81/3918 | 221/18723 | 4.80e-08 | 2.55e-06 | 81 |
| GO:0031589 | Colorectum | AD | cell-substrate adhesion | 116/3918 | 363/18723 | 4.68e-07 | 1.76e-05 | 116 |
| GO:0034446 | Colorectum | AD | substrate adhesion-dependent cell spreading | 40/3918 | 108/18723 | 8.52e-05 | 1.32e-03 | 40 |
| GO:1900026 | Colorectum | AD | positive regulation of substrate adhesion-dependent cell spreading | 19/3918 | 41/18723 | 2.37e-04 | 3.03e-03 | 19 |
| GO:1900024 | Colorectum | AD | regulation of substrate adhesion-dependent cell spreading | 24/3918 | 57/18723 | 2.38e-04 | 3.03e-03 | 24 |
| GO:0045785 | Colorectum | AD | positive regulation of cell adhesion | 122/3918 | 437/18723 | 2.65e-04 | 3.28e-03 | 122 |
| GO:0010769 | Colorectum | AD | regulation of cell morphogenesis involved in differentiation | 35/3918 | 96/18723 | 3.26e-04 | 3.85e-03 | 35 |
| GO:0010770 | Colorectum | AD | positive regulation of cell morphogenesis involved in differentiation | 30/3918 | 79/18723 | 3.81e-04 | 4.38e-03 | 30 |
| GO:0010720 | Colorectum | AD | positive regulation of cell development | 87/3918 | 298/18723 | 4.17e-04 | 4.71e-03 | 87 |
| GO:00226041 | Colorectum | SER | regulation of cell morphogenesis | 89/2897 | 309/18723 | 1.51e-09 | 1.52e-07 | 89 |
| GO:00108101 | Colorectum | SER | regulation of cell-substrate adhesion | 64/2897 | 221/18723 | 2.34e-07 | 1.29e-05 | 64 |
| GO:00108111 | Colorectum | SER | positive regulation of cell-substrate adhesion | 41/2897 | 123/18723 | 6.52e-07 | 3.15e-05 | 41 |
| GO:00315891 | Colorectum | SER | cell-substrate adhesion | 86/2897 | 363/18723 | 2.36e-05 | 6.64e-04 | 86 |
| GO:00107691 | Colorectum | SER | regulation of cell morphogenesis involved in differentiation | 31/2897 | 96/18723 | 2.95e-05 | 7.89e-04 | 31 |
| GO:19000241 | Colorectum | SER | regulation of substrate adhesion-dependent cell spreading | 21/2897 | 57/18723 | 6.59e-05 | 1.51e-03 | 21 |
| GO:00107701 | Colorectum | SER | positive regulation of cell morphogenesis involved in differentiation | 26/2897 | 79/18723 | 8.81e-05 | 1.91e-03 | 26 |
| GO:00344461 | Colorectum | SER | substrate adhesion-dependent cell spreading | 32/2897 | 108/18723 | 1.42e-04 | 2.82e-03 | 32 |
| GO:19000261 | Colorectum | SER | positive regulation of substrate adhesion-dependent cell spreading | 16/2897 | 41/18723 | 2.21e-04 | 3.89e-03 | 16 |
| Page: 1 2 3 4 5 6 7 |
| Pathway ID | Tissue | Disease Stage | Description | Gene Ratio | Bg Ratio | pvalue | p.adjust | qvalue | Count |
| Page: 1 |
Top |
Cell-cell communication analysis |
| Identification of potential cell-cell interactions between two cell types and their ligand-receptor pairs for different disease states |
| Ligand | Receptor | LRpair | Pathway | Tissue | Disease Stage |
| Page: 1 |
Top |
Single-cell gene regulatory network inference analysis |
| Find out the significant the regulons (TFs) and the target genes of each regulon across cell types for different disease states |
| TF | Cell Type | Tissue | Disease Stage | Target Gene | RSS | Regulon Activity |
| ∗The dot plots of a searched regulon are shown for all cell subpopulations in each disease state of each tissue based on the regulon specific score inferred using pySCENIC and by calculating the average expression. |
| Page: 1 |
Top |
Somatic mutation of malignant transformation related genes |
| Annotation of somatic variants for genes involved in malignant transformation |
| Hugo Symbol | Variant Class | Variant Classification | dbSNP RS | HGVSc | HGVSp | HGVSp Short | SWISSPROT | BIOTYPE | SIFT | PolyPhen | Tumor Sample Barcode | Tissue | Histology | Sex | Age | Stage | Therapy Types | Drugs | Outcome |
| OLFM4 | SNV | Missense_Mutation | c.1114N>A | p.Arg372Ser | p.R372S | Q6UX06 | protein_coding | deleterious(0) | probably_damaging(0.977) | TCGA-AC-A2FM-01 | Breast | breast invasive carcinoma | Female | >=65 | I/II | Unknown | Unknown | PD | |
| OLFM4 | SNV | Missense_Mutation | c.893G>A | p.Arg298Lys | p.R298K | Q6UX06 | protein_coding | tolerated(0.07) | possibly_damaging(0.888) | TCGA-AN-A0AK-01 | Breast | breast invasive carcinoma | Female | >=65 | I/II | Unknown | Unknown | SD | |
| OLFM4 | SNV | Missense_Mutation | c.1005N>A | p.Asn335Lys | p.N335K | Q6UX06 | protein_coding | tolerated(0.92) | benign(0.029) | TCGA-B6-A0IC-01 | Breast | breast invasive carcinoma | Female | >=65 | I/II | Unknown | Unknown | SD | |
| OLFM4 | SNV | Missense_Mutation | c.232N>A | p.Asp78Asn | p.D78N | Q6UX06 | protein_coding | tolerated(0.17) | benign(0.037) | TCGA-BH-A2L8-01 | Breast | breast invasive carcinoma | Female | <65 | I/II | Chemotherapy | cytoxan | CR | |
| OLFM4 | insertion | Nonsense_Mutation | novel | c.552_553insATATAG | p.Val184_Asp185insIleTer | p.V184_D185insI* | Q6UX06 | protein_coding | TCGA-AR-A0U0-01 | Breast | breast invasive carcinoma | Female | >=65 | I/II | Unknown | Unknown | SD | ||
| OLFM4 | SNV | Missense_Mutation | novel | c.242N>A | p.Gly81Glu | p.G81E | Q6UX06 | protein_coding | deleterious(0.03) | possibly_damaging(0.768) | TCGA-VS-A8QH-01 | Cervix | cervical & endocervical cancer | Female | >=65 | I/II | Chemotherapy | gemcitabine | PD |
| OLFM4 | SNV | Missense_Mutation | c.1460N>C | p.Asp487Ala | p.D487A | Q6UX06 | protein_coding | deleterious(0) | probably_damaging(0.982) | TCGA-AA-3510-01 | Colorectum | colon adenocarcinoma | Male | >=65 | I/II | Unknown | Unknown | SD | |
| OLFM4 | SNV | Missense_Mutation | c.946N>T | p.Ile316Leu | p.I316L | Q6UX06 | protein_coding | deleterious(0.02) | benign(0.003) | TCGA-AA-3812-01 | Colorectum | colon adenocarcinoma | Female | >=65 | I/II | Unknown | Unknown | PD | |
| OLFM4 | SNV | Missense_Mutation | novel | c.396G>T | p.Lys132Asn | p.K132N | Q6UX06 | protein_coding | tolerated(0.51) | benign(0.01) | TCGA-AA-3984-01 | Colorectum | colon adenocarcinoma | Female | <65 | I/II | Unknown | Unknown | SD |
| OLFM4 | SNV | Missense_Mutation | c.1346N>A | p.Arg449Lys | p.R449K | Q6UX06 | protein_coding | tolerated(0.19) | benign(0.02) | TCGA-AA-A00N-01 | Colorectum | colon adenocarcinoma | Male | >=65 | I/II | Unknown | Unknown | PD |
| Page: 1 2 3 4 5 6 7 8 9 |
Top |
Related drugs of malignant transformation related genes |
| Identification of chemicals and drugs interact with genes involved in malignant transfromation |
| (DGIdb 4.0) |
| Entrez ID | Symbol | Category | Interaction Types | Drug Claim Name | Drug Name | PMIDs |
| Page: 1 |

Copyright 2023-Present -The University of Texas Health Science Center at Houston |