
|
|||||
|
 | |
| |
| |
| |
| |
| |
|
Gene: OLFM2 |
Gene summary for OLFM2 |
| Gene information | Species | Human | Gene symbol | OLFM2 | Gene ID | 93145 |
| Gene name | olfactomedin 2 | |
| Gene Alias | NOE2 | |
| Cytomap | 19p13.2 | |
| Gene Type | protein-coding | GO ID | GO:0006810 | UniProtAcc | O95897 |
Top |
Malignant transformation analysis |
| Identification of the aberrant gene expression in precancerous and cancerous lesions by comparing the gene expression of stem-like cells in diseased tissues with normal stem cells |
| Entrez ID | Symbol | Replicates | Species | Organ | Tissue | Adj P-value | Log2FC | Malignancy |
| 93145 | OLFM2 | LZE6T | Human | Esophagus | ESCC | 1.51e-02 | 1.83e-01 | 0.0845 |
| 93145 | OLFM2 | P2T-E | Human | Esophagus | ESCC | 4.52e-15 | 2.60e-01 | 0.1177 |
| 93145 | OLFM2 | P4T-E | Human | Esophagus | ESCC | 7.11e-05 | 7.32e-02 | 0.1323 |
| 93145 | OLFM2 | P10T-E | Human | Esophagus | ESCC | 4.64e-27 | 5.33e-01 | 0.116 |
| 93145 | OLFM2 | P11T-E | Human | Esophagus | ESCC | 4.07e-06 | 2.59e-01 | 0.1426 |
| 93145 | OLFM2 | P12T-E | Human | Esophagus | ESCC | 1.00e-12 | 2.22e-01 | 0.1122 |
| 93145 | OLFM2 | P15T-E | Human | Esophagus | ESCC | 4.32e-08 | 2.04e-01 | 0.1149 |
| 93145 | OLFM2 | P16T-E | Human | Esophagus | ESCC | 2.05e-11 | 1.25e-01 | 0.1153 |
| 93145 | OLFM2 | P22T-E | Human | Esophagus | ESCC | 1.46e-15 | 2.47e-01 | 0.1236 |
| 93145 | OLFM2 | P24T-E | Human | Esophagus | ESCC | 2.81e-06 | 1.80e-01 | 0.1287 |
| 93145 | OLFM2 | P26T-E | Human | Esophagus | ESCC | 2.11e-21 | 3.83e-01 | 0.1276 |
| 93145 | OLFM2 | P28T-E | Human | Esophagus | ESCC | 2.90e-02 | 1.46e-01 | 0.1149 |
| 93145 | OLFM2 | P30T-E | Human | Esophagus | ESCC | 1.96e-03 | 2.21e-01 | 0.137 |
| 93145 | OLFM2 | P31T-E | Human | Esophagus | ESCC | 3.55e-09 | 2.37e-01 | 0.1251 |
| 93145 | OLFM2 | P32T-E | Human | Esophagus | ESCC | 1.60e-11 | 2.33e-01 | 0.1666 |
| 93145 | OLFM2 | P36T-E | Human | Esophagus | ESCC | 2.17e-11 | 3.60e-01 | 0.1187 |
| 93145 | OLFM2 | P37T-E | Human | Esophagus | ESCC | 3.41e-41 | 9.98e-01 | 0.1371 |
| 93145 | OLFM2 | P40T-E | Human | Esophagus | ESCC | 4.12e-10 | 4.19e-01 | 0.109 |
| 93145 | OLFM2 | P42T-E | Human | Esophagus | ESCC | 1.20e-08 | 3.65e-01 | 0.1175 |
| 93145 | OLFM2 | P48T-E | Human | Esophagus | ESCC | 8.77e-06 | 7.20e-02 | 0.0959 |
| Page: 1 2 3 |
| Tissue | Expression Dynamics | Abbreviation |
| Esophagus | 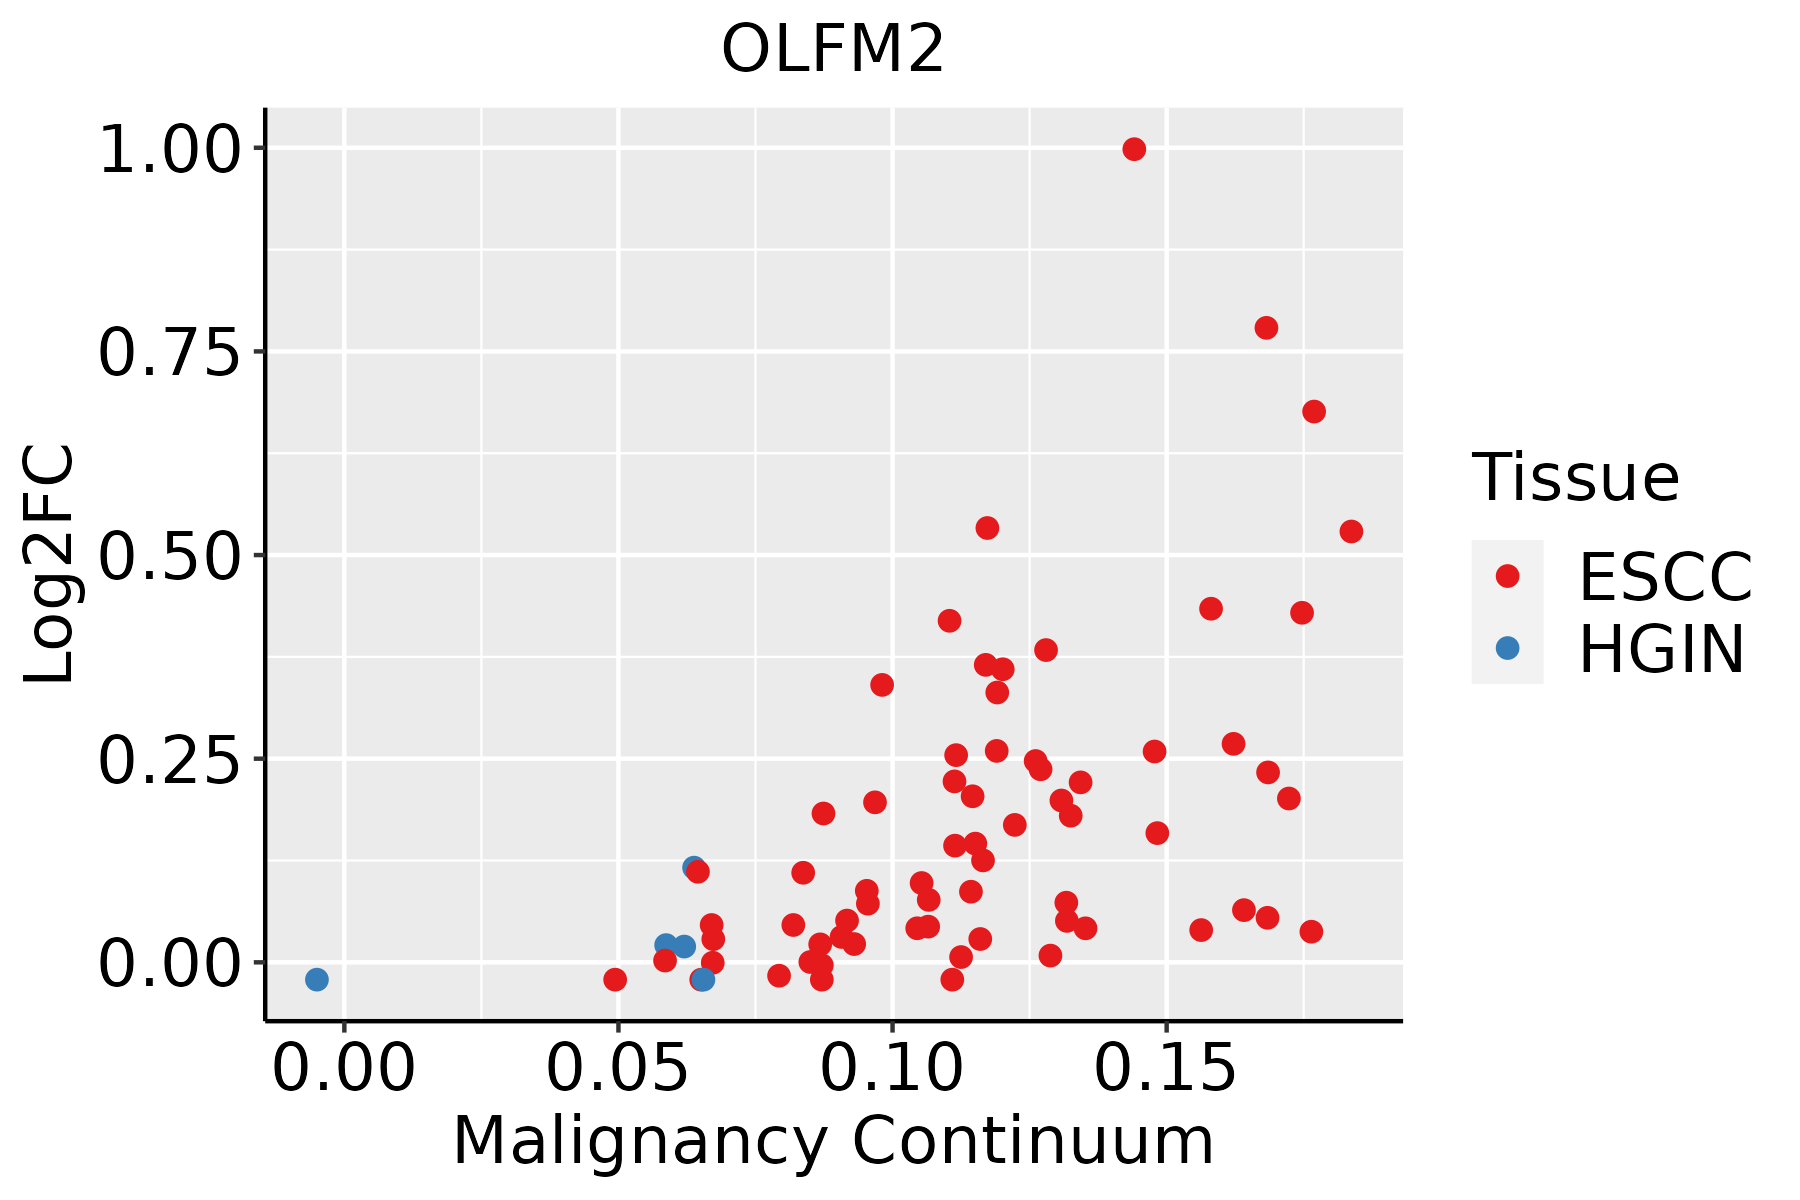 | ESCC: Esophageal squamous cell carcinoma |
| HGIN: High-grade intraepithelial neoplasias | ||
| LGIN: Low-grade intraepithelial neoplasias | ||
| Liver | 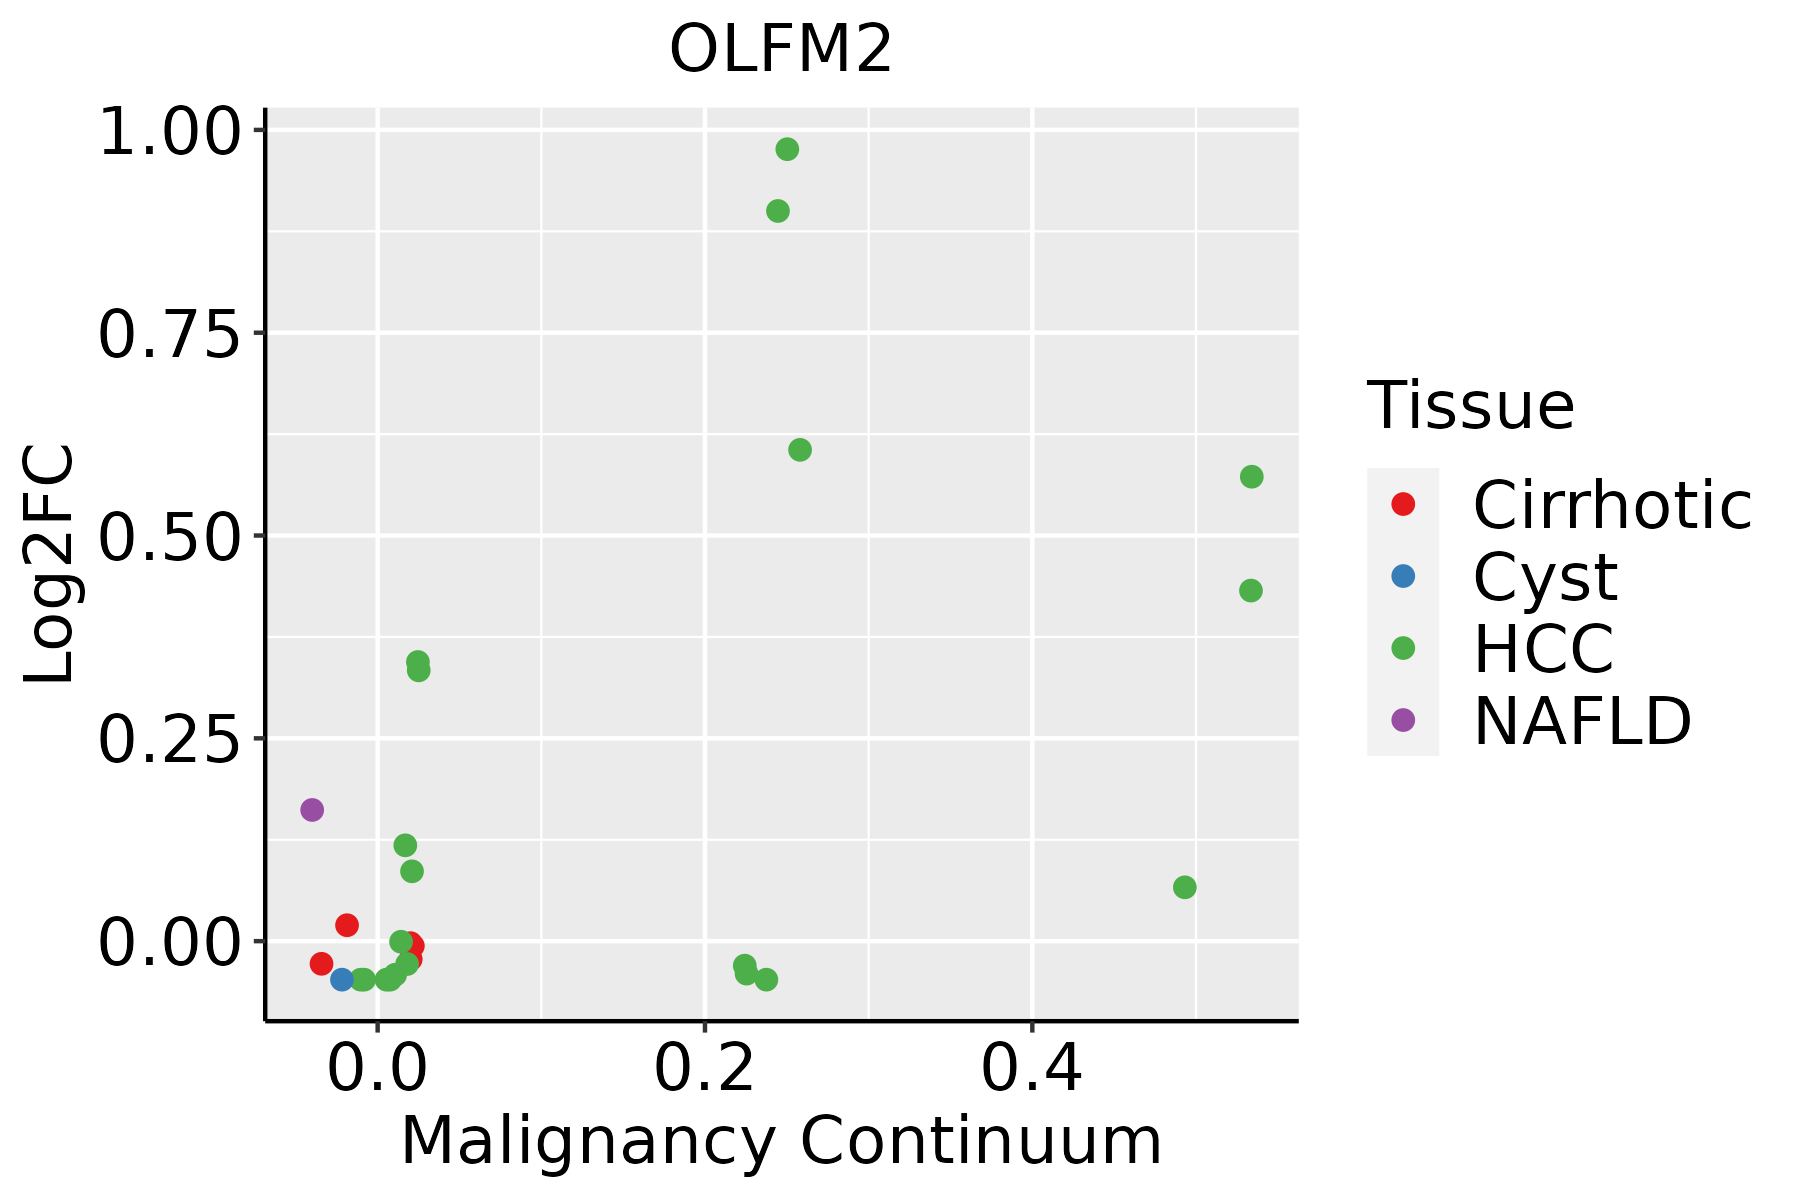 | HCC: Hepatocellular carcinoma |
| NAFLD: Non-alcoholic fatty liver disease | ||
| Skin | 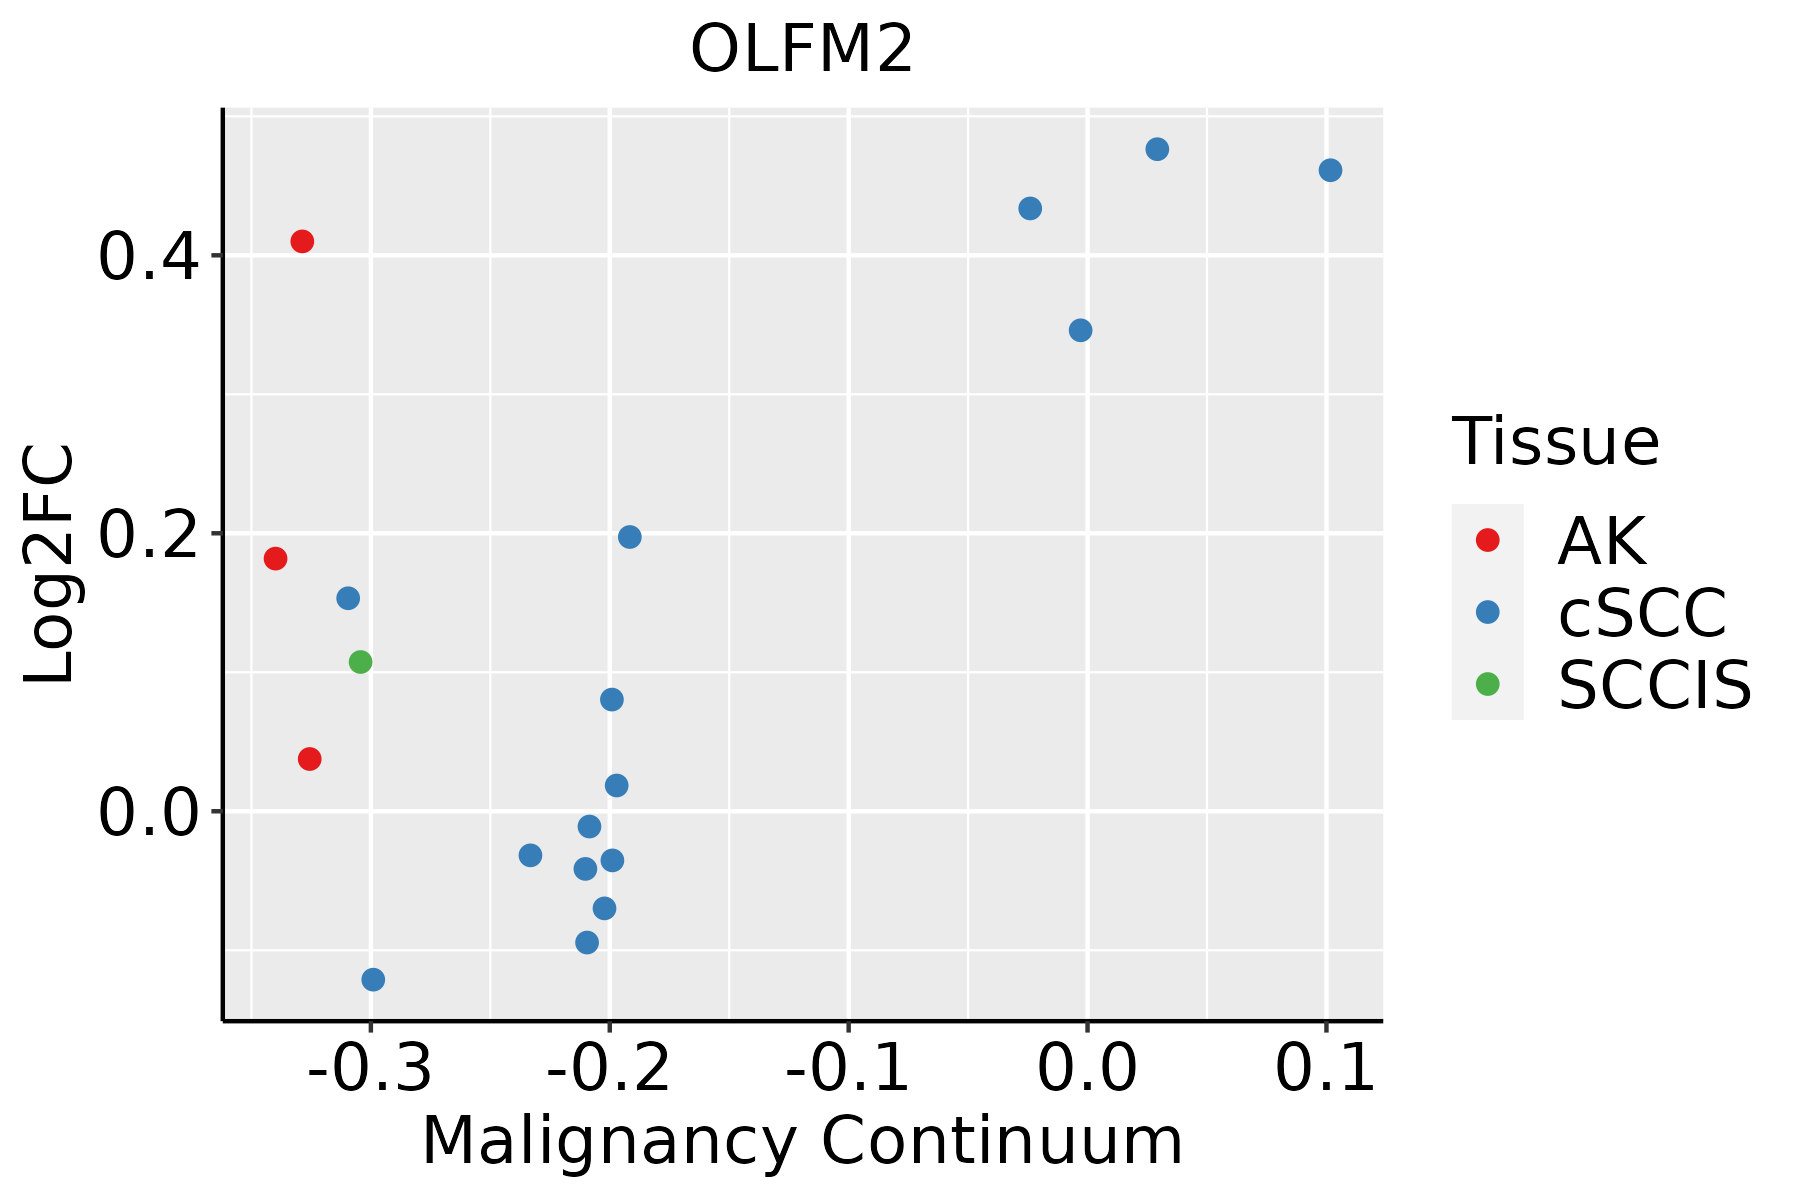 | AK: Actinic keratosis |
| cSCC: Cutaneous squamous cell carcinoma | ||
| SCCIS:squamous cell carcinoma in situ | ||
| Thyroid | 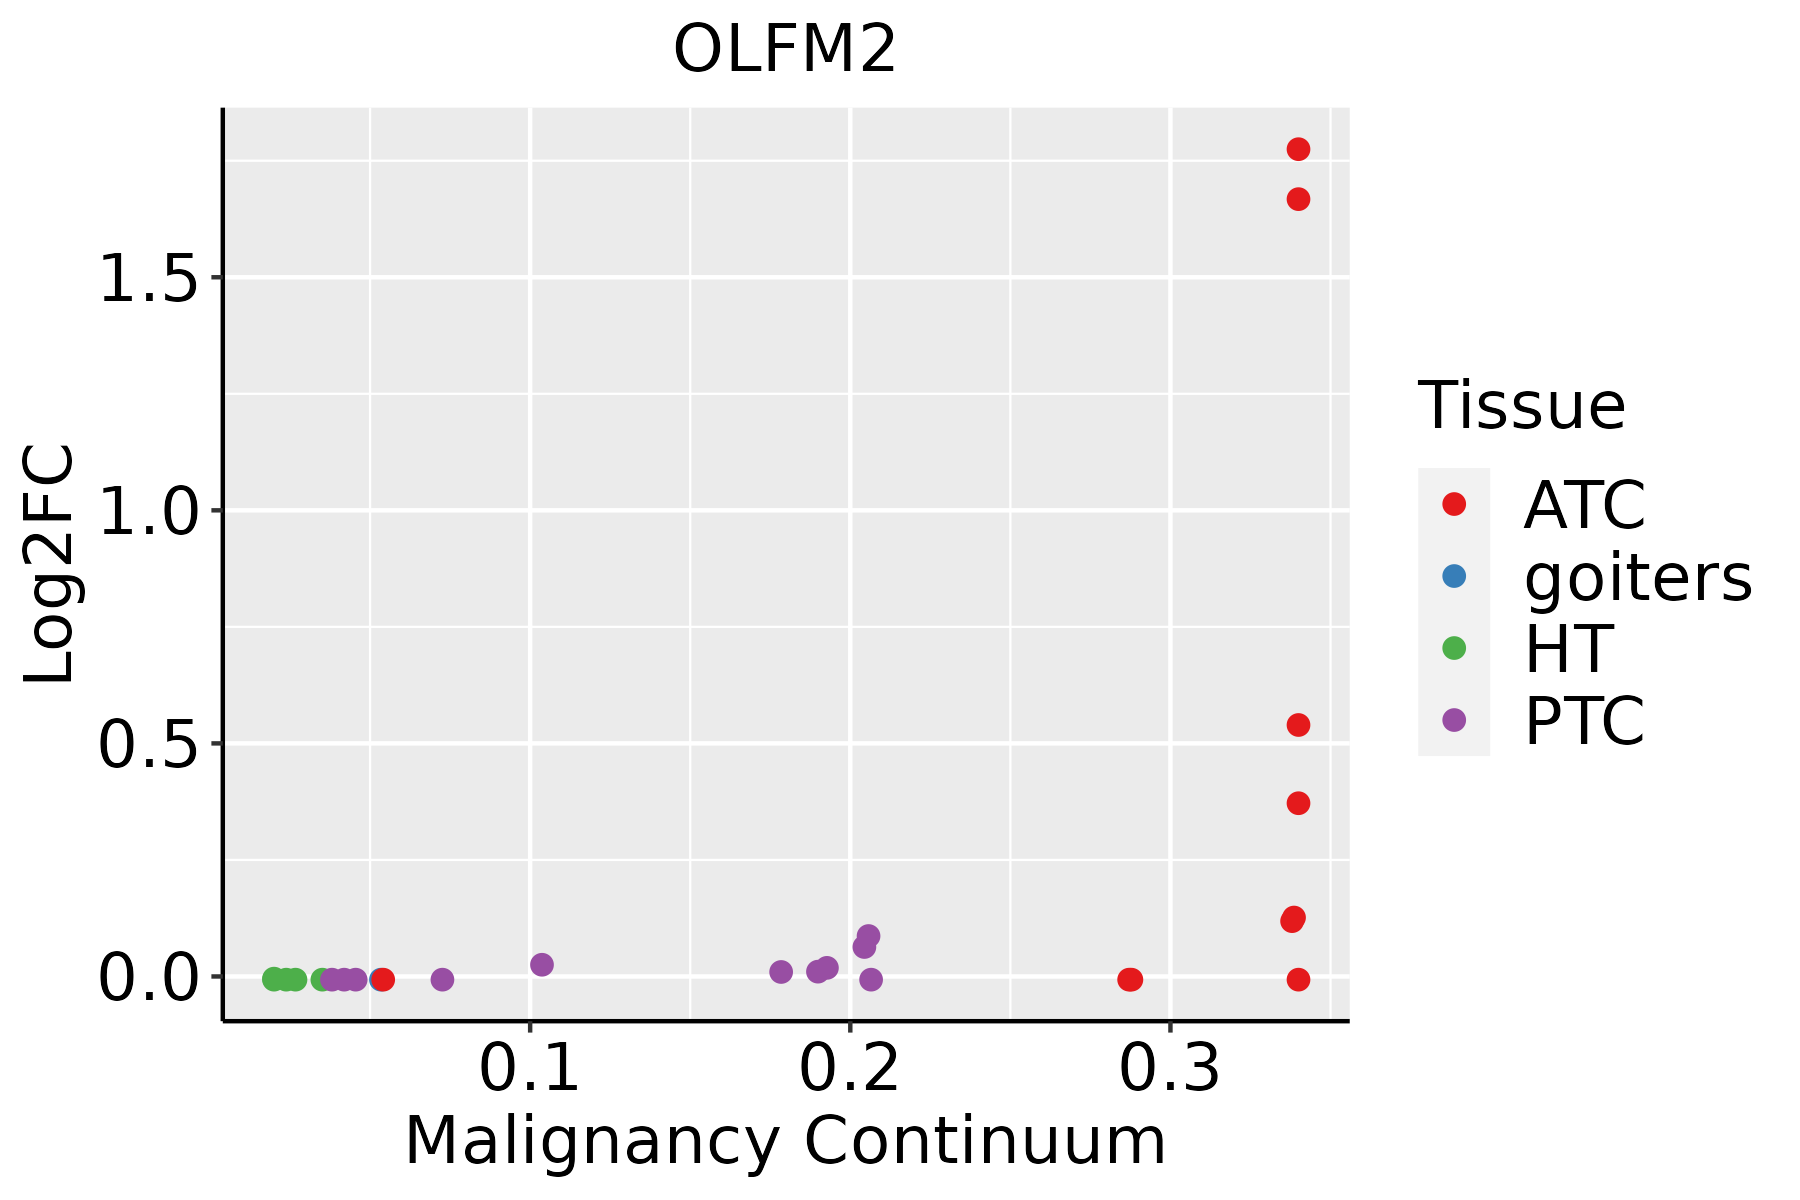 | ATC: Anaplastic thyroid cancer |
| HT: Hashimoto's thyroiditis | ||
| PTC: Papillary thyroid cancer |
| ∗log2FC in expression of this searched gene in stem-like cells from each diseased tissue sample relative to stem-like cells in normal samples in each tissue plotted against the malignancy continuum. Samples are colored based on if they are from different disease stage. |
Top |
Malignant transformation related pathway analysis |
| Find out the enriched GO biological processes and KEGG pathways involved in transition from healthy to precancer to cancer |
| Tissue | Disease Stage | Enriched GO biological Processes |
| Colorectum | AD |  |
| Colorectum | SER |  |
| Colorectum | MSS |  |
| Colorectum | MSI-H |  |
| Colorectum | FAP |  |
| ∗Top 15 enriched GO BP terms are showed in the bar plot of each disease state in each tissue. Each row represents a significant GO biological process which is colored according to the -log10(p.adjust). |
| Page: 1 2 3 4 5 6 7 8 9 |
| GO ID | Tissue | Disease Stage | Description | Gene Ratio | Bg Ratio | pvalue | p.adjust | Count |
| GO:000930617 | Esophagus | ESCC | protein secretion | 190/8552 | 359/18723 | 3.22e-03 | 1.34e-02 | 190 |
| GO:003559217 | Esophagus | ESCC | establishment of protein localization to extracellular region | 190/8552 | 360/18723 | 3.77e-03 | 1.53e-02 | 190 |
| GO:007169210 | Esophagus | ESCC | protein localization to extracellular region | 193/8552 | 368/18723 | 5.01e-03 | 1.92e-02 | 193 |
| GO:003559212 | Liver | HCC | establishment of protein localization to extracellular region | 176/7958 | 360/18723 | 7.96e-03 | 3.15e-02 | 176 |
| GO:000930612 | Liver | HCC | protein secretion | 175/7958 | 359/18723 | 9.32e-03 | 3.57e-02 | 175 |
| GO:00426928 | Skin | AK | muscle cell differentiation | 64/1910 | 384/18723 | 5.51e-05 | 8.38e-04 | 64 |
| GO:004269216 | Thyroid | ATC | muscle cell differentiation | 165/6293 | 384/18723 | 7.17e-05 | 5.46e-04 | 165 |
| GO:007169223 | Thyroid | ATC | protein localization to extracellular region | 150/6293 | 368/18723 | 2.25e-03 | 1.05e-02 | 150 |
| GO:000930623 | Thyroid | ATC | protein secretion | 146/6293 | 359/18723 | 2.83e-03 | 1.29e-02 | 146 |
| GO:003559223 | Thyroid | ATC | establishment of protein localization to extracellular region | 146/6293 | 360/18723 | 3.20e-03 | 1.44e-02 | 146 |
| Page: 1 |
| Pathway ID | Tissue | Disease Stage | Description | Gene Ratio | Bg Ratio | pvalue | p.adjust | qvalue | Count |
| Page: 1 |
Top |
Cell-cell communication analysis |
| Identification of potential cell-cell interactions between two cell types and their ligand-receptor pairs for different disease states |
| Ligand | Receptor | LRpair | Pathway | Tissue | Disease Stage |
| Page: 1 |
Top |
Single-cell gene regulatory network inference analysis |
| Find out the significant the regulons (TFs) and the target genes of each regulon across cell types for different disease states |
| TF | Cell Type | Tissue | Disease Stage | Target Gene | RSS | Regulon Activity |
| ∗The dot plots of a searched regulon are shown for all cell subpopulations in each disease state of each tissue based on the regulon specific score inferred using pySCENIC and by calculating the average expression. |
| Page: 1 |
Top |
Somatic mutation of malignant transformation related genes |
| Annotation of somatic variants for genes involved in malignant transformation |
| Hugo Symbol | Variant Class | Variant Classification | dbSNP RS | HGVSc | HGVSp | HGVSp Short | SWISSPROT | BIOTYPE | SIFT | PolyPhen | Tumor Sample Barcode | Tissue | Histology | Sex | Age | Stage | Therapy Types | Drugs | Outcome |
| OLFM2 | SNV | Missense_Mutation | rs529000203 | c.172N>G | p.Arg58Gly | p.R58G | O95897 | protein_coding | tolerated(0.08) | benign(0.173) | TCGA-AC-A23H-01 | Breast | breast invasive carcinoma | Female | >=65 | I/II | Unknown | Unknown | PD |
| OLFM2 | SNV | Missense_Mutation | novel | c.346N>A | p.Ala116Thr | p.A116T | O95897 | protein_coding | tolerated(0.59) | benign(0.05) | TCGA-AN-A046-01 | Breast | breast invasive carcinoma | Female | >=65 | I/II | Unknown | Unknown | SD |
| OLFM2 | SNV | Missense_Mutation | c.638N>A | p.Arg213His | p.R213H | O95897 | protein_coding | deleterious(0) | probably_damaging(1) | TCGA-B6-A1KN-01 | Breast | breast invasive carcinoma | Female | <65 | III/IV | Unknown | Unknown | SD | |
| OLFM2 | insertion | Frame_Shift_Ins | novel | c.107_108insCCAAAGTGTTGGGATTACAGGTGTGAGCCACCAT | p.Ala37GlnfsTer16 | p.A37Qfs*16 | O95897 | protein_coding | TCGA-A2-A04Y-01 | Breast | breast invasive carcinoma | Female | <65 | I/II | Chemotherapy | cytoxan | SD | ||
| OLFM2 | SNV | Missense_Mutation | rs771699423 | c.820N>C | p.Tyr274His | p.Y274H | O95897 | protein_coding | deleterious(0) | probably_damaging(0.985) | TCGA-2W-A8YY-01 | Cervix | cervical & endocervical cancer | Female | <65 | I/II | Chemotherapy | cisplatin | CR |
| OLFM2 | SNV | Missense_Mutation | c.985G>A | p.Glu329Lys | p.E329K | O95897 | protein_coding | deleterious(0) | probably_damaging(0.966) | TCGA-C5-A1M9-01 | Cervix | cervical & endocervical cancer | Female | <65 | I/II | Chemotherapy | cisplatin | PD | |
| OLFM2 | SNV | Missense_Mutation | c.331N>A | p.Asp111Asn | p.D111N | O95897 | protein_coding | tolerated(0.11) | benign(0.158) | TCGA-DR-A0ZM-01 | Cervix | cervical & endocervical cancer | Female | <65 | III/IV | Unspecific | Cisplatin | SD | |
| OLFM2 | SNV | Missense_Mutation | c.622C>T | p.Arg208Trp | p.R208W | O95897 | protein_coding | deleterious(0) | probably_damaging(0.992) | TCGA-MA-AA3Y-01 | Cervix | cervical & endocervical cancer | Female | <65 | I/II | Unknown | Unknown | SD | |
| OLFM2 | SNV | Missense_Mutation | novel | c.89G>A | p.Gly30Asp | p.G30D | O95897 | protein_coding | deleterious(0.01) | probably_damaging(0.974) | TCGA-AA-3947-01 | Colorectum | colon adenocarcinoma | Female | <65 | I/II | Unknown | Unknown | SD |
| OLFM2 | SNV | Missense_Mutation | rs765662180 | c.1036G>A | p.Val346Met | p.V346M | O95897 | protein_coding | deleterious(0.05) | possibly_damaging(0.627) | TCGA-AA-A010-01 | Colorectum | colon adenocarcinoma | Female | <65 | I/II | Chemotherapy | folinic | CR |
| Page: 1 2 3 4 5 6 |
Top |
Related drugs of malignant transformation related genes |
| Identification of chemicals and drugs interact with genes involved in malignant transfromation |
| (DGIdb 4.0) |
| Entrez ID | Symbol | Category | Interaction Types | Drug Claim Name | Drug Name | PMIDs |
| Page: 1 |

Copyright 2023-Present -The University of Texas Health Science Center at Houston |