
|
|||||
|
 | |
| |
| |
| |
| |
| |
|
Gene: OLFM1 |
Gene summary for OLFM1 |
| Gene information | Species | Human | Gene symbol | OLFM1 | Gene ID | 10439 |
| Gene name | olfactomedin 1 | |
| Gene Alias | AMY | |
| Cytomap | 9q34.3 | |
| Gene Type | protein-coding | GO ID | GO:0000902 | UniProtAcc | Q99784 |
Top |
Malignant transformation analysis |
| Identification of the aberrant gene expression in precancerous and cancerous lesions by comparing the gene expression of stem-like cells in diseased tissues with normal stem cells |
| Entrez ID | Symbol | Replicates | Species | Organ | Tissue | Adj P-value | Log2FC | Malignancy |
| 10439 | OLFM1 | LZE4T | Human | Esophagus | ESCC | 3.52e-04 | 2.33e-01 | 0.0811 |
| 10439 | OLFM1 | P5T-E | Human | Esophagus | ESCC | 5.45e-07 | 2.15e-01 | 0.1327 |
| 10439 | OLFM1 | P8T-E | Human | Esophagus | ESCC | 3.39e-06 | 1.48e-01 | 0.0889 |
| 10439 | OLFM1 | P9T-E | Human | Esophagus | ESCC | 1.21e-06 | 3.19e-01 | 0.1131 |
| 10439 | OLFM1 | P10T-E | Human | Esophagus | ESCC | 5.76e-42 | 7.78e-01 | 0.116 |
| 10439 | OLFM1 | P11T-E | Human | Esophagus | ESCC | 7.90e-06 | 3.65e-01 | 0.1426 |
| 10439 | OLFM1 | P16T-E | Human | Esophagus | ESCC | 3.26e-16 | 3.56e-01 | 0.1153 |
| 10439 | OLFM1 | P17T-E | Human | Esophagus | ESCC | 2.27e-02 | 2.77e-01 | 0.1278 |
| 10439 | OLFM1 | P21T-E | Human | Esophagus | ESCC | 1.60e-16 | 3.80e-01 | 0.1617 |
| 10439 | OLFM1 | P22T-E | Human | Esophagus | ESCC | 6.62e-28 | 5.83e-01 | 0.1236 |
| 10439 | OLFM1 | P24T-E | Human | Esophagus | ESCC | 1.37e-03 | 1.02e-01 | 0.1287 |
| 10439 | OLFM1 | P26T-E | Human | Esophagus | ESCC | 1.94e-10 | 2.26e-01 | 0.1276 |
| 10439 | OLFM1 | P28T-E | Human | Esophagus | ESCC | 6.04e-05 | 2.12e-01 | 0.1149 |
| 10439 | OLFM1 | P30T-E | Human | Esophagus | ESCC | 8.81e-03 | 3.54e-01 | 0.137 |
| 10439 | OLFM1 | P32T-E | Human | Esophagus | ESCC | 3.10e-33 | 6.59e-01 | 0.1666 |
| 10439 | OLFM1 | P36T-E | Human | Esophagus | ESCC | 1.24e-04 | 3.61e-01 | 0.1187 |
| 10439 | OLFM1 | P37T-E | Human | Esophagus | ESCC | 1.10e-15 | 6.99e-01 | 0.1371 |
| 10439 | OLFM1 | P48T-E | Human | Esophagus | ESCC | 3.58e-05 | 2.01e-01 | 0.0959 |
| 10439 | OLFM1 | P49T-E | Human | Esophagus | ESCC | 2.21e-15 | 1.53e+00 | 0.1768 |
| 10439 | OLFM1 | P52T-E | Human | Esophagus | ESCC | 1.21e-20 | 4.89e-01 | 0.1555 |
| Page: 1 2 |
| Tissue | Expression Dynamics | Abbreviation |
| Esophagus | 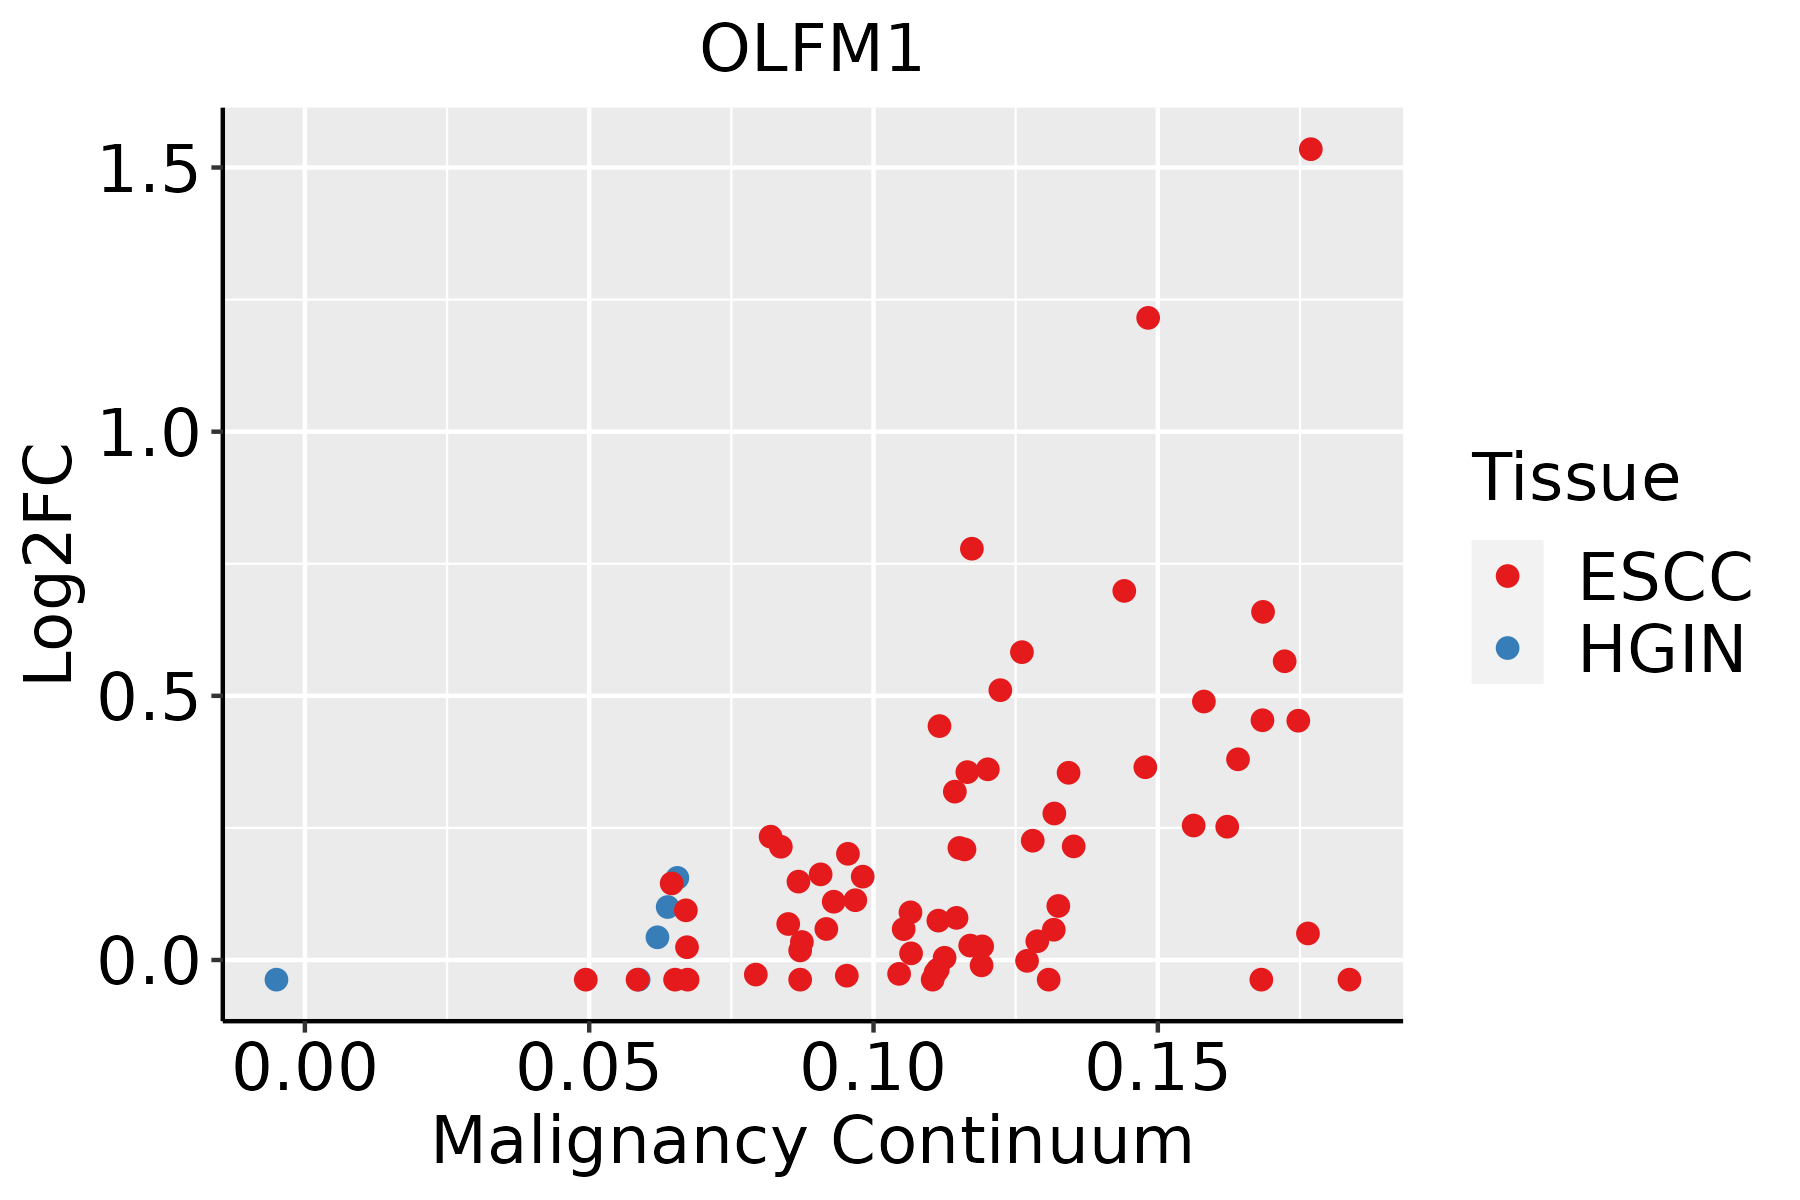 | ESCC: Esophageal squamous cell carcinoma |
| HGIN: High-grade intraepithelial neoplasias | ||
| LGIN: Low-grade intraepithelial neoplasias | ||
| Oral Cavity | 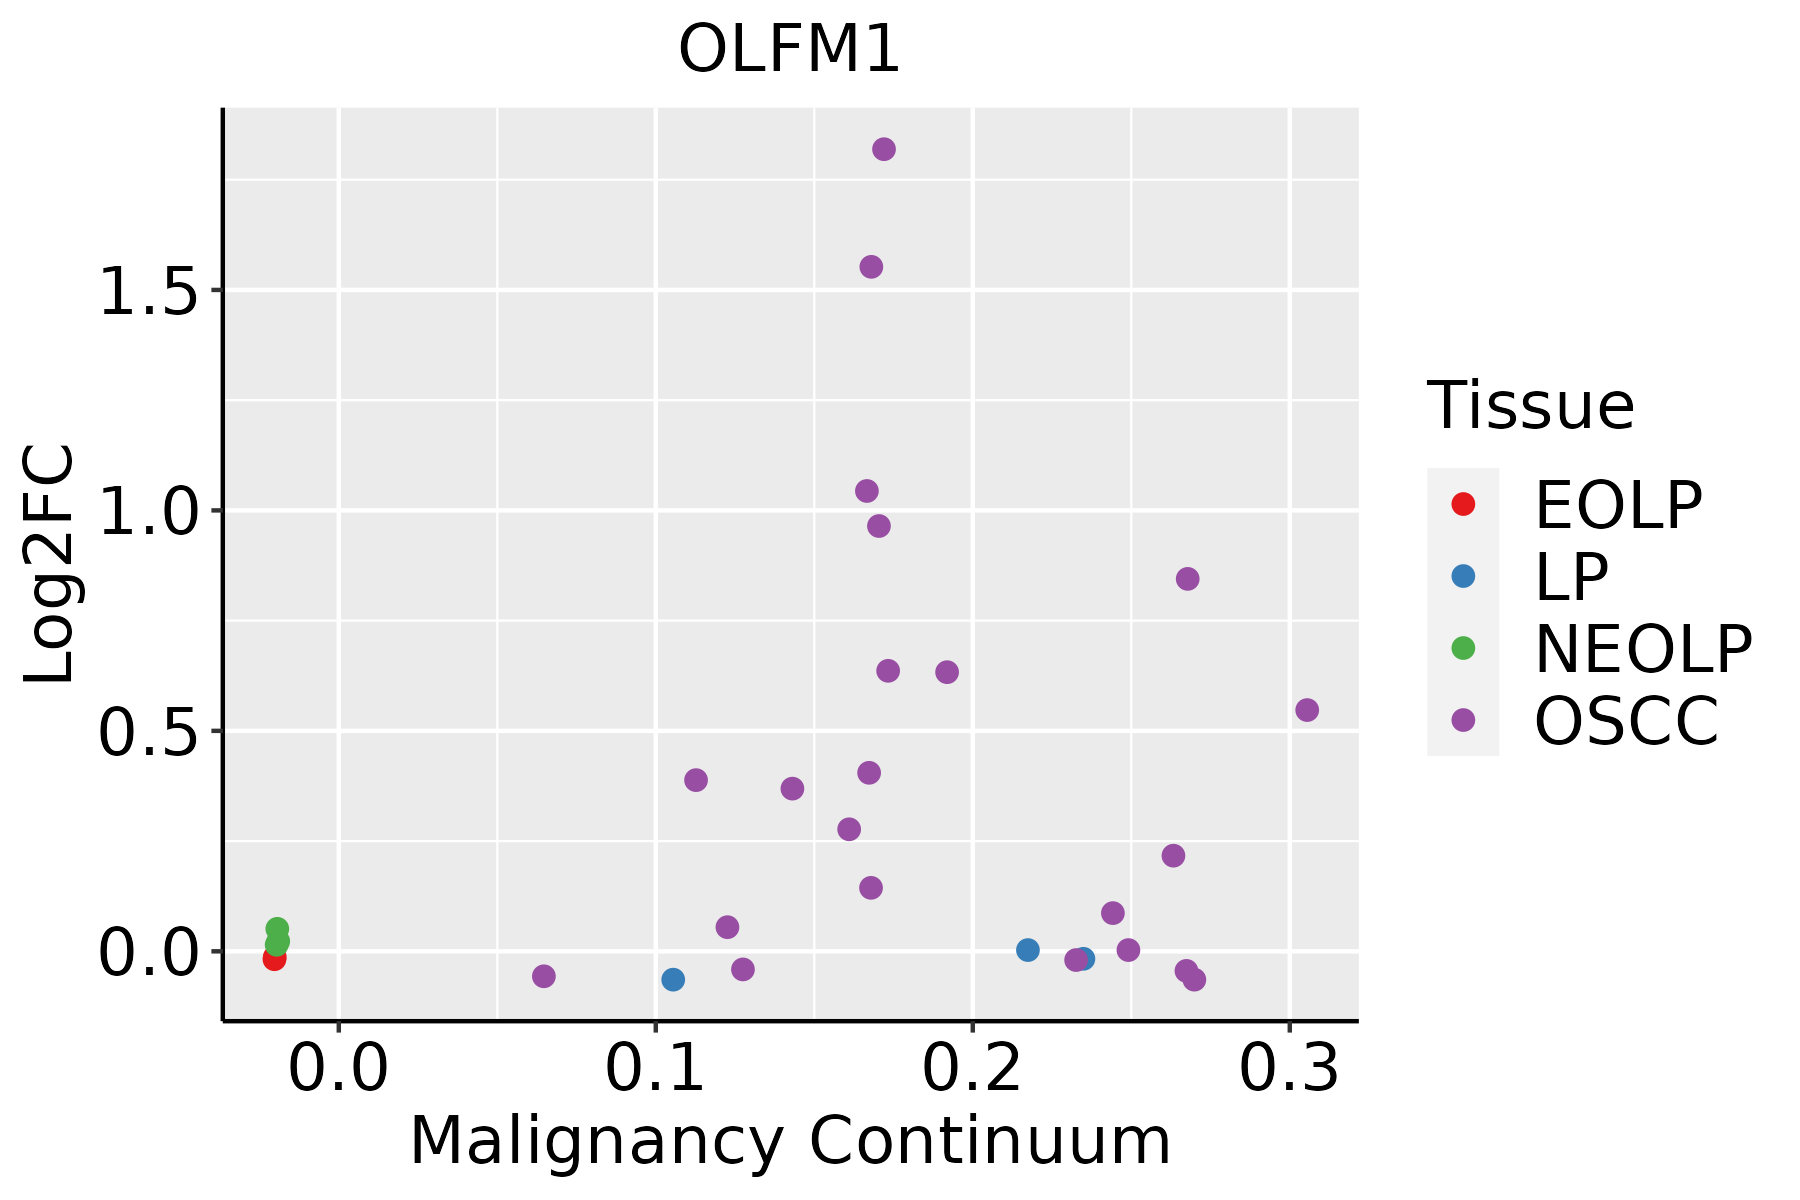 | EOLP: Erosive Oral lichen planus |
| LP: leukoplakia | ||
| NEOLP: Non-erosive oral lichen planus | ||
| OSCC: Oral squamous cell carcinoma |
| ∗log2FC in expression of this searched gene in stem-like cells from each diseased tissue sample relative to stem-like cells in normal samples in each tissue plotted against the malignancy continuum. Samples are colored based on if they are from different disease stage. |
Top |
Malignant transformation related pathway analysis |
| Find out the enriched GO biological processes and KEGG pathways involved in transition from healthy to precancer to cancer |
| Tissue | Disease Stage | Enriched GO biological Processes |
| Colorectum | AD |  |
| Colorectum | SER |  |
| Colorectum | MSS |  |
| Colorectum | MSI-H |  |
| Colorectum | FAP |  |
| ∗Top 15 enriched GO BP terms are showed in the bar plot of each disease state in each tissue. Each row represents a significant GO biological process which is colored according to the -log10(p.adjust). |
| Page: 1 2 3 4 5 6 7 8 9 |
| GO ID | Tissue | Disease Stage | Description | Gene Ratio | Bg Ratio | pvalue | p.adjust | Count |
| GO:0016049110 | Esophagus | ESCC | cell growth | 289/8552 | 482/18723 | 1.29e-10 | 3.77e-09 | 289 |
| GO:000155819 | Esophagus | ESCC | regulation of cell growth | 248/8552 | 414/18723 | 2.97e-09 | 6.45e-08 | 248 |
| GO:003253520 | Esophagus | ESCC | regulation of cellular component size | 227/8552 | 383/18723 | 4.77e-08 | 8.60e-07 | 227 |
| GO:00107184 | Esophagus | ESCC | positive regulation of epithelial to mesenchymal transition | 40/8552 | 52/18723 | 4.25e-06 | 4.56e-05 | 40 |
| GO:00018378 | Esophagus | ESCC | epithelial to mesenchymal transition | 95/8552 | 157/18723 | 1.25e-04 | 8.56e-04 | 95 |
| GO:00083619 | Esophagus | ESCC | regulation of cell size | 107/8552 | 181/18723 | 1.81e-04 | 1.16e-03 | 107 |
| GO:006156415 | Esophagus | ESCC | axon development | 251/8552 | 467/18723 | 2.41e-04 | 1.49e-03 | 251 |
| GO:00487628 | Esophagus | ESCC | mesenchymal cell differentiation | 133/8552 | 236/18723 | 5.94e-04 | 3.22e-03 | 133 |
| GO:006056010 | Esophagus | ESCC | developmental growth involved in morphogenesis | 131/8552 | 234/18723 | 9.28e-04 | 4.73e-03 | 131 |
| GO:00107174 | Esophagus | ESCC | regulation of epithelial to mesenchymal transition | 61/8552 | 99/18723 | 1.01e-03 | 5.09e-03 | 61 |
| GO:000740915 | Esophagus | ESCC | axonogenesis | 219/8552 | 418/18723 | 3.14e-03 | 1.31e-02 | 219 |
| GO:00604856 | Esophagus | ESCC | mesenchyme development | 156/8552 | 291/18723 | 3.76e-03 | 1.53e-02 | 156 |
| GO:004858810 | Esophagus | ESCC | developmental cell growth | 125/8552 | 234/18723 | 1.01e-02 | 3.46e-02 | 125 |
| GO:00031793 | Esophagus | ESCC | heart valve morphogenesis | 34/8552 | 55/18723 | 1.16e-02 | 3.90e-02 | 34 |
| GO:00031703 | Esophagus | ESCC | heart valve development | 39/8552 | 65/18723 | 1.41e-02 | 4.59e-02 | 39 |
| GO:001604917 | Oral cavity | OSCC | cell growth | 268/7305 | 482/18723 | 6.55e-14 | 3.51e-12 | 268 |
| GO:000155816 | Oral cavity | OSCC | regulation of cell growth | 228/7305 | 414/18723 | 1.74e-11 | 6.09e-10 | 228 |
| GO:003253519 | Oral cavity | OSCC | regulation of cellular component size | 201/7305 | 383/18723 | 4.80e-08 | 8.88e-07 | 201 |
| GO:00107183 | Oral cavity | OSCC | positive regulation of epithelial to mesenchymal transition | 35/7305 | 52/18723 | 3.34e-05 | 3.00e-04 | 35 |
| GO:00018377 | Oral cavity | OSCC | epithelial to mesenchymal transition | 82/7305 | 157/18723 | 5.09e-04 | 2.98e-03 | 82 |
| Page: 1 2 |
| Pathway ID | Tissue | Disease Stage | Description | Gene Ratio | Bg Ratio | pvalue | p.adjust | qvalue | Count |
| Page: 1 |
Top |
Cell-cell communication analysis |
| Identification of potential cell-cell interactions between two cell types and their ligand-receptor pairs for different disease states |
| Ligand | Receptor | LRpair | Pathway | Tissue | Disease Stage |
| Page: 1 |
Top |
Single-cell gene regulatory network inference analysis |
| Find out the significant the regulons (TFs) and the target genes of each regulon across cell types for different disease states |
| TF | Cell Type | Tissue | Disease Stage | Target Gene | RSS | Regulon Activity |
| ∗The dot plots of a searched regulon are shown for all cell subpopulations in each disease state of each tissue based on the regulon specific score inferred using pySCENIC and by calculating the average expression. |
| Page: 1 |
Top |
Somatic mutation of malignant transformation related genes |
| Annotation of somatic variants for genes involved in malignant transformation |
| Hugo Symbol | Variant Class | Variant Classification | dbSNP RS | HGVSc | HGVSp | HGVSp Short | SWISSPROT | BIOTYPE | SIFT | PolyPhen | Tumor Sample Barcode | Tissue | Histology | Sex | Age | Stage | Therapy Types | Drugs | Outcome |
| OLFM1 | SNV | Missense_Mutation | c.1040N>G | p.Tyr347Cys | p.Y347C | Q99784 | protein_coding | deleterious(0) | probably_damaging(0.999) | TCGA-D8-A1XK-01 | Breast | breast invasive carcinoma | Female | <65 | I/II | Chemotherapy | doxorubicine+cyclophosphamide | SD | |
| OLFM1 | SNV | Missense_Mutation | c.763N>A | p.Ala255Thr | p.A255T | Q99784 | protein_coding | tolerated(0.34) | possibly_damaging(0.906) | TCGA-2W-A8YY-01 | Cervix | cervical & endocervical cancer | Female | <65 | I/II | Chemotherapy | cisplatin | CR | |
| OLFM1 | SNV | Missense_Mutation | novel | c.15N>C | p.Trp5Cys | p.W5C | Q99784 | protein_coding | deleterious_low_confidence(0.04) | benign(0.024) | TCGA-DG-A2KM-01 | Cervix | cervical & endocervical cancer | Female | <65 | I/II | Chemotherapy | cisplatin | SD |
| OLFM1 | SNV | Missense_Mutation | rs566603017 | c.142N>A | p.Glu48Lys | p.E48K | protein_coding | tolerated_low_confidence(0.67) | benign(0) | TCGA-A6-6653-01 | Colorectum | colon adenocarcinoma | Male | >=65 | I/II | Unknown | Unknown | SD | |
| OLFM1 | SNV | Missense_Mutation | c.815N>A | p.Arg272His | p.R272H | Q99784 | protein_coding | deleterious(0.02) | probably_damaging(0.98) | TCGA-A6-6780-01 | Colorectum | colon adenocarcinoma | Male | >=65 | I/II | Unknown | Unknown | SD | |
| OLFM1 | SNV | Missense_Mutation | c.1249N>T | p.Gly417Cys | p.G417C | Q99784 | protein_coding | deleterious(0) | probably_damaging(1) | TCGA-AA-3672-01 | Colorectum | colon adenocarcinoma | Female | >=65 | III/IV | Unknown | Unknown | SD | |
| OLFM1 | SNV | Missense_Mutation | novel | c.31N>A | p.Val11Met | p.V11M | Q99784 | protein_coding | deleterious_low_confidence(0.01) | benign(0.189) | TCGA-AA-3947-01 | Colorectum | colon adenocarcinoma | Female | <65 | I/II | Unknown | Unknown | SD |
| OLFM1 | SNV | Missense_Mutation | novel | c.314N>C | p.Ile105Thr | p.I105T | protein_coding | deleterious_low_confidence(0.04) | benign(0.003) | TCGA-AA-3977-01 | Colorectum | colon adenocarcinoma | Male | >=65 | I/II | Unknown | Unknown | SD | |
| OLFM1 | SNV | Missense_Mutation | rs767622547 | c.1232N>T | p.Thr411Met | p.T411M | Q99784 | protein_coding | deleterious(0) | probably_damaging(0.999) | TCGA-AA-3994-01 | Colorectum | colon adenocarcinoma | Male | >=65 | III/IV | Chemotherapy | capecitabine | CR |
| OLFM1 | SNV | Missense_Mutation | c.1384T>C | p.Tyr462His | p.Y462H | Q99784 | protein_coding | deleterious(0.02) | benign(0.111) | TCGA-AA-A010-01 | Colorectum | colon adenocarcinoma | Female | <65 | I/II | Chemotherapy | folinic | CR |
| Page: 1 2 3 4 5 6 7 8 9 10 |
Top |
Related drugs of malignant transformation related genes |
| Identification of chemicals and drugs interact with genes involved in malignant transfromation |
| (DGIdb 4.0) |
| Entrez ID | Symbol | Category | Interaction Types | Drug Claim Name | Drug Name | PMIDs |
| Page: 1 |

Copyright 2023-Present -The University of Texas Health Science Center at Houston |