
|
|||||
|
 | |
| |
| |
| |
| |
| |
|
Gene: OGG1 |
Gene summary for OGG1 |
| Gene information | Species | Human | Gene symbol | OGG1 | Gene ID | 4968 |
| Gene name | 8-oxoguanine DNA glycosylase | |
| Gene Alias | HMMH | |
| Cytomap | 3p25.3 | |
| Gene Type | protein-coding | GO ID | GO:0002526 | UniProtAcc | E5KPN1 |
Top |
Malignant transformation analysis |
| Identification of the aberrant gene expression in precancerous and cancerous lesions by comparing the gene expression of stem-like cells in diseased tissues with normal stem cells |
| Entrez ID | Symbol | Replicates | Species | Organ | Tissue | Adj P-value | Log2FC | Malignancy |
| 4968 | OGG1 | NAFLD1 | Human | Liver | NAFLD | 2.88e-02 | 2.72e-01 | -0.04 |
| 4968 | OGG1 | HCC1_Meng | Human | Liver | HCC | 1.45e-28 | 8.13e-03 | 0.0246 |
| 4968 | OGG1 | S014 | Human | Liver | HCC | 1.70e-14 | 6.35e-01 | 0.2254 |
| 4968 | OGG1 | S015 | Human | Liver | HCC | 3.29e-16 | 7.39e-01 | 0.2375 |
| 4968 | OGG1 | S016 | Human | Liver | HCC | 3.06e-23 | 7.75e-01 | 0.2243 |
| 4968 | OGG1 | S027 | Human | Liver | HCC | 7.97e-03 | 3.93e-01 | 0.2446 |
| 4968 | OGG1 | S028 | Human | Liver | HCC | 3.46e-24 | 1.02e+00 | 0.2503 |
| 4968 | OGG1 | S029 | Human | Liver | HCC | 4.85e-13 | 8.87e-01 | 0.2581 |
| 4968 | OGG1 | C04 | Human | Oral cavity | OSCC | 8.55e-08 | 3.25e-01 | 0.2633 |
| 4968 | OGG1 | C21 | Human | Oral cavity | OSCC | 2.51e-12 | 3.51e-01 | 0.2678 |
| 4968 | OGG1 | C30 | Human | Oral cavity | OSCC | 7.88e-18 | 6.95e-01 | 0.3055 |
| 4968 | OGG1 | C43 | Human | Oral cavity | OSCC | 5.88e-03 | 8.58e-02 | 0.1704 |
| 4968 | OGG1 | C46 | Human | Oral cavity | OSCC | 7.67e-12 | 3.18e-01 | 0.1673 |
| 4968 | OGG1 | C51 | Human | Oral cavity | OSCC | 1.69e-02 | 1.75e-01 | 0.2674 |
| 4968 | OGG1 | C06 | Human | Oral cavity | OSCC | 3.20e-03 | 5.11e-01 | 0.2699 |
| 4968 | OGG1 | C08 | Human | Oral cavity | OSCC | 8.25e-06 | 2.00e-01 | 0.1919 |
| 4968 | OGG1 | LN22 | Human | Oral cavity | OSCC | 1.88e-02 | 3.40e-01 | 0.1733 |
| 4968 | OGG1 | LN46 | Human | Oral cavity | OSCC | 1.13e-06 | 3.31e-01 | 0.1666 |
| 4968 | OGG1 | SYSMH3 | Human | Oral cavity | OSCC | 5.57e-09 | 2.25e-01 | 0.2442 |
| Page: 1 |
| Tissue | Expression Dynamics | Abbreviation |
| Liver |  | HCC: Hepatocellular carcinoma |
| NAFLD: Non-alcoholic fatty liver disease | ||
| Oral Cavity | 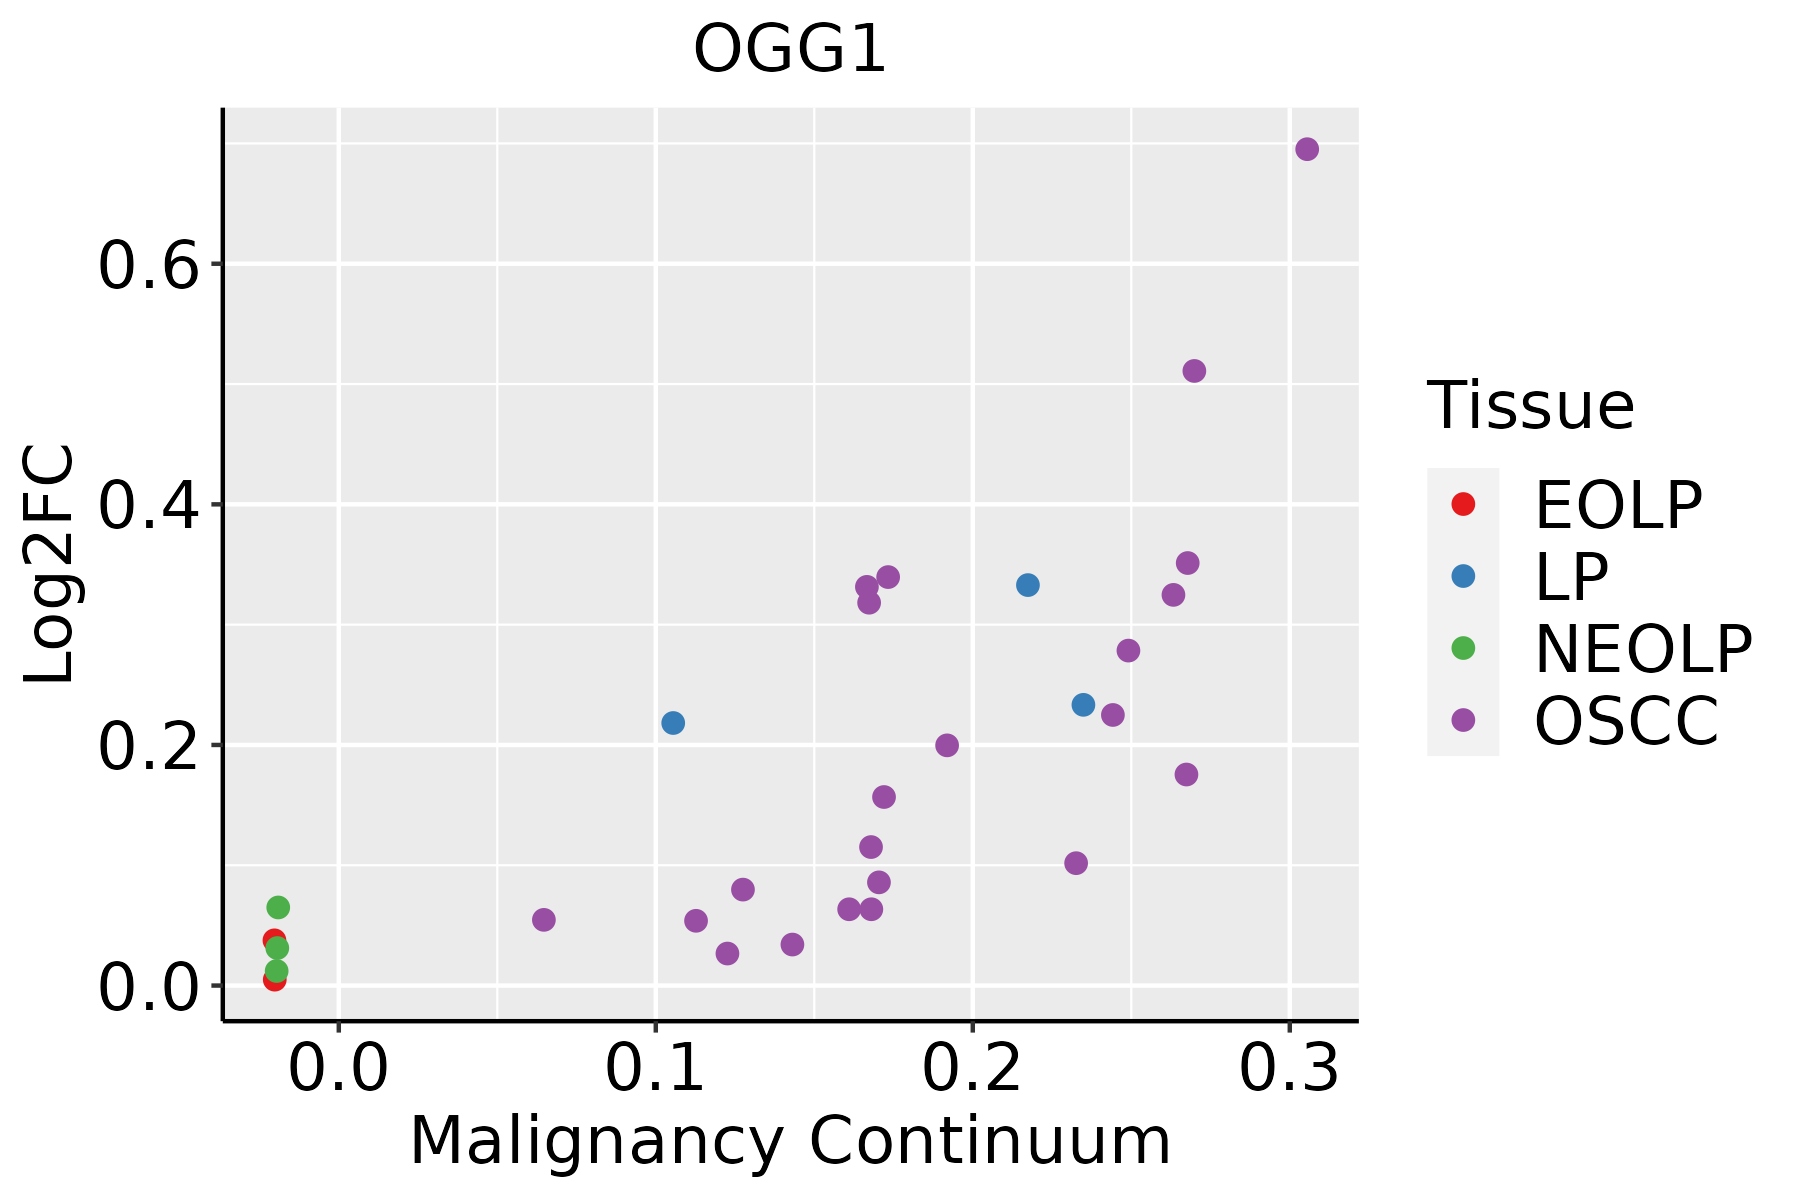 | EOLP: Erosive Oral lichen planus |
| LP: leukoplakia | ||
| NEOLP: Non-erosive oral lichen planus | ||
| OSCC: Oral squamous cell carcinoma |
| ∗log2FC in expression of this searched gene in stem-like cells from each diseased tissue sample relative to stem-like cells in normal samples in each tissue plotted against the malignancy continuum. Samples are colored based on if they are from different disease stage. |
Top |
Malignant transformation related pathway analysis |
| Find out the enriched GO biological processes and KEGG pathways involved in transition from healthy to precancer to cancer |
| Tissue | Disease Stage | Enriched GO biological Processes |
| Colorectum | AD |  |
| Colorectum | SER |  |
| Colorectum | MSS |  |
| Colorectum | MSI-H |  |
| Colorectum | FAP |  |
| ∗Top 15 enriched GO BP terms are showed in the bar plot of each disease state in each tissue. Each row represents a significant GO biological process which is colored according to the -log10(p.adjust). |
| Page: 1 2 3 4 5 6 7 8 9 |
| GO ID | Tissue | Disease Stage | Description | Gene Ratio | Bg Ratio | pvalue | p.adjust | Count |
| GO:00194396 | Liver | NAFLD | aromatic compound catabolic process | 102/1882 | 467/18723 | 2.29e-14 | 1.91e-11 | 102 |
| GO:19013616 | Liver | NAFLD | organic cyclic compound catabolic process | 105/1882 | 495/18723 | 7.04e-14 | 5.15e-11 | 105 |
| GO:00442707 | Liver | NAFLD | cellular nitrogen compound catabolic process | 93/1882 | 451/18723 | 1.04e-11 | 4.34e-09 | 93 |
| GO:00467006 | Liver | NAFLD | heterocycle catabolic process | 92/1882 | 445/18723 | 1.16e-11 | 4.52e-09 | 92 |
| GO:00094107 | Liver | NAFLD | response to xenobiotic stimulus | 88/1882 | 462/18723 | 2.53e-09 | 4.11e-07 | 88 |
| GO:00346556 | Liver | NAFLD | nucleobase-containing compound catabolic process | 80/1882 | 407/18723 | 3.07e-09 | 4.61e-07 | 80 |
| GO:00316677 | Liver | NAFLD | response to nutrient levels | 85/1882 | 474/18723 | 8.23e-08 | 7.09e-06 | 85 |
| GO:00091177 | Liver | NAFLD | nucleotide metabolic process | 85/1882 | 489/18723 | 3.31e-07 | 2.18e-05 | 85 |
| GO:00067537 | Liver | NAFLD | nucleoside phosphate metabolic process | 85/1882 | 497/18723 | 6.69e-07 | 3.83e-05 | 85 |
| GO:00069797 | Liver | NAFLD | response to oxidative stress | 78/1882 | 446/18723 | 7.85e-07 | 4.29e-05 | 78 |
| GO:00075844 | Liver | NAFLD | response to nutrient | 36/1882 | 174/18723 | 2.06e-05 | 5.78e-04 | 36 |
| GO:0002526 | Liver | NAFLD | acute inflammatory response | 26/1882 | 112/18723 | 3.68e-05 | 9.23e-04 | 26 |
| GO:00100387 | Liver | NAFLD | response to metal ion | 62/1882 | 373/18723 | 5.05e-05 | 1.19e-03 | 62 |
| GO:0051053 | Liver | NAFLD | negative regulation of DNA metabolic process | 26/1882 | 125/18723 | 2.52e-04 | 4.12e-03 | 26 |
| GO:00510526 | Liver | NAFLD | regulation of DNA metabolic process | 56/1882 | 359/18723 | 5.95e-04 | 7.92e-03 | 56 |
| GO:00075687 | Liver | NAFLD | aging | 53/1882 | 339/18723 | 7.78e-04 | 9.77e-03 | 53 |
| GO:00973056 | Liver | NAFLD | response to alcohol | 42/1882 | 253/18723 | 7.91e-04 | 9.89e-03 | 42 |
| GO:20010206 | Liver | NAFLD | regulation of response to DNA damage stimulus | 36/1882 | 219/18723 | 2.14e-03 | 2.08e-02 | 36 |
| GO:0046434 | Liver | NAFLD | organophosphate catabolic process | 27/1882 | 155/18723 | 3.21e-03 | 2.86e-02 | 27 |
| GO:00323553 | Liver | NAFLD | response to estradiol | 25/1882 | 141/18723 | 3.51e-03 | 3.01e-02 | 25 |
| Page: 1 2 3 4 5 6 |
| Pathway ID | Tissue | Disease Stage | Description | Gene Ratio | Bg Ratio | pvalue | p.adjust | qvalue | Count |
| hsa03410 | Oral cavity | OSCC | Base excision repair | 32/3704 | 44/8465 | 9.11e-05 | 3.25e-04 | 1.65e-04 | 32 |
| hsa034101 | Oral cavity | OSCC | Base excision repair | 32/3704 | 44/8465 | 9.11e-05 | 3.25e-04 | 1.65e-04 | 32 |
| Page: 1 |
Top |
Cell-cell communication analysis |
| Identification of potential cell-cell interactions between two cell types and their ligand-receptor pairs for different disease states |
| Ligand | Receptor | LRpair | Pathway | Tissue | Disease Stage |
| Page: 1 |
Top |
Single-cell gene regulatory network inference analysis |
| Find out the significant the regulons (TFs) and the target genes of each regulon across cell types for different disease states |
| TF | Cell Type | Tissue | Disease Stage | Target Gene | RSS | Regulon Activity |
| ∗The dot plots of a searched regulon are shown for all cell subpopulations in each disease state of each tissue based on the regulon specific score inferred using pySCENIC and by calculating the average expression. |
| Page: 1 |
Top |
Somatic mutation of malignant transformation related genes |
| Annotation of somatic variants for genes involved in malignant transformation |
| Hugo Symbol | Variant Class | Variant Classification | dbSNP RS | HGVSc | HGVSp | HGVSp Short | SWISSPROT | BIOTYPE | SIFT | PolyPhen | Tumor Sample Barcode | Tissue | Histology | Sex | Age | Stage | Therapy Types | Drugs | Outcome |
| OGG1 | SNV | Missense_Mutation | rs371071998 | c.401N>A | p.Arg134Gln | p.R134Q | O15527 | protein_coding | tolerated(0.06) | benign(0.183) | TCGA-AN-A046-01 | Breast | breast invasive carcinoma | Female | >=65 | I/II | Unknown | Unknown | SD |
| OGG1 | SNV | Missense_Mutation | c.869N>A | p.Gly290Glu | p.G290E | O15527 | protein_coding | tolerated(0.14) | possibly_damaging(0.606) | TCGA-GM-A2DF-01 | Breast | breast invasive carcinoma | Female | <65 | I/II | Chemotherapy | taxol | CR | |
| OGG1 | insertion | Nonsense_Mutation | novel | c.444_445insGGCACATAGTAAGTATTATTACCATTATTATTATCCTGCTAATCACCAT | p.Asn149GlyfsTer3 | p.N149Gfs*3 | O15527 | protein_coding | TCGA-AR-A0TY-01 | Breast | breast invasive carcinoma | Female | <65 | I/II | Unspecific | Paclitaxel | PD | ||
| OGG1 | SNV | Missense_Mutation | novel | c.733N>A | p.Gly245Arg | p.G245R | O15527 | protein_coding | deleterious(0) | probably_damaging(1) | TCGA-AA-3660-01 | Colorectum | colon adenocarcinoma | Female | <65 | I/II | Unknown | Unknown | SD |
| OGG1 | SNV | Missense_Mutation | c.426N>A | p.Phe142Leu | p.F142L | O15527 | protein_coding | tolerated(0.1) | benign(0.414) | TCGA-AA-3977-01 | Colorectum | colon adenocarcinoma | Male | >=65 | I/II | Unknown | Unknown | SD | |
| OGG1 | SNV | Missense_Mutation | c.1085N>A | p.Ser362Asn | p.S362N | O15527 | protein_coding | deleterious_low_confidence(0.02) | benign(0.081) | TCGA-AZ-6598-01 | Colorectum | colon adenocarcinoma | Female | >=65 | I/II | Unknown | Unknown | SD | |
| OGG1 | SNV | Missense_Mutation | rs750447639 | c.854C>T | p.Thr285Met | p.T285M | O15527 | protein_coding | tolerated(0.13) | benign(0.001) | TCGA-F4-6570-01 | Colorectum | colon adenocarcinoma | Female | >=65 | I/II | Unknown | Unknown | SD |
| OGG1 | SNV | Missense_Mutation | c.416N>G | p.Glu139Gly | p.E139G | O15527 | protein_coding | deleterious(0) | probably_damaging(1) | TCGA-WS-AB45-01 | Colorectum | colon adenocarcinoma | Female | <65 | I/II | Unknown | Unknown | SD | |
| OGG1 | SNV | Missense_Mutation | rs750447639 | c.854C>T | p.Thr285Met | p.T285M | O15527 | protein_coding | tolerated(0.13) | benign(0.001) | TCGA-AJ-A3EK-01 | Endometrium | uterine corpus endometrioid carcinoma | Female | <65 | I/II | Chemotherapy | carboplatin | CR |
| OGG1 | SNV | Missense_Mutation | c.289N>T | p.Arg97Cys | p.R97C | O15527 | protein_coding | deleterious(0.04) | benign(0.001) | TCGA-AP-A051-01 | Endometrium | uterine corpus endometrioid carcinoma | Female | >=65 | I/II | Unknown | Unknown | SD |
| Page: 1 2 3 |
Top |
Related drugs of malignant transformation related genes |
| Identification of chemicals and drugs interact with genes involved in malignant transfromation |
| (DGIdb 4.0) |
| Entrez ID | Symbol | Category | Interaction Types | Drug Claim Name | Drug Name | PMIDs |
| 4968 | OGG1 | ENZYME | CAFFEINE | CAFFEINE | 18557781 | |
| 4968 | OGG1 | ENZYME | inhibitor | 381118894 | ||
| 4968 | OGG1 | ENZYME | SELENIUM | 16759981 |
| Page: 1 |

Copyright 2023-Present -The University of Texas Health Science Center at Houston |