
|
|||||
|
 | |
| |
| |
| |
| |
| |
|
Gene: OGFR |
Gene summary for OGFR |
| Gene information | Species | Human | Gene symbol | OGFR | Gene ID | 11054 |
| Gene name | opioid growth factor receptor | |
| Gene Alias | OGFR | |
| Cytomap | 20q13.33 | |
| Gene Type | protein-coding | GO ID | GO:0001558 | UniProtAcc | Q9NZT2 |
Top |
Malignant transformation analysis |
| Identification of the aberrant gene expression in precancerous and cancerous lesions by comparing the gene expression of stem-like cells in diseased tissues with normal stem cells |
| Entrez ID | Symbol | Replicates | Species | Organ | Tissue | Adj P-value | Log2FC | Malignancy |
| 11054 | OGFR | LZE4T | Human | Esophagus | ESCC | 9.19e-07 | 1.15e-01 | 0.0811 |
| 11054 | OGFR | LZE8T | Human | Esophagus | ESCC | 7.84e-04 | 1.10e-01 | 0.067 |
| 11054 | OGFR | LZE20T | Human | Esophagus | ESCC | 1.33e-10 | 3.96e-01 | 0.0662 |
| 11054 | OGFR | LZE24T | Human | Esophagus | ESCC | 8.86e-33 | 8.43e-01 | 0.0596 |
| 11054 | OGFR | LZE22D3 | Human | Esophagus | HGIN | 3.70e-02 | 3.73e-01 | 0.0653 |
| 11054 | OGFR | LZE21T | Human | Esophagus | ESCC | 3.83e-10 | 4.98e-01 | 0.0655 |
| 11054 | OGFR | P1T-E | Human | Esophagus | ESCC | 7.43e-08 | 5.02e-01 | 0.0875 |
| 11054 | OGFR | P2T-E | Human | Esophagus | ESCC | 1.15e-46 | 7.39e-01 | 0.1177 |
| 11054 | OGFR | P4T-E | Human | Esophagus | ESCC | 2.04e-12 | 3.36e-01 | 0.1323 |
| 11054 | OGFR | P5T-E | Human | Esophagus | ESCC | 6.07e-25 | 4.07e-01 | 0.1327 |
| 11054 | OGFR | P8T-E | Human | Esophagus | ESCC | 3.79e-20 | 3.96e-01 | 0.0889 |
| 11054 | OGFR | P9T-E | Human | Esophagus | ESCC | 4.88e-22 | 5.39e-01 | 0.1131 |
| 11054 | OGFR | P10T-E | Human | Esophagus | ESCC | 2.59e-23 | 3.87e-01 | 0.116 |
| 11054 | OGFR | P11T-E | Human | Esophagus | ESCC | 1.70e-28 | 1.01e+00 | 0.1426 |
| 11054 | OGFR | P12T-E | Human | Esophagus | ESCC | 9.19e-33 | 7.12e-01 | 0.1122 |
| 11054 | OGFR | P15T-E | Human | Esophagus | ESCC | 2.23e-28 | 6.18e-01 | 0.1149 |
| 11054 | OGFR | P16T-E | Human | Esophagus | ESCC | 2.99e-36 | 7.16e-01 | 0.1153 |
| 11054 | OGFR | P17T-E | Human | Esophagus | ESCC | 8.28e-17 | 8.46e-01 | 0.1278 |
| 11054 | OGFR | P19T-E | Human | Esophagus | ESCC | 3.36e-08 | 7.89e-01 | 0.1662 |
| 11054 | OGFR | P20T-E | Human | Esophagus | ESCC | 4.13e-61 | 1.16e+00 | 0.1124 |
| Page: 1 2 3 4 5 6 |
| Tissue | Expression Dynamics | Abbreviation |
| Esophagus | 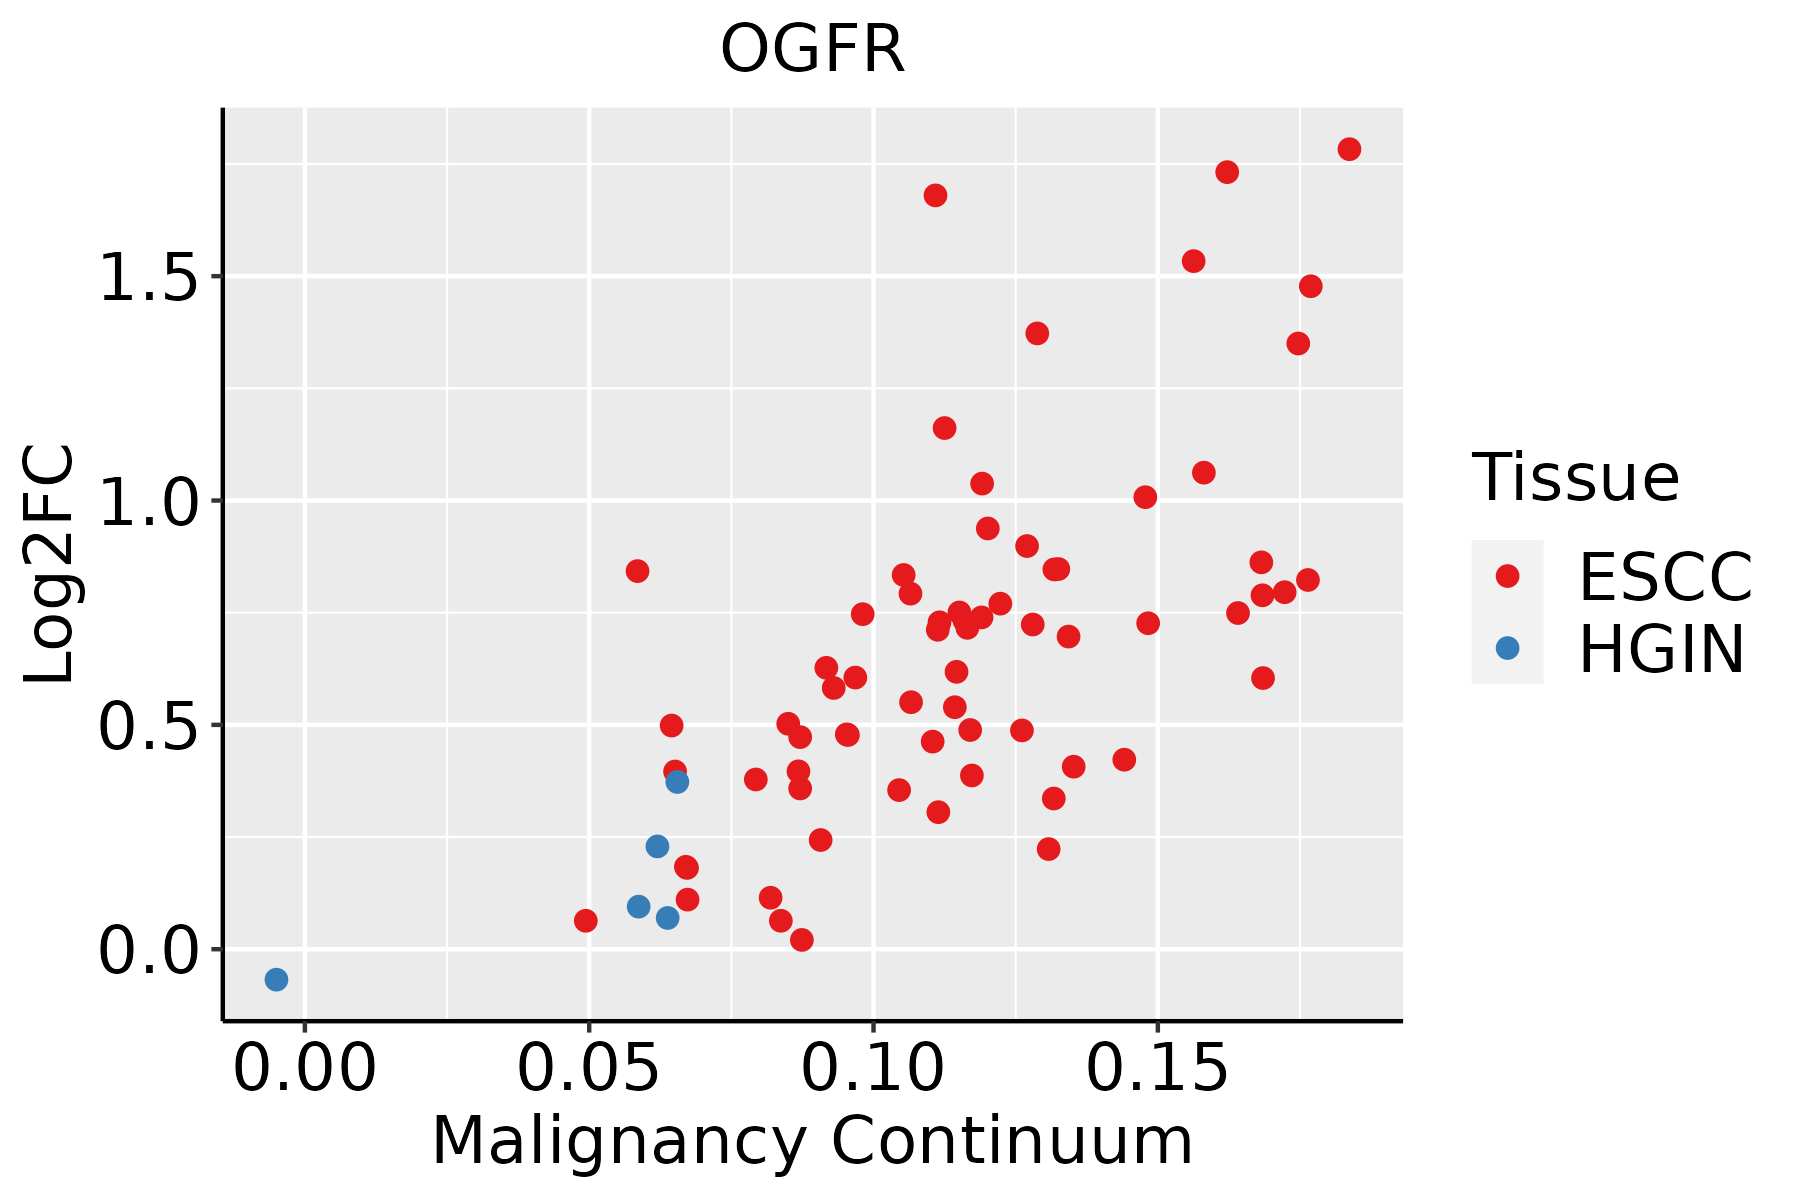 | ESCC: Esophageal squamous cell carcinoma |
| HGIN: High-grade intraepithelial neoplasias | ||
| LGIN: Low-grade intraepithelial neoplasias | ||
| Liver |  | HCC: Hepatocellular carcinoma |
| NAFLD: Non-alcoholic fatty liver disease | ||
| Oral Cavity | 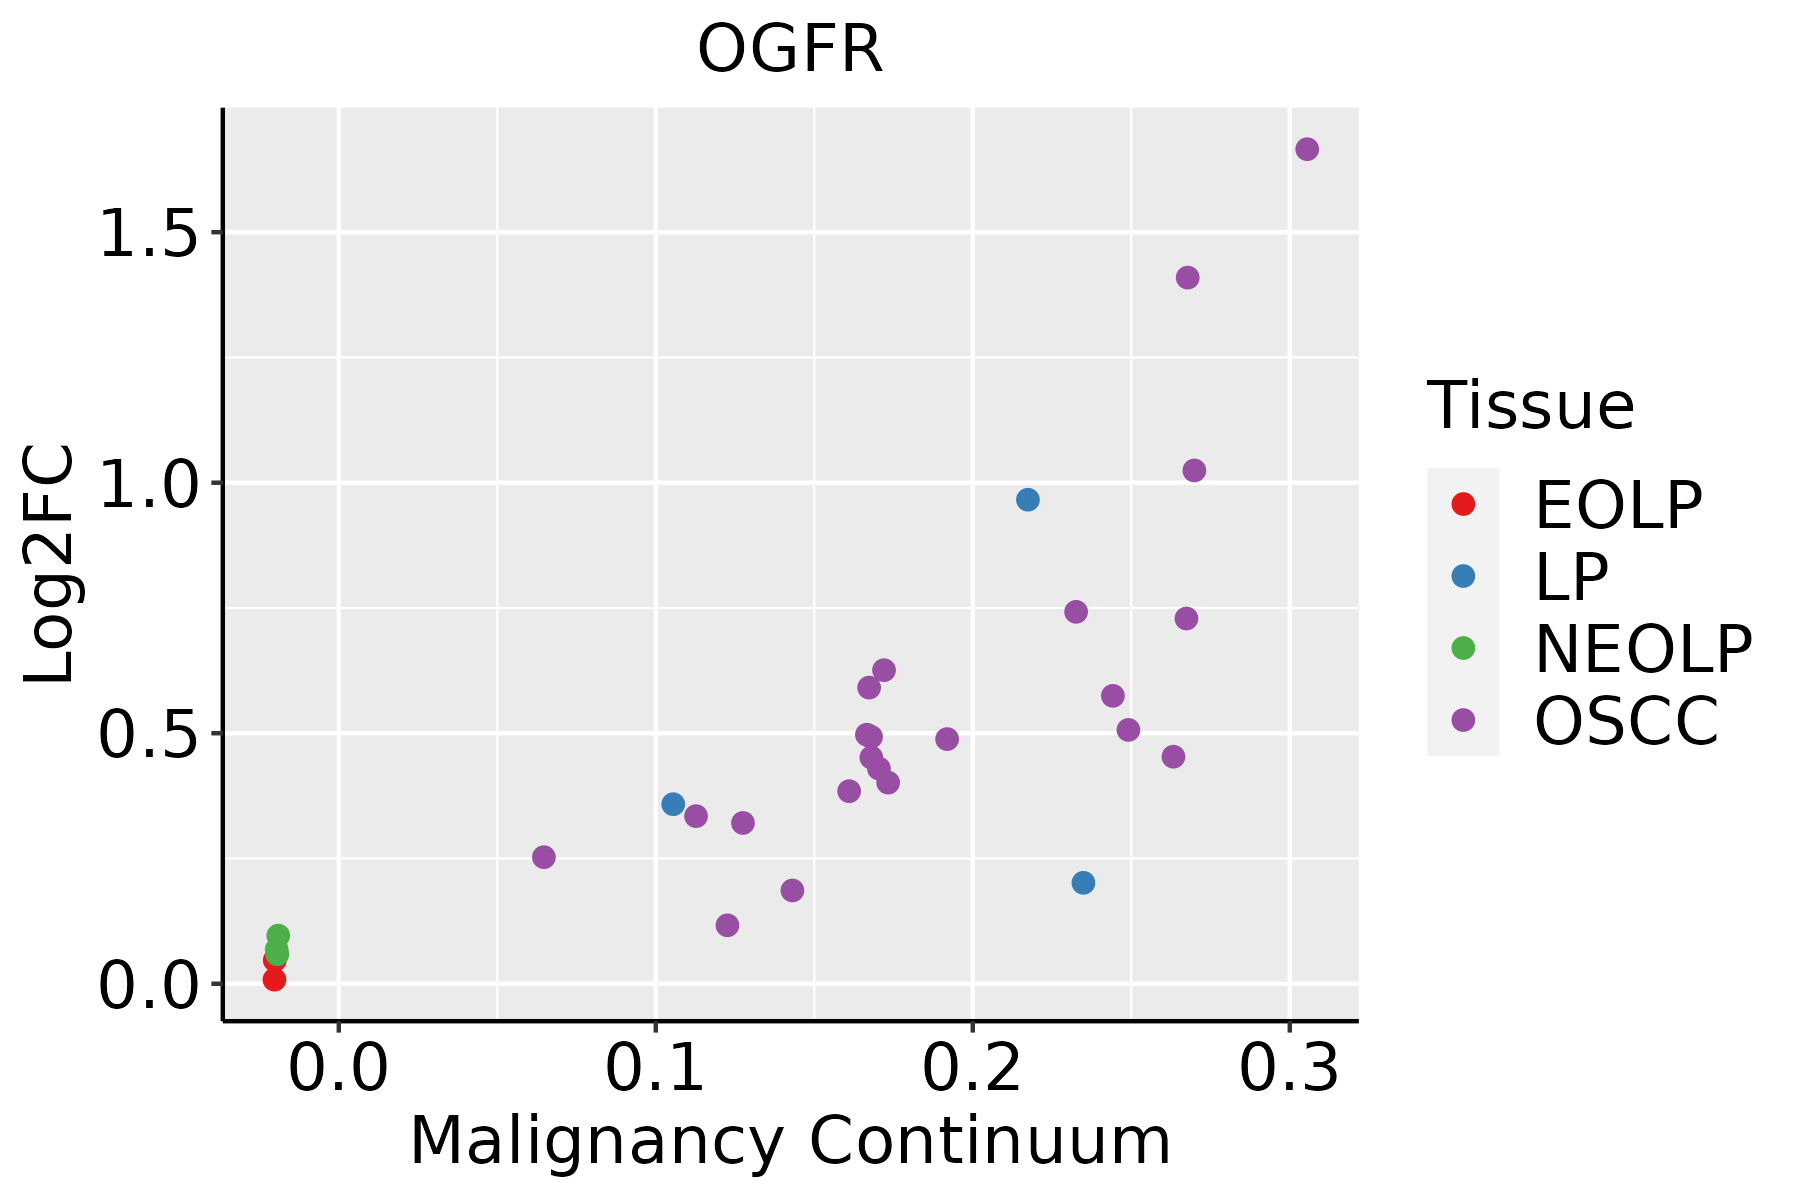 | EOLP: Erosive Oral lichen planus |
| LP: leukoplakia | ||
| NEOLP: Non-erosive oral lichen planus | ||
| OSCC: Oral squamous cell carcinoma | ||
| Skin | 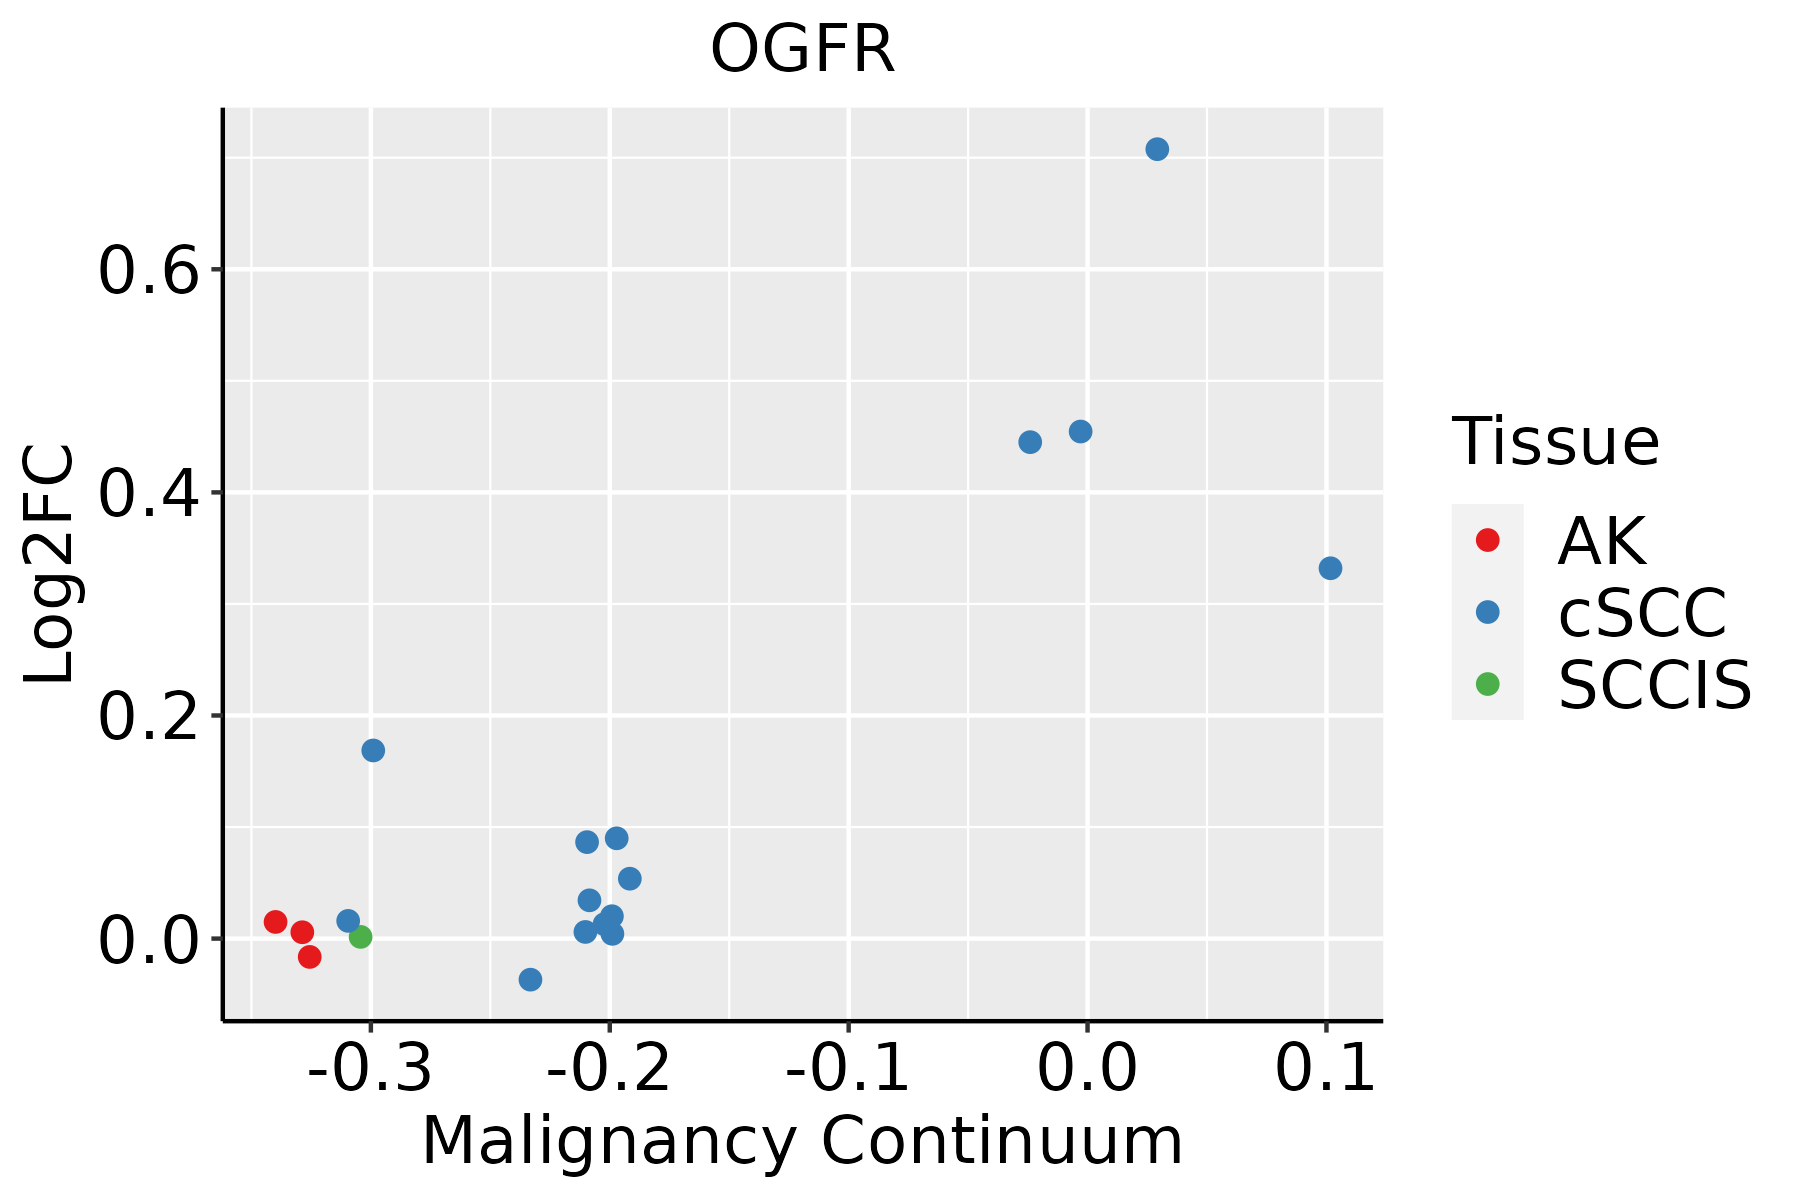 | AK: Actinic keratosis |
| cSCC: Cutaneous squamous cell carcinoma | ||
| SCCIS:squamous cell carcinoma in situ | ||
| Thyroid | 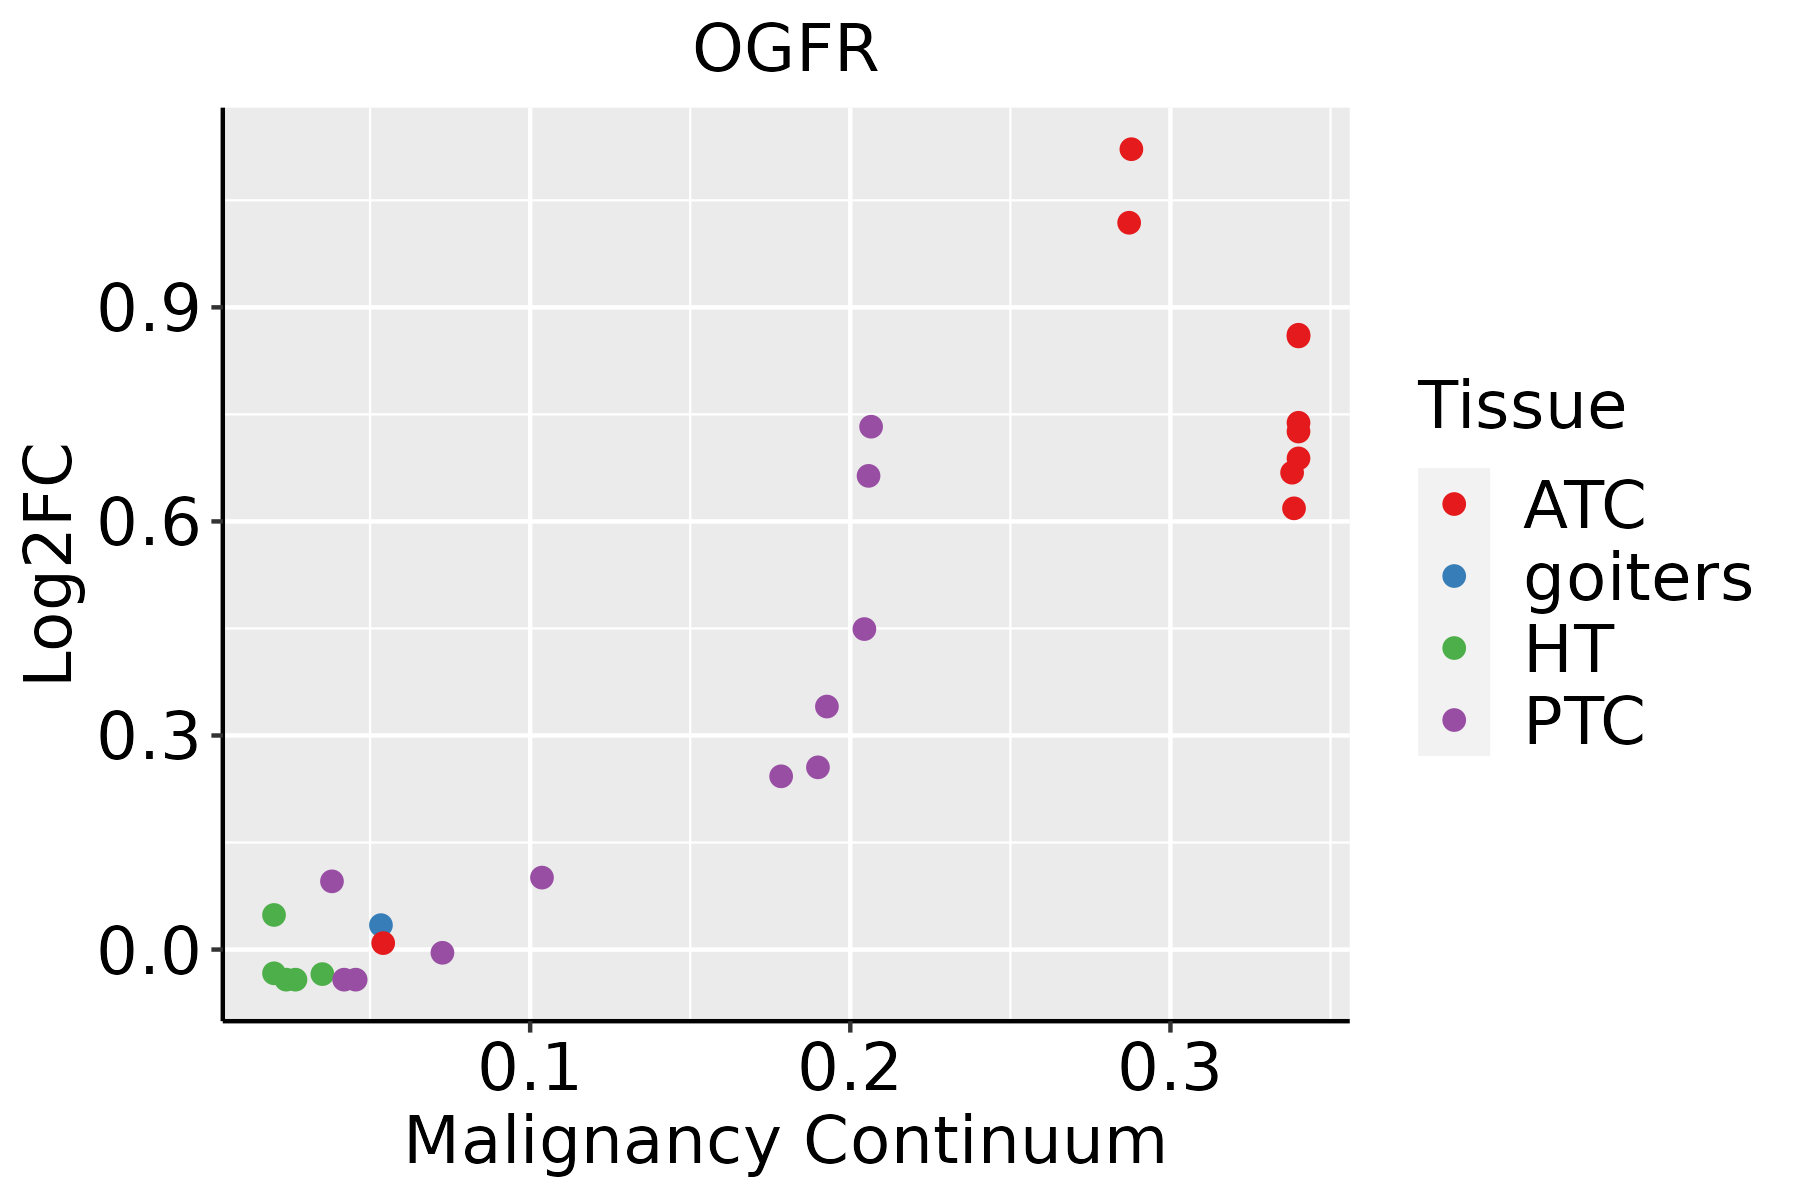 | ATC: Anaplastic thyroid cancer |
| HT: Hashimoto's thyroiditis | ||
| PTC: Papillary thyroid cancer |
| ∗log2FC in expression of this searched gene in stem-like cells from each diseased tissue sample relative to stem-like cells in normal samples in each tissue plotted against the malignancy continuum. Samples are colored based on if they are from different disease stage. |
Top |
Malignant transformation related pathway analysis |
| Find out the enriched GO biological processes and KEGG pathways involved in transition from healthy to precancer to cancer |
| Tissue | Disease Stage | Enriched GO biological Processes |
| Colorectum | AD |  |
| Colorectum | SER |  |
| Colorectum | MSS |  |
| Colorectum | MSI-H |  |
| Colorectum | FAP |  |
| ∗Top 15 enriched GO BP terms are showed in the bar plot of each disease state in each tissue. Each row represents a significant GO biological process which is colored according to the -log10(p.adjust). |
| Page: 1 2 3 4 5 6 7 8 9 |
| GO ID | Tissue | Disease Stage | Description | Gene Ratio | Bg Ratio | pvalue | p.adjust | Count |
| GO:001604919 | Esophagus | HGIN | cell growth | 93/2587 | 482/18723 | 4.49e-04 | 6.62e-03 | 93 |
| GO:000155818 | Esophagus | HGIN | regulation of cell growth | 76/2587 | 414/18723 | 5.40e-03 | 4.42e-02 | 76 |
| GO:0016049110 | Esophagus | ESCC | cell growth | 289/8552 | 482/18723 | 1.29e-10 | 3.77e-09 | 289 |
| GO:000155819 | Esophagus | ESCC | regulation of cell growth | 248/8552 | 414/18723 | 2.97e-09 | 6.45e-08 | 248 |
| GO:001604911 | Liver | Cirrhotic | cell growth | 160/4634 | 482/18723 | 1.50e-05 | 2.07e-04 | 160 |
| GO:000155811 | Liver | Cirrhotic | regulation of cell growth | 132/4634 | 414/18723 | 5.53e-04 | 4.36e-03 | 132 |
| GO:001604921 | Liver | HCC | cell growth | 269/7958 | 482/18723 | 1.84e-09 | 5.35e-08 | 269 |
| GO:000155821 | Liver | HCC | regulation of cell growth | 228/7958 | 414/18723 | 1.34e-07 | 2.55e-06 | 228 |
| GO:001604917 | Oral cavity | OSCC | cell growth | 268/7305 | 482/18723 | 6.55e-14 | 3.51e-12 | 268 |
| GO:000155816 | Oral cavity | OSCC | regulation of cell growth | 228/7305 | 414/18723 | 1.74e-11 | 6.09e-10 | 228 |
| GO:001604918 | Oral cavity | LP | cell growth | 155/4623 | 482/18723 | 1.08e-04 | 1.31e-03 | 155 |
| GO:000155817 | Oral cavity | LP | regulation of cell growth | 134/4623 | 414/18723 | 2.25e-04 | 2.41e-03 | 134 |
| GO:001604925 | Skin | cSCC | cell growth | 173/4864 | 482/18723 | 7.21e-07 | 1.34e-05 | 173 |
| GO:000155824 | Skin | cSCC | regulation of cell growth | 140/4864 | 414/18723 | 2.07e-04 | 1.72e-03 | 140 |
| GO:0016049112 | Thyroid | PTC | cell growth | 225/5968 | 482/18723 | 4.75e-12 | 2.07e-10 | 225 |
| GO:0001558111 | Thyroid | PTC | regulation of cell growth | 188/5968 | 414/18723 | 4.13e-09 | 1.09e-07 | 188 |
| GO:001604927 | Thyroid | ATC | cell growth | 241/6293 | 482/18723 | 4.27e-14 | 2.35e-12 | 241 |
| GO:000155826 | Thyroid | ATC | regulation of cell growth | 201/6293 | 414/18723 | 1.57e-10 | 4.76e-09 | 201 |
| Page: 1 |
| Pathway ID | Tissue | Disease Stage | Description | Gene Ratio | Bg Ratio | pvalue | p.adjust | qvalue | Count |
| Page: 1 |
Top |
Cell-cell communication analysis |
| Identification of potential cell-cell interactions between two cell types and their ligand-receptor pairs for different disease states |
| Ligand | Receptor | LRpair | Pathway | Tissue | Disease Stage |
| Page: 1 |
Top |
Single-cell gene regulatory network inference analysis |
| Find out the significant the regulons (TFs) and the target genes of each regulon across cell types for different disease states |
| TF | Cell Type | Tissue | Disease Stage | Target Gene | RSS | Regulon Activity |
| ∗The dot plots of a searched regulon are shown for all cell subpopulations in each disease state of each tissue based on the regulon specific score inferred using pySCENIC and by calculating the average expression. |
| Page: 1 |
Top |
Somatic mutation of malignant transformation related genes |
| Annotation of somatic variants for genes involved in malignant transformation |
| Hugo Symbol | Variant Class | Variant Classification | dbSNP RS | HGVSc | HGVSp | HGVSp Short | SWISSPROT | BIOTYPE | SIFT | PolyPhen | Tumor Sample Barcode | Tissue | Histology | Sex | Age | Stage | Therapy Types | Drugs | Outcome |
| OGFR | deletion | Frame_Shift_Del | novel | c.276delN | p.Asn93ThrfsTer2 | p.N93Tfs*2 | Q9NZT2 | protein_coding | TCGA-EW-A2FV-01 | Breast | breast invasive carcinoma | Female | <65 | III/IV | Chemotherapy | docetaxel | SD | ||
| OGFR | SNV | Missense_Mutation | rs774947493 | c.877N>T | p.Arg293Trp | p.R293W | Q9NZT2 | protein_coding | deleterious(0) | probably_damaging(0.981) | TCGA-2W-A8YY-01 | Cervix | cervical & endocervical cancer | Female | <65 | I/II | Chemotherapy | cisplatin | CR |
| OGFR | SNV | Missense_Mutation | rs749941602 | c.1409N>T | p.Ala470Val | p.A470V | Q9NZT2 | protein_coding | tolerated(0.53) | benign(0) | TCGA-2W-A8YY-01 | Cervix | cervical & endocervical cancer | Female | <65 | I/II | Chemotherapy | cisplatin | CR |
| OGFR | SNV | Missense_Mutation | c.799C>T | p.Arg267Cys | p.R267C | Q9NZT2 | protein_coding | deleterious(0) | probably_damaging(0.973) | TCGA-AA-3496-01 | Colorectum | colon adenocarcinoma | Female | >=65 | I/II | Unknown | Unknown | SD | |
| OGFR | SNV | Missense_Mutation | rs564432812 | c.1231G>A | p.Ala411Thr | p.A411T | Q9NZT2 | protein_coding | deleterious(0) | possibly_damaging(0.484) | TCGA-AA-A010-01 | Colorectum | colon adenocarcinoma | Female | <65 | I/II | Chemotherapy | folinic | CR |
| OGFR | SNV | Missense_Mutation | c.980N>A | p.Gly327Asp | p.G327D | Q9NZT2 | protein_coding | tolerated(0.14) | possibly_damaging(0.673) | TCGA-CM-4743-01 | Colorectum | colon adenocarcinoma | Male | >=65 | I/II | Chemotherapy | capecitabine | SD | |
| OGFR | SNV | Missense_Mutation | rs777605843 | c.731G>A | p.Arg244Gln | p.R244Q | Q9NZT2 | protein_coding | tolerated(0.6) | benign(0.001) | TCGA-F4-6570-01 | Colorectum | colon adenocarcinoma | Female | >=65 | I/II | Unknown | Unknown | SD |
| OGFR | SNV | Missense_Mutation | rs373078338 | c.964G>A | p.Glu322Lys | p.E322K | Q9NZT2 | protein_coding | tolerated(0.34) | benign(0.001) | TCGA-EI-6917-01 | Colorectum | rectum adenocarcinoma | Male | <65 | III/IV | Chemotherapy | 5fluorouracil+oxaciplatina+l-folinian | SD |
| OGFR | deletion | Frame_Shift_Del | c.1971delN | p.Glu659ArgfsTer55 | p.E659Rfs*55 | Q9NZT2 | protein_coding | TCGA-AZ-6598-01 | Colorectum | colon adenocarcinoma | Female | >=65 | I/II | Unknown | Unknown | SD | |||
| OGFR | SNV | Missense_Mutation | novel | c.1921N>G | p.Thr641Ala | p.T641A | Q9NZT2 | protein_coding | deleterious_low_confidence(0.03) | benign(0.056) | TCGA-A5-A1OF-01 | Endometrium | uterine corpus endometrioid carcinoma | Female | <65 | I/II | Unknown | Unknown | SD |
| Page: 1 2 3 4 |
Top |
Related drugs of malignant transformation related genes |
| Identification of chemicals and drugs interact with genes involved in malignant transfromation |
| (DGIdb 4.0) |
| Entrez ID | Symbol | Category | Interaction Types | Drug Claim Name | Drug Name | PMIDs |
| 11054 | OGFR | NA | INNO-105 | |||
| 11054 | OGFR | NA | IRT-102 |
| Page: 1 |

Copyright 2023-Present -The University of Texas Health Science Center at Houston |