
|
|||||
|
 | |
| |
| |
| |
| |
| |
|
Gene: OGFOD3 |
Gene summary for OGFOD3 |
| Gene information | Species | Human | Gene symbol | OGFOD3 | Gene ID | 79701 |
| Gene name | 2-oxoglutarate and iron dependent oxygenase domain containing 3 | |
| Gene Alias | C17orf101 | |
| Cytomap | 17q25.3 | |
| Gene Type | protein-coding | GO ID | GO:0005575 | UniProtAcc | Q6PK18 |
Top |
Malignant transformation analysis |
| Identification of the aberrant gene expression in precancerous and cancerous lesions by comparing the gene expression of stem-like cells in diseased tissues with normal stem cells |
| Entrez ID | Symbol | Replicates | Species | Organ | Tissue | Adj P-value | Log2FC | Malignancy |
| 79701 | OGFOD3 | LZE7T | Human | Esophagus | ESCC | 6.35e-03 | 2.00e-01 | 0.0667 |
| 79701 | OGFOD3 | LZE20T | Human | Esophagus | ESCC | 3.33e-05 | 6.90e-02 | 0.0662 |
| 79701 | OGFOD3 | LZE22T | Human | Esophagus | ESCC | 4.16e-03 | 1.96e-01 | 0.068 |
| 79701 | OGFOD3 | LZE24T | Human | Esophagus | ESCC | 9.40e-15 | 2.46e-01 | 0.0596 |
| 79701 | OGFOD3 | LZE21T | Human | Esophagus | ESCC | 1.01e-05 | 3.45e-01 | 0.0655 |
| 79701 | OGFOD3 | P1T-E | Human | Esophagus | ESCC | 2.83e-05 | 2.64e-01 | 0.0875 |
| 79701 | OGFOD3 | P2T-E | Human | Esophagus | ESCC | 3.54e-22 | 3.20e-01 | 0.1177 |
| 79701 | OGFOD3 | P4T-E | Human | Esophagus | ESCC | 3.77e-11 | 2.38e-01 | 0.1323 |
| 79701 | OGFOD3 | P5T-E | Human | Esophagus | ESCC | 4.23e-16 | 2.64e-01 | 0.1327 |
| 79701 | OGFOD3 | P8T-E | Human | Esophagus | ESCC | 1.39e-13 | 2.79e-01 | 0.0889 |
| 79701 | OGFOD3 | P9T-E | Human | Esophagus | ESCC | 6.04e-15 | 2.66e-01 | 0.1131 |
| 79701 | OGFOD3 | P10T-E | Human | Esophagus | ESCC | 3.25e-40 | 5.60e-01 | 0.116 |
| 79701 | OGFOD3 | P11T-E | Human | Esophagus | ESCC | 1.35e-27 | 1.05e+00 | 0.1426 |
| 79701 | OGFOD3 | P12T-E | Human | Esophagus | ESCC | 8.17e-18 | 2.53e-01 | 0.1122 |
| 79701 | OGFOD3 | P15T-E | Human | Esophagus | ESCC | 7.41e-22 | 4.06e-01 | 0.1149 |
| 79701 | OGFOD3 | P16T-E | Human | Esophagus | ESCC | 6.58e-40 | 7.12e-01 | 0.1153 |
| 79701 | OGFOD3 | P17T-E | Human | Esophagus | ESCC | 1.26e-10 | 4.38e-01 | 0.1278 |
| 79701 | OGFOD3 | P19T-E | Human | Esophagus | ESCC | 7.18e-11 | 3.50e-01 | 0.1662 |
| 79701 | OGFOD3 | P20T-E | Human | Esophagus | ESCC | 3.93e-07 | 3.02e-02 | 0.1124 |
| 79701 | OGFOD3 | P21T-E | Human | Esophagus | ESCC | 4.85e-51 | 9.01e-01 | 0.1617 |
| Page: 1 2 3 4 5 6 |
| Tissue | Expression Dynamics | Abbreviation |
| Esophagus | 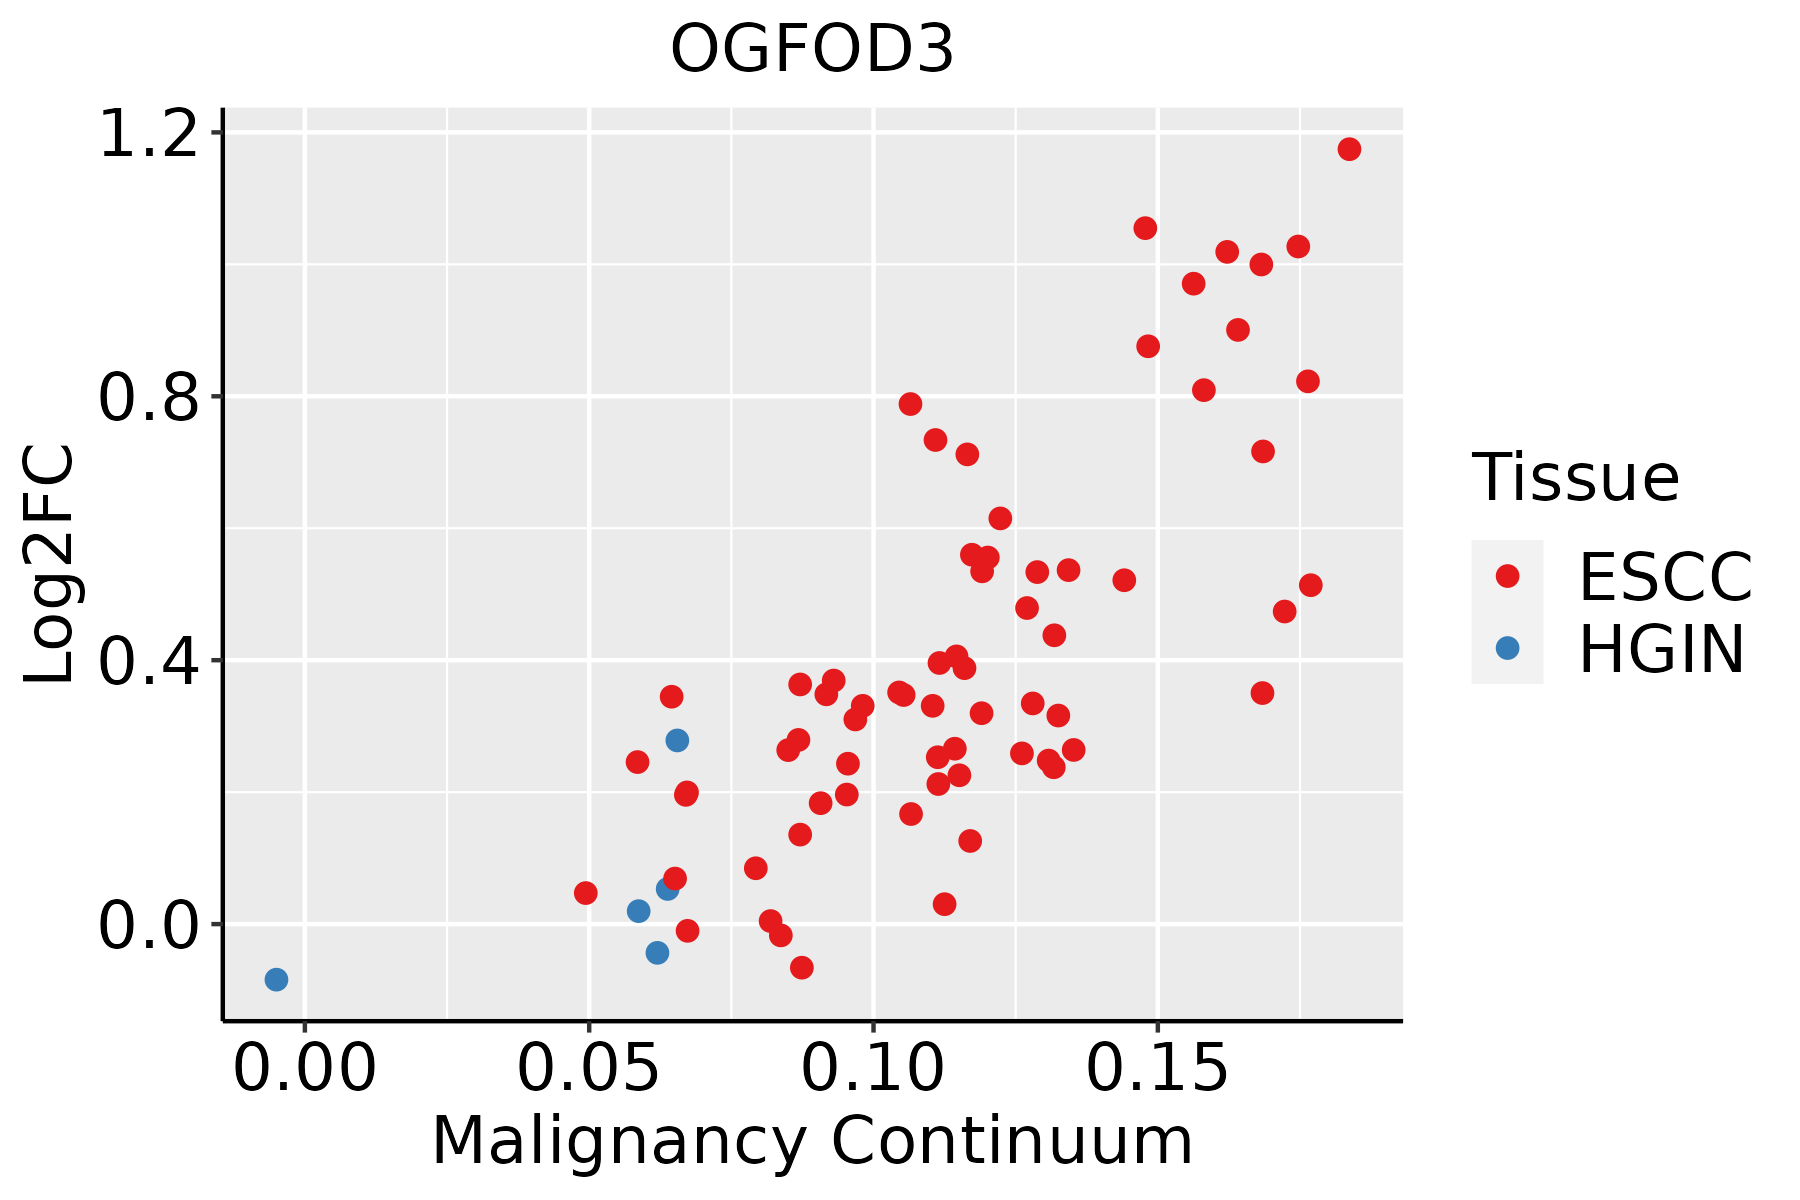 | ESCC: Esophageal squamous cell carcinoma |
| HGIN: High-grade intraepithelial neoplasias | ||
| LGIN: Low-grade intraepithelial neoplasias | ||
| Liver |  | HCC: Hepatocellular carcinoma |
| NAFLD: Non-alcoholic fatty liver disease | ||
| Oral Cavity | 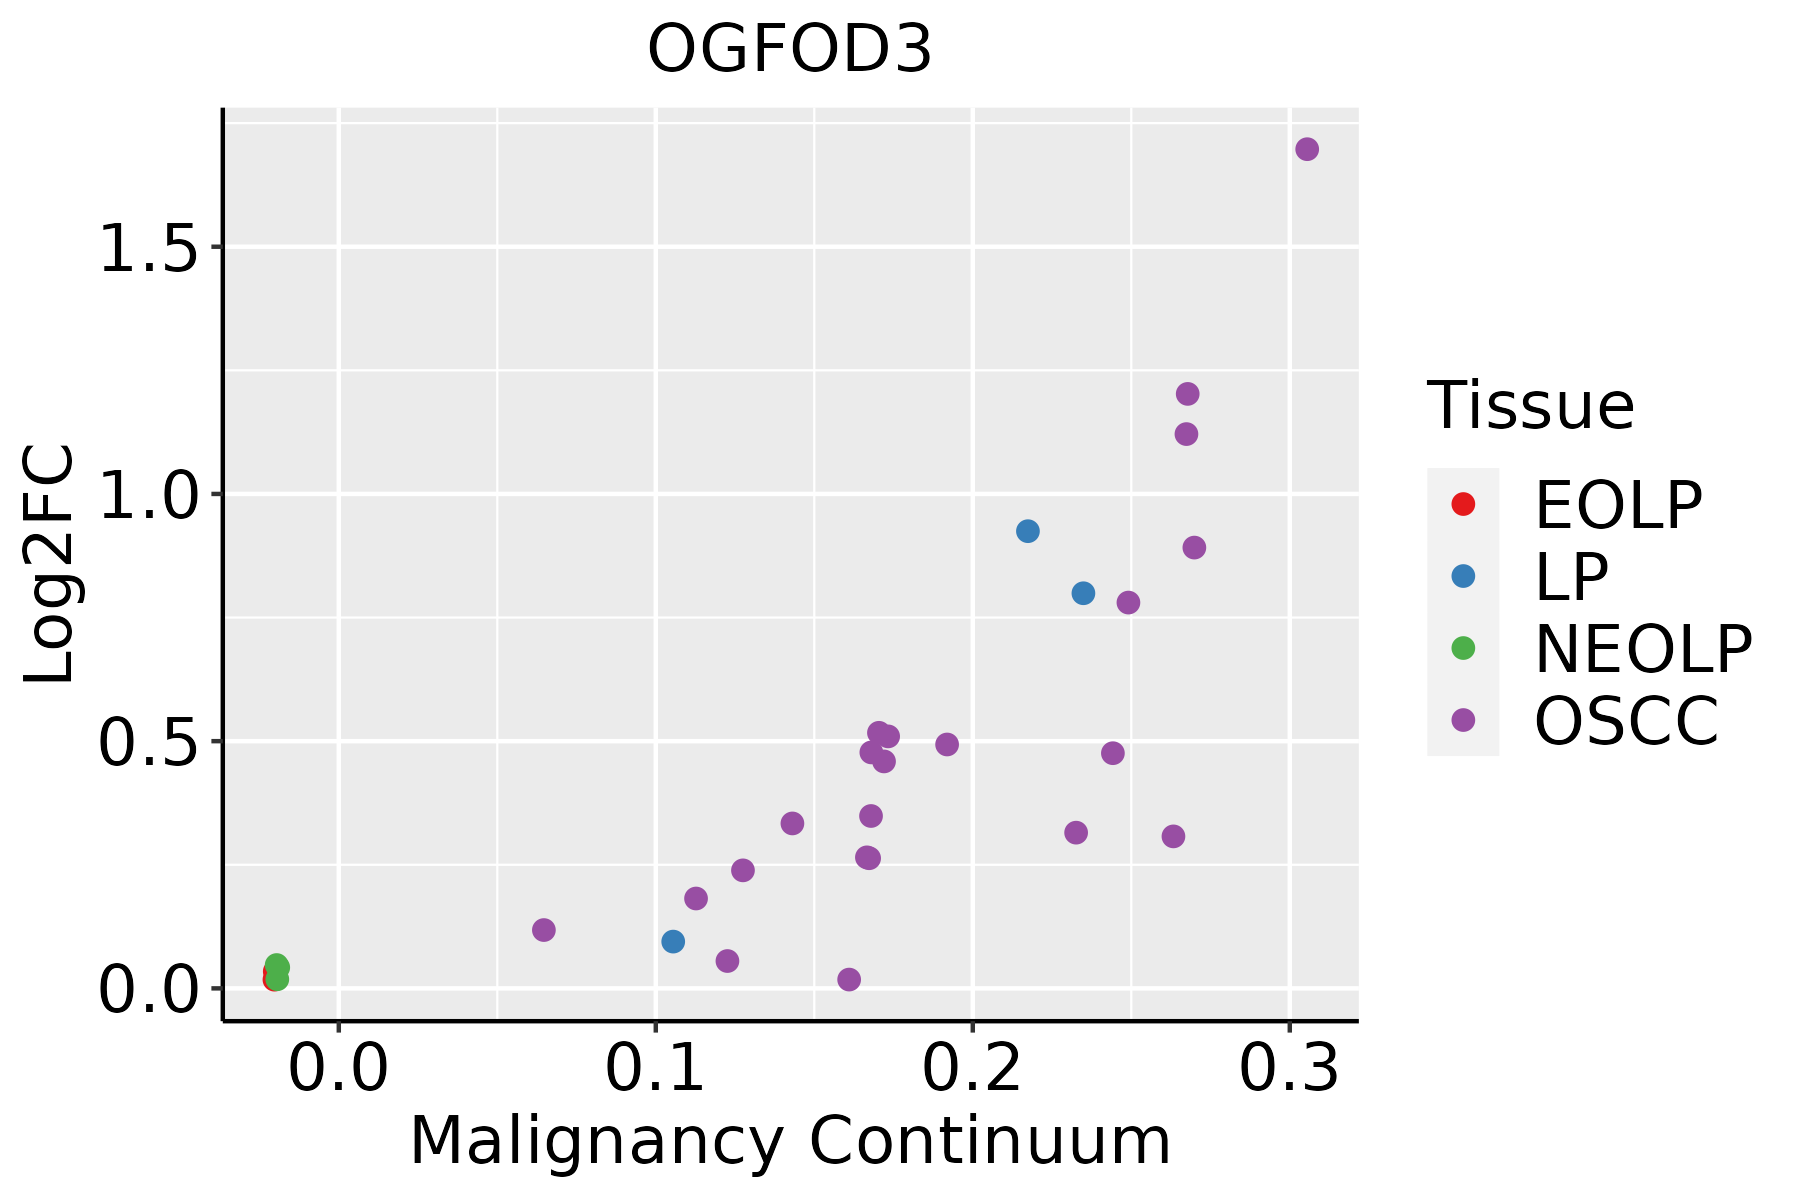 | EOLP: Erosive Oral lichen planus |
| LP: leukoplakia | ||
| NEOLP: Non-erosive oral lichen planus | ||
| OSCC: Oral squamous cell carcinoma | ||
| Skin |  | AK: Actinic keratosis |
| cSCC: Cutaneous squamous cell carcinoma | ||
| SCCIS:squamous cell carcinoma in situ | ||
| Thyroid |  | ATC: Anaplastic thyroid cancer |
| HT: Hashimoto's thyroiditis | ||
| PTC: Papillary thyroid cancer |
| ∗log2FC in expression of this searched gene in stem-like cells from each diseased tissue sample relative to stem-like cells in normal samples in each tissue plotted against the malignancy continuum. Samples are colored based on if they are from different disease stage. |
Top |
Malignant transformation related pathway analysis |
| Find out the enriched GO biological processes and KEGG pathways involved in transition from healthy to precancer to cancer |
| Tissue | Disease Stage | Enriched GO biological Processes |
| Colorectum | AD |  |
| Colorectum | SER |  |
| Colorectum | MSS |  |
| Colorectum | MSI-H |  |
| Colorectum | FAP |  |
| ∗Top 15 enriched GO BP terms are showed in the bar plot of each disease state in each tissue. Each row represents a significant GO biological process which is colored according to the -log10(p.adjust). |
| Page: 1 2 3 4 5 6 7 8 9 |
| GO ID | Tissue | Disease Stage | Description | Gene Ratio | Bg Ratio | pvalue | p.adjust | Count |
| Page: 1 |
| Pathway ID | Tissue | Disease Stage | Description | Gene Ratio | Bg Ratio | pvalue | p.adjust | qvalue | Count |
| Page: 1 |
Top |
Cell-cell communication analysis |
| Identification of potential cell-cell interactions between two cell types and their ligand-receptor pairs for different disease states |
| Ligand | Receptor | LRpair | Pathway | Tissue | Disease Stage |
| Page: 1 |
Top |
Single-cell gene regulatory network inference analysis |
| Find out the significant the regulons (TFs) and the target genes of each regulon across cell types for different disease states |
| TF | Cell Type | Tissue | Disease Stage | Target Gene | RSS | Regulon Activity |
| ∗The dot plots of a searched regulon are shown for all cell subpopulations in each disease state of each tissue based on the regulon specific score inferred using pySCENIC and by calculating the average expression. |
| Page: 1 |
Top |
Somatic mutation of malignant transformation related genes |
| Annotation of somatic variants for genes involved in malignant transformation |
| Hugo Symbol | Variant Class | Variant Classification | dbSNP RS | HGVSc | HGVSp | HGVSp Short | SWISSPROT | BIOTYPE | SIFT | PolyPhen | Tumor Sample Barcode | Tissue | Histology | Sex | Age | Stage | Therapy Types | Drugs | Outcome |
| OGFOD3 | SNV | Missense_Mutation | c.352N>T | p.Thr118Ser | p.T118S | Q6PK18 | protein_coding | tolerated(0.53) | benign(0.015) | TCGA-A7-A13F-01 | Breast | breast invasive carcinoma | Female | <65 | III/IV | Chemotherapy | doxorubicin | SD | |
| OGFOD3 | insertion | Nonsense_Mutation | novel | c.860_861insTTTCCAGTGGTAACCTTTGA | p.Gln287HisfsTer5 | p.Q287Hfs*5 | Q6PK18 | protein_coding | TCGA-AO-A0JB-01 | Breast | breast invasive carcinoma | Female | <65 | III/IV | Chemotherapy | cyclophosphamide | SD | ||
| OGFOD3 | deletion | Frame_Shift_Del | rs753397545 | c.218delT | p.Val73AlafsTer56 | p.V73Afs*56 | Q6PK18 | protein_coding | TCGA-EW-A2FV-01 | Breast | breast invasive carcinoma | Female | <65 | III/IV | Chemotherapy | docetaxel | SD | ||
| OGFOD3 | SNV | Missense_Mutation | rs373893804 | c.839N>A | p.Arg280Gln | p.R280Q | Q6PK18 | protein_coding | tolerated_low_confidence(0.4) | benign(0) | TCGA-VS-A957-01 | Cervix | cervical & endocervical cancer | Female | <65 | I/II | Chemotherapy | cisplatin | CR |
| OGFOD3 | SNV | Missense_Mutation | rs762940701 | c.554N>A | p.Arg185Gln | p.R185Q | Q6PK18 | protein_coding | deleterious(0.01) | probably_damaging(0.947) | TCGA-AA-3939-01 | Colorectum | colon adenocarcinoma | Male | >=65 | I/II | Unknown | Unknown | SD |
| OGFOD3 | SNV | Missense_Mutation | novel | c.497N>A | p.Gly166Glu | p.G166E | Q6PK18 | protein_coding | tolerated(0.25) | probably_damaging(0.934) | TCGA-AA-3950-01 | Colorectum | colon adenocarcinoma | Female | >=65 | I/II | Unknown | Unknown | SD |
| OGFOD3 | SNV | Missense_Mutation | rs368625223 | c.376N>T | p.Arg126Cys | p.R126C | Q6PK18 | protein_coding | deleterious(0.02) | probably_damaging(0.966) | TCGA-AA-3950-01 | Colorectum | colon adenocarcinoma | Female | >=65 | I/II | Unknown | Unknown | SD |
| OGFOD3 | SNV | Missense_Mutation | c.211N>A | p.Ala71Thr | p.A71T | Q6PK18 | protein_coding | tolerated(1) | benign(0.005) | TCGA-AA-A022-01 | Colorectum | colon adenocarcinoma | Female | >=65 | I/II | Unknown | Unknown | SD | |
| OGFOD3 | SNV | Missense_Mutation | c.152N>A | p.Ala51Asp | p.A51D | Q6PK18 | protein_coding | deleterious(0.03) | benign(0.219) | TCGA-A5-A0G1-01 | Endometrium | uterine corpus endometrioid carcinoma | Female | >=65 | I/II | Unknown | Unknown | SD | |
| OGFOD3 | SNV | Missense_Mutation | c.709G>A | p.Gly237Ser | p.G237S | Q6PK18 | protein_coding | tolerated(0.1) | probably_damaging(0.985) | TCGA-AP-A0LM-01 | Endometrium | uterine corpus endometrioid carcinoma | Female | <65 | III/IV | Chemotherapy | cisplatin | SD |
| Page: 1 2 3 4 |
Top |
Related drugs of malignant transformation related genes |
| Identification of chemicals and drugs interact with genes involved in malignant transfromation |
| (DGIdb 4.0) |
| Entrez ID | Symbol | Category | Interaction Types | Drug Claim Name | Drug Name | PMIDs |
| Page: 1 |

Copyright 2023-Present -The University of Texas Health Science Center at Houston |