Schematic overview of the cellular and molecular mechanisms involved in the cancer progression, including the proposed cellular and molecular mechanisms in cancer cells trajectory. AT1: alveolar type 1 cells; AT2: alveolar type 2 cells; AAH: atypical adenomatous hyperplasia; AIS: adenocarcinoma in situ; MIA: minimally invasive adenocarcinoma; IA: invasive adenocarcinoma; EMT: epithelial-mesenchymal transition

Home

Download

Statistics

Help

Contact

Center for Computational Systems Medicine
leaf

Gene summary

leaf

Malignant transformation analysis

leaf

Malignant transformation related pathway analysis

leaf

Cell-cell communication analysis

leaf

Single-cell gene regulatory network inference analysis

leaf

Somatic mutation of malignant transformation related genes

leaf

Related drugs of malignant transformation related genes

Gene: OGFOD1

Gene summary for OGFOD1

check button Gene summary.

Gene informationSpeciesHuman
Gene symbol

OGFOD1

Gene ID

55239

Gene name2-oxoglutarate and iron dependent oxygenase domain containing 1
Gene AliasTPA1
Cytomap16q13
Gene Typeprotein-coding
GO ID

GO:0006412

UniProtAcc

Q8N543


Top

Malignant transformation analysis

check button Identification of the aberrant gene expression in precancerous and cancerous lesions by comparing the gene expression of stem-like cells in diseased tissues with normal stem cells
check button Malignant transformation involving gene list.
Entrez IDSymbolReplicatesSpeciesOrganTissueAdj P-valueLog2FCMalignancy
55239OGFOD1LZE2THumanEsophagusESCC3.23e-044.93e-010.082
55239OGFOD1LZE4THumanEsophagusESCC2.92e-144.15e-010.0811
55239OGFOD1LZE7THumanEsophagusESCC1.44e-042.19e-010.0667
55239OGFOD1LZE8THumanEsophagusESCC4.49e-056.32e-020.067
55239OGFOD1LZE20THumanEsophagusESCC4.69e-023.82e-020.0662
55239OGFOD1LZE24THumanEsophagusESCC6.22e-091.04e-010.0596
55239OGFOD1P1T-EHumanEsophagusESCC3.24e-051.98e-010.0875
55239OGFOD1P2T-EHumanEsophagusESCC7.79e-181.38e-010.1177
55239OGFOD1P4T-EHumanEsophagusESCC1.58e-203.77e-010.1323
55239OGFOD1P5T-EHumanEsophagusESCC1.42e-162.83e-010.1327
55239OGFOD1P8T-EHumanEsophagusESCC8.65e-161.27e-010.0889
55239OGFOD1P9T-EHumanEsophagusESCC2.85e-099.98e-020.1131
55239OGFOD1P10T-EHumanEsophagusESCC6.08e-081.11e-010.116
55239OGFOD1P11T-EHumanEsophagusESCC9.94e-123.51e-010.1426
55239OGFOD1P12T-EHumanEsophagusESCC9.76e-182.96e-010.1122
55239OGFOD1P15T-EHumanEsophagusESCC6.57e-112.36e-010.1149
55239OGFOD1P16T-EHumanEsophagusESCC3.23e-081.46e-010.1153
55239OGFOD1P17T-EHumanEsophagusESCC2.97e-082.43e-010.1278
55239OGFOD1P19T-EHumanEsophagusESCC4.26e-055.58e-010.1662
55239OGFOD1P20T-EHumanEsophagusESCC2.33e-233.02e-010.1124
Page: 1 2 3 4 5 

check button Transcriptomic changes along malignancy continuum.
TissueExpression DynamicsAbbreviation
EsophagusThe image shows the transcriptomic changes along malignancy continuum.log2FC in expression of this searched gene in stem-like cells from each diseased tissue sample relative to stem-like cells in normal samples in each tissue plotted against the malignancy continuum. Samples are colored based on if they are from different disease stage.
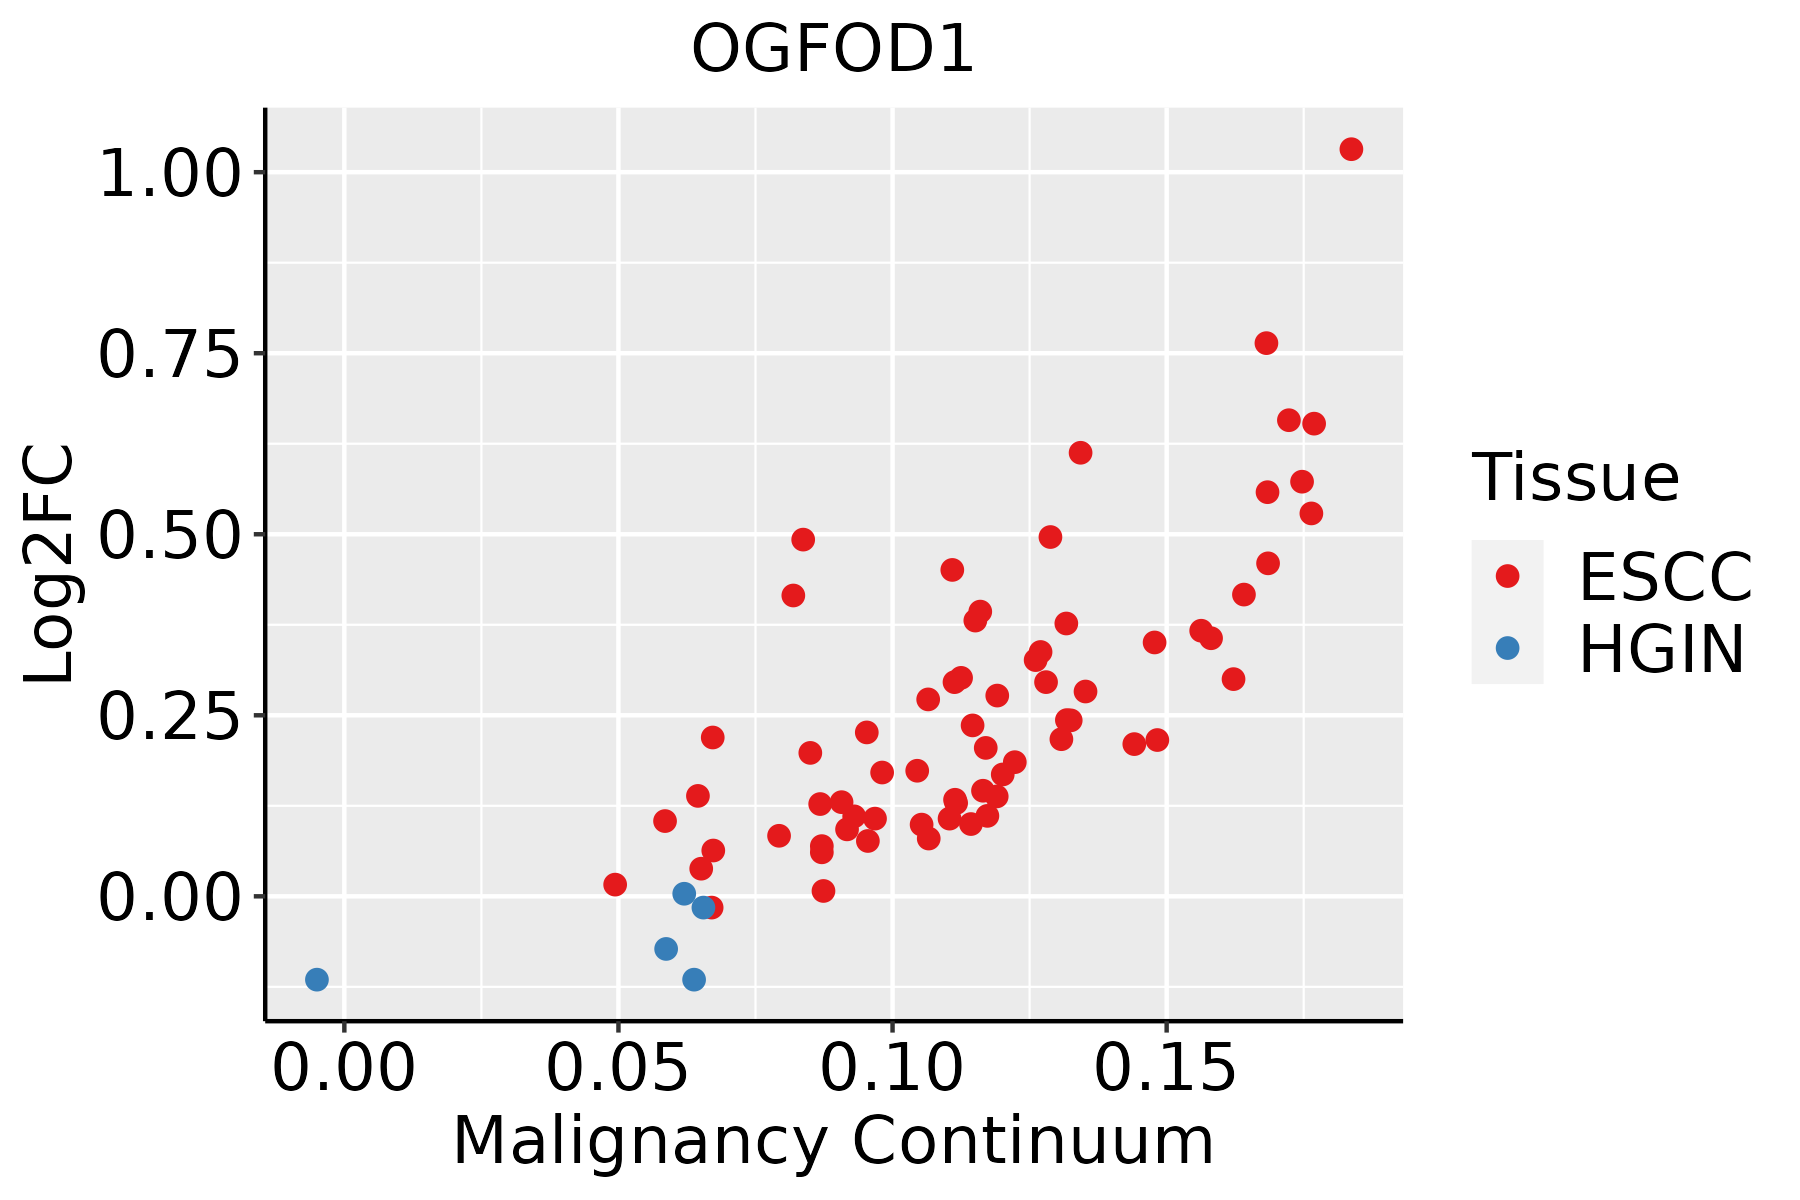
ESCC: Esophageal squamous cell carcinoma
HGIN: High-grade intraepithelial neoplasias
LGIN: Low-grade intraepithelial neoplasias
LiverThe image shows the transcriptomic changes along malignancy continuum.log2FC in expression of this searched gene in stem-like cells from each diseased tissue sample relative to stem-like cells in normal samples in each tissue plotted against the malignancy continuum. Samples are colored based on if they are from different disease stage.
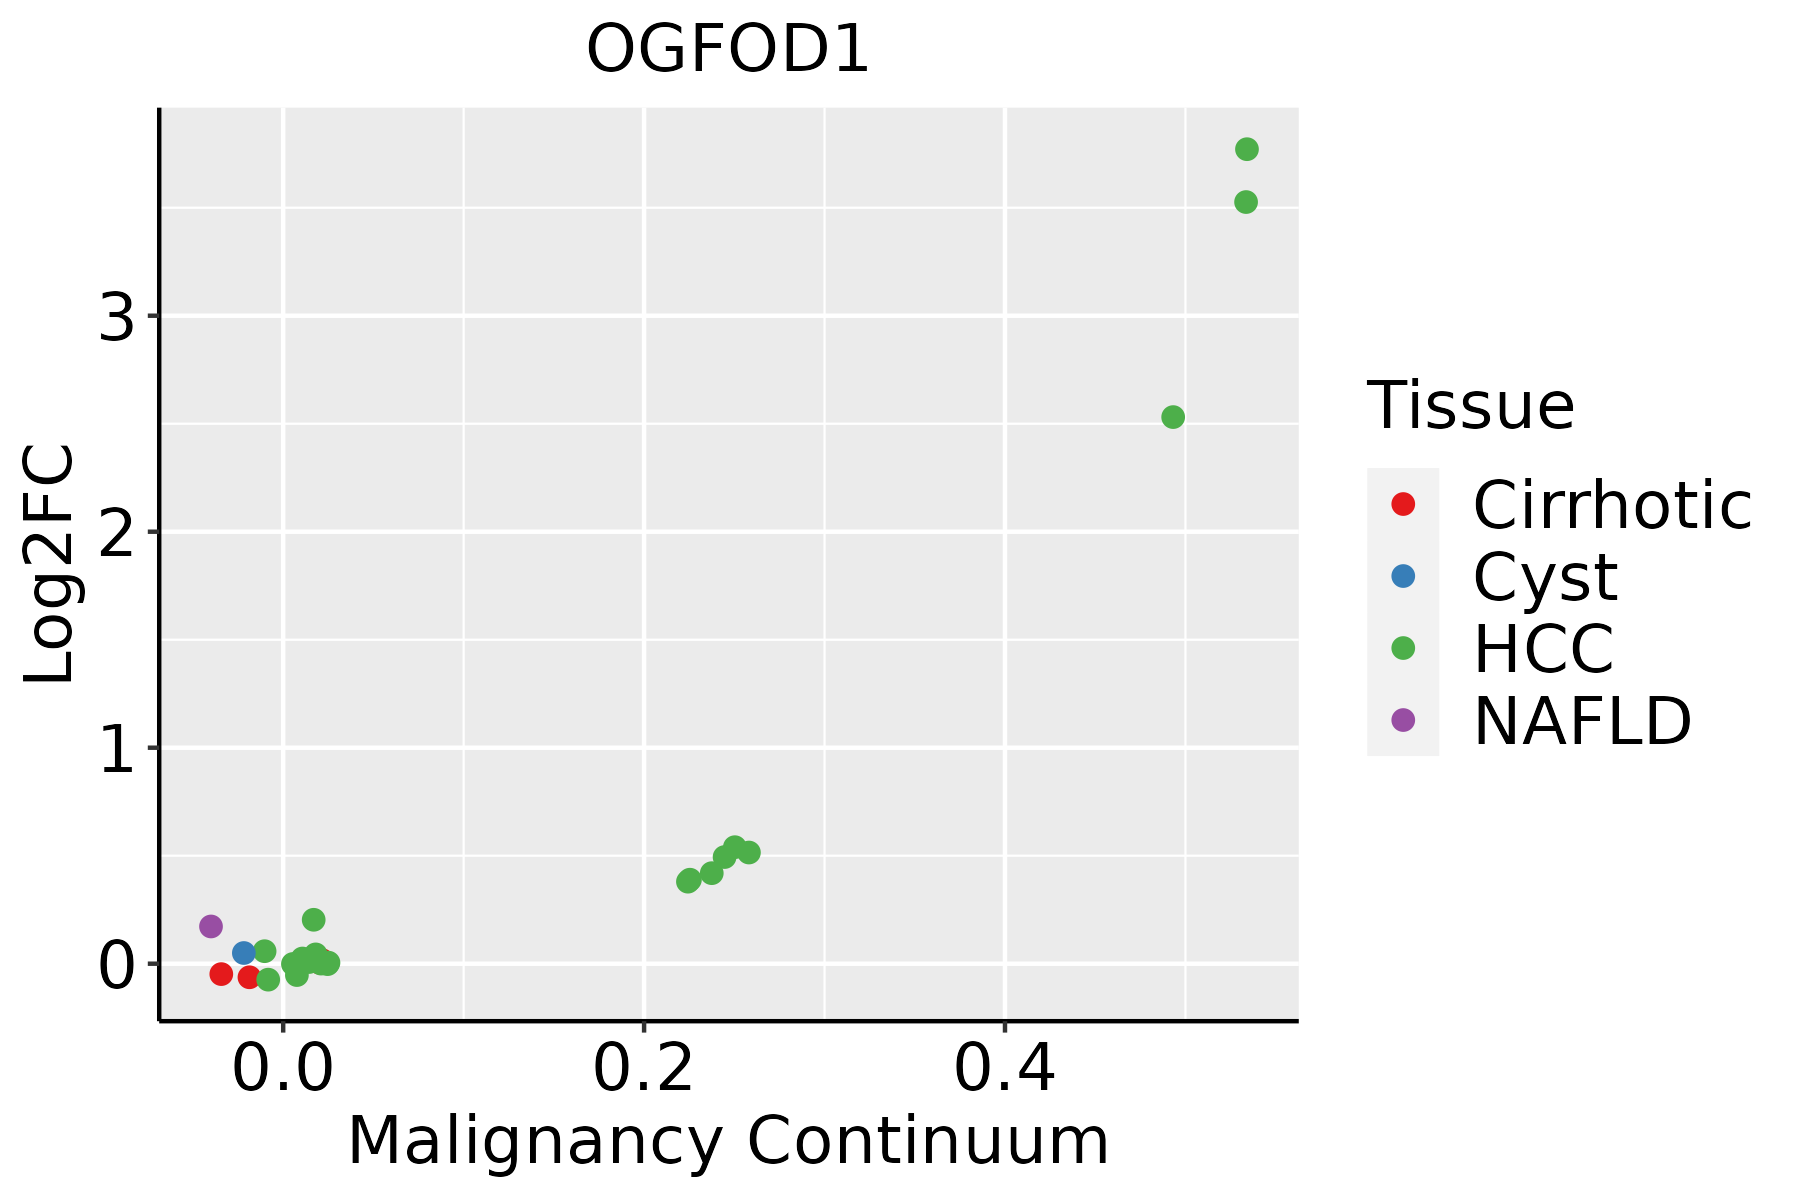
HCC: Hepatocellular carcinoma
NAFLD: Non-alcoholic fatty liver disease
Oral CavityThe image shows the transcriptomic changes along malignancy continuum.log2FC in expression of this searched gene in stem-like cells from each diseased tissue sample relative to stem-like cells in normal samples in each tissue plotted against the malignancy continuum. Samples are colored based on if they are from different disease stage.
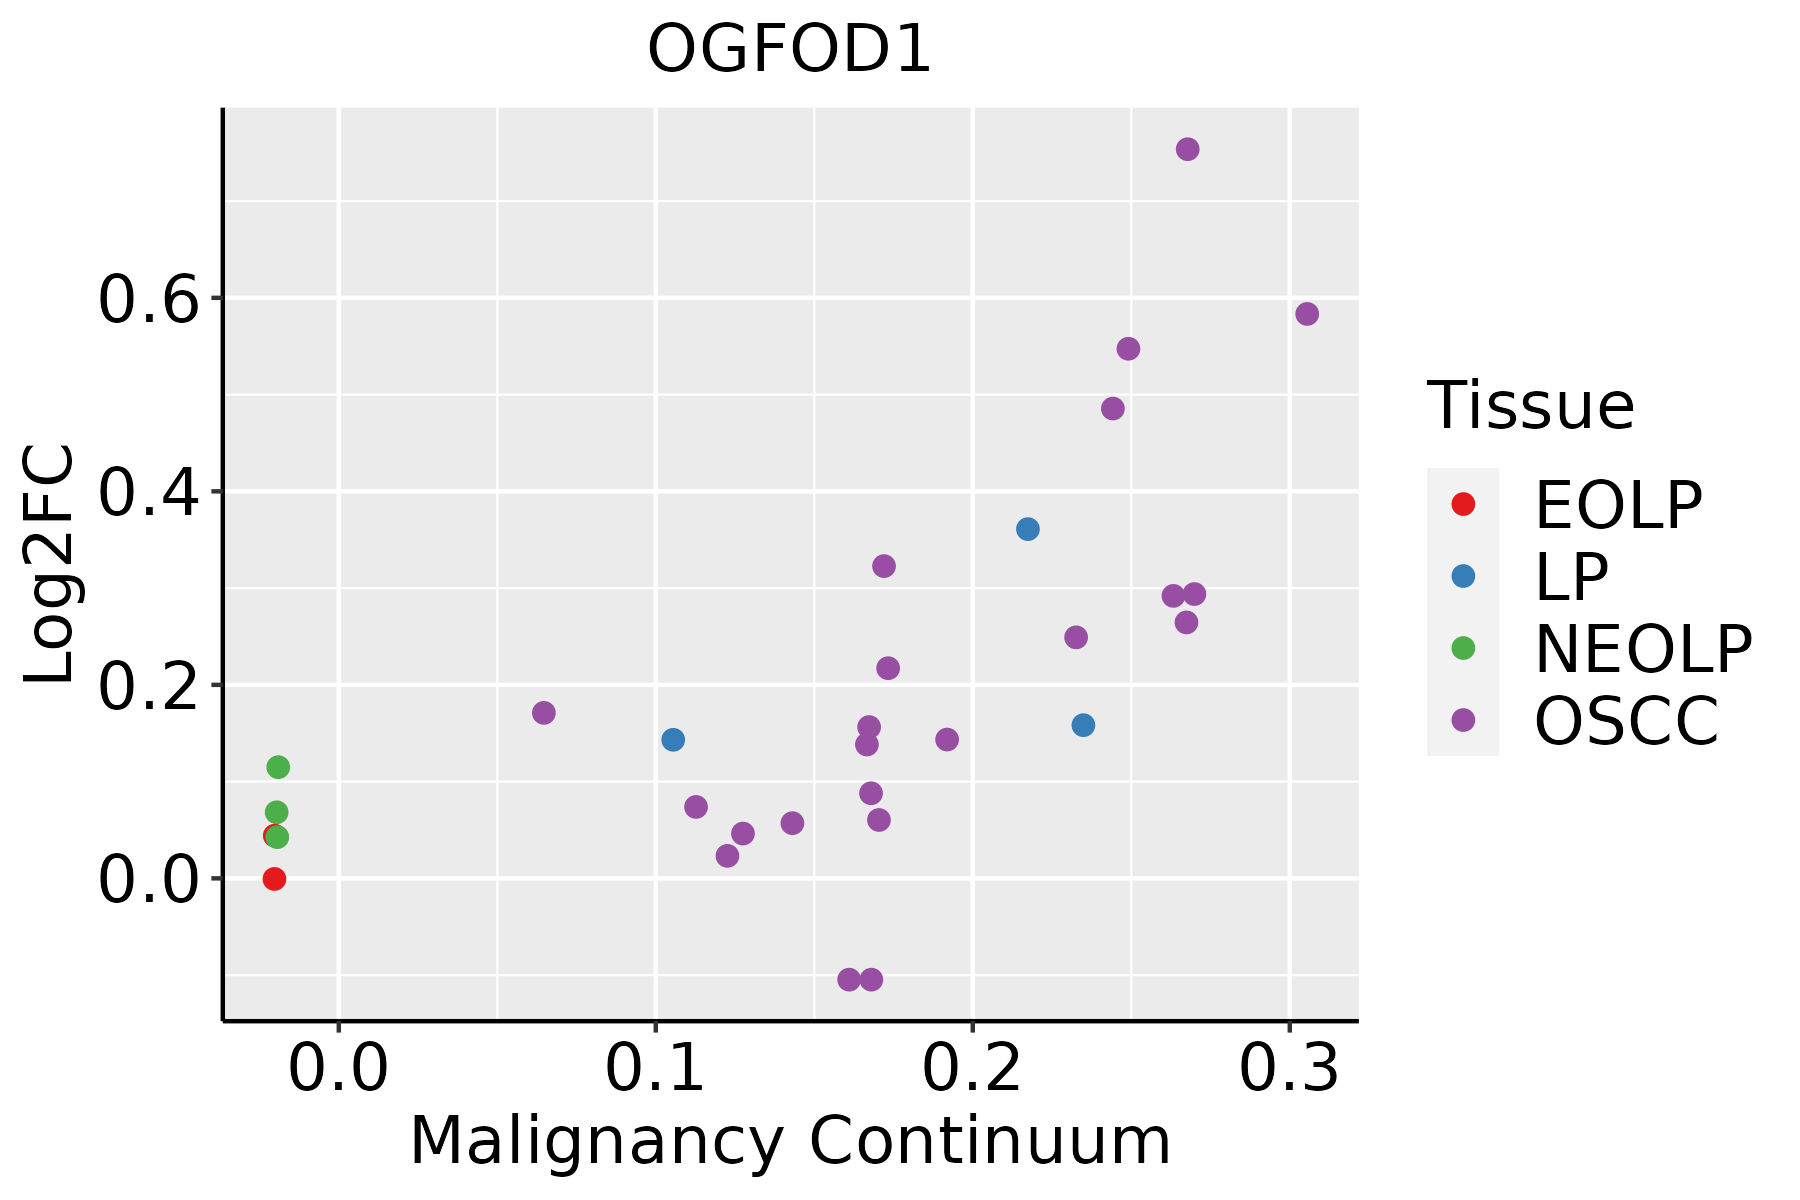
EOLP: Erosive Oral lichen planus
LP: leukoplakia
NEOLP: Non-erosive oral lichen planus
OSCC: Oral squamous cell carcinoma
SkinThe image shows the transcriptomic changes along malignancy continuum.log2FC in expression of this searched gene in stem-like cells from each diseased tissue sample relative to stem-like cells in normal samples in each tissue plotted against the malignancy continuum. Samples are colored based on if they are from different disease stage.
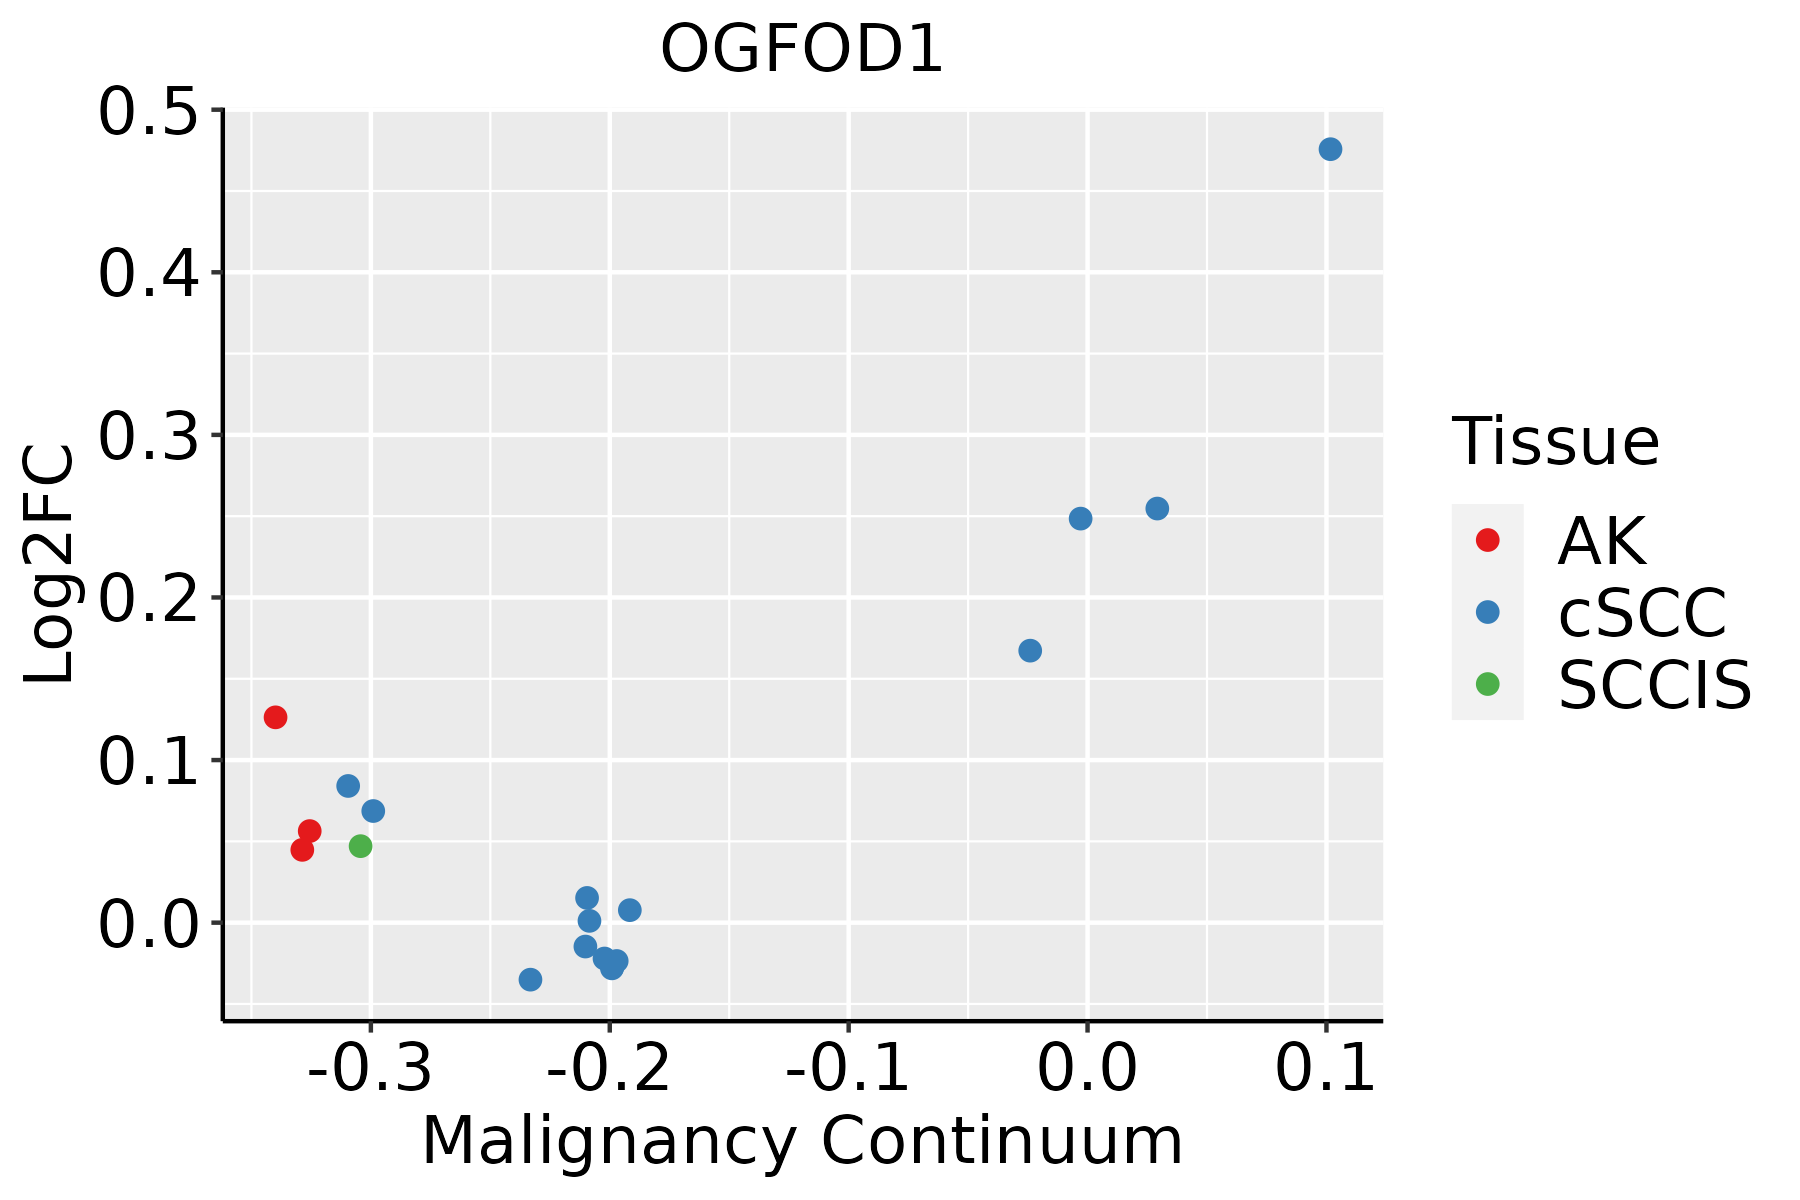
AK: Actinic keratosis
cSCC: Cutaneous squamous cell carcinoma
SCCIS:squamous cell carcinoma in situ
ThyroidThe image shows the transcriptomic changes along malignancy continuum.log2FC in expression of this searched gene in stem-like cells from each diseased tissue sample relative to stem-like cells in normal samples in each tissue plotted against the malignancy continuum. Samples are colored based on if they are from different disease stage.
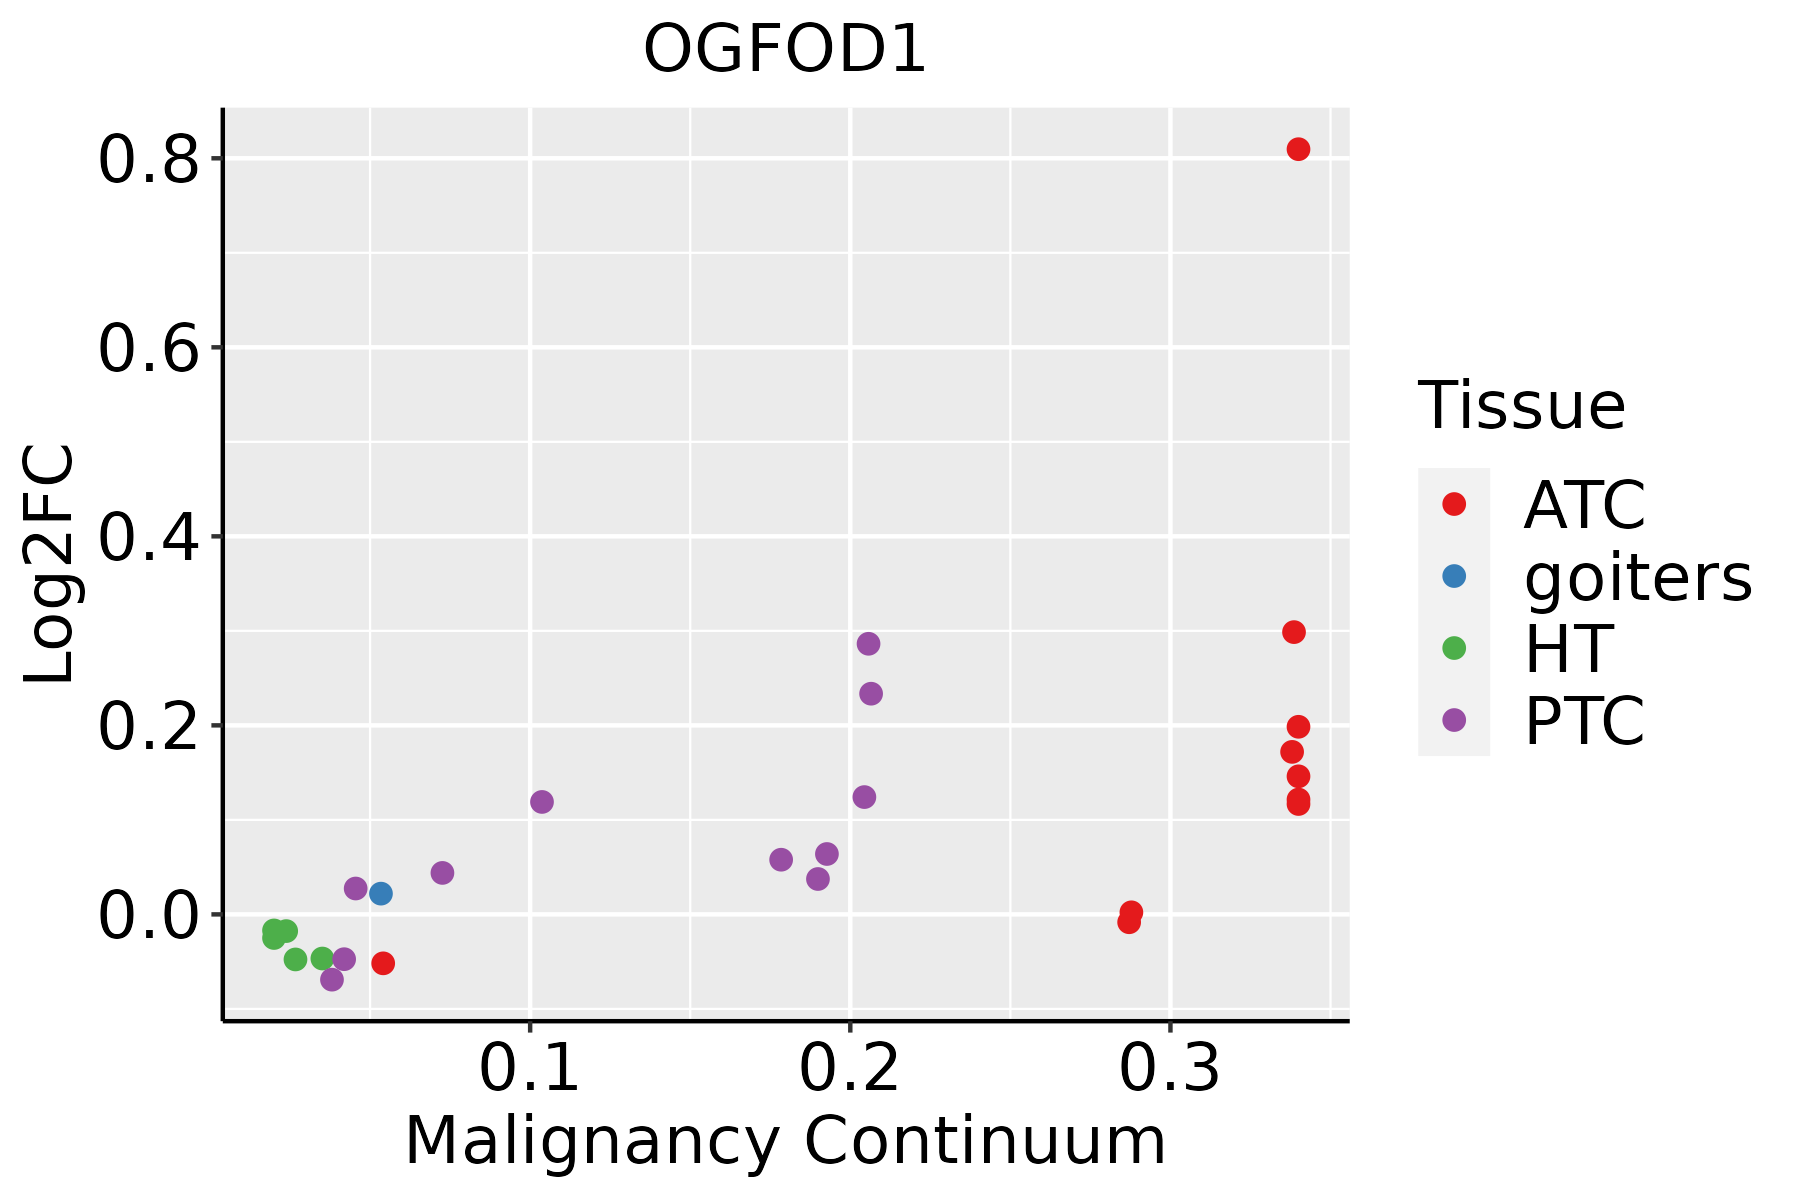
ATC: Anaplastic thyroid cancer
HT: Hashimoto's thyroiditis
PTC: Papillary thyroid cancer
∗log2FC in expression of this searched gene in stem-like cells from each diseased tissue sample relative to stem-like cells in normal samples in each tissue plotted against the malignancy continuum. Samples are colored based on if they are from different disease stage.

Top

Malignant transformation related pathway analysis

check buttonFind out the enriched GO biological processes and KEGG pathways involved in transition from healthy to precancer to cancer
check button Figure of enriched GO biological processes.
TissueDisease StageEnriched GO biological Processes
ColorectumADGO analysis - Figure of enriched GO biological processes: Top 15 enriched GO BP terms are showed in the bar plot of each disease state in each tissue. Each row represents a significant GO biological process which is colored according to the -log10(p.adjust).
ColorectumSERGO analysis - Figure of enriched GO biological processes: Top 15 enriched GO BP terms are showed in the bar plot of each disease state in each tissue. Each row represents a significant GO biological process which is colored according to the -log10(p.adjust).
ColorectumMSSGO analysis - Figure of enriched GO biological processes: Top 15 enriched GO BP terms are showed in the bar plot of each disease state in each tissue. Each row represents a significant GO biological process which is colored according to the -log10(p.adjust).
ColorectumMSI-HGO analysis - Figure of enriched GO biological processes: Top 15 enriched GO BP terms are showed in the bar plot of each disease state in each tissue. Each row represents a significant GO biological process which is colored according to the -log10(p.adjust).
ColorectumFAPGO analysis - Figure of enriched GO biological processes: Top 15 enriched GO BP terms are showed in the bar plot of each disease state in each tissue. Each row represents a significant GO biological process which is colored according to the -log10(p.adjust).
∗Top 15 enriched GO BP terms are showed in the bar plot of each disease state in each tissue. Each row represents a significant GO biological process which is colored according to the -log10(p.adjust).
Page: 1 2 3 4 5 6 7 8 9 

check button Enriched GO biological processes.
GO IDTissueDisease StageDescriptionGene RatioBg Ratiopvaluep.adjustCount
GO:0022411111EsophagusESCCcellular component disassembly305/8552443/187231.94e-234.57e-21305
GO:0006417111EsophagusESCCregulation of translation304/8552468/187231.53e-171.33e-15304
GO:003298416EsophagusESCCprotein-containing complex disassembly151/8552224/187233.45e-111.15e-09151
GO:001820816EsophagusESCCpeptidyl-proline modification46/855258/187231.59e-072.51e-0646
GO:003406315EsophagusESCCstress granule assembly23/855226/187236.82e-066.90e-0523
GO:00181263EsophagusESCCprotein hydroxylation23/855227/187232.60e-052.19e-0423
GO:00432446EsophagusESCCregulation of protein-containing complex disassembly75/8552121/187232.17e-041.36e-0375
GO:00195114EsophagusESCCpeptidyl-proline hydroxylation13/855215/187231.31e-036.26e-0313
GO:00436245EsophagusESCCcellular protein complex disassembly78/8552136/187234.00e-031.62e-0278
GO:002241112LiverHCCcellular component disassembly282/7958443/187231.02e-191.38e-17282
GO:000641722LiverHCCregulation of translation287/7958468/187238.79e-178.08e-15287
GO:003298411LiverHCCprotein-containing complex disassembly138/7958224/187235.59e-091.46e-07138
GO:00340632LiverHCCstress granule assembly24/795826/187231.35e-072.57e-0624
GO:001820811LiverHCCpeptidyl-proline modification42/795858/187233.73e-064.85e-0542
GO:00432444LiverHCCregulation of protein-containing complex disassembly66/7958121/187234.94e-032.07e-0266
GO:0018126LiverHCCprotein hydroxylation18/795827/187239.75e-033.66e-0218
GO:00436242LiverHCCcellular protein complex disassembly71/7958136/187231.39e-024.95e-0271
GO:002241119Oral cavityOSCCcellular component disassembly283/7305443/187239.57e-273.37e-24283
GO:000641720Oral cavityOSCCregulation of translation274/7305468/187234.39e-184.63e-16274
GO:003298410Oral cavityOSCCprotein-containing complex disassembly136/7305224/187233.42e-111.13e-09136
Page: 1 2 3 

check button Enriched KEGG pathways.
Pathway IDTissueDisease StageDescriptionGene RatioBg Ratiopvaluep.adjustqvalueCount
Page: 1 

Top

Cell-cell communication analysis

check buttonIdentification of potential cell-cell interactions between two cell types and their ligand-receptor pairs for different disease states
LigandReceptorLRpairPathwayTissueDisease Stage
Page: 1 

Top

Single-cell gene regulatory network inference analysis

check buttonFind out the significant the regulons (TFs) and the target genes of each regulon across cell types for different disease states
TFCell TypeTissueDisease StageTarget GeneRSSRegulon Activity
∗The dot plots of a searched regulon are shown for all cell subpopulations in each disease state of each tissue based on the regulon specific score inferred using pySCENIC and by calculating the average expression.
Page: 1 

Top

Somatic mutation of malignant transformation related genes

check buttonAnnotation of somatic variants for genes involved in malignant transformation
Hugo SymbolVariant ClassVariant ClassificationdbSNP RSHGVScHGVSpHGVSp ShortSWISSPROTBIOTYPESIFTPolyPhenTumor Sample BarcodeTissueHistologySexAgeStageTherapy TypesDrugsOutcome
OGFOD1SNVMissense_Mutationrs752724033c.688N>Tp.Arg230Cysp.R230CQ8N543protein_codingdeleterious(0)probably_damaging(1)TCGA-AN-A0AK-01Breastbreast invasive carcinomaFemale>=65I/IIUnknownUnknownSD
OGFOD1SNVMissense_Mutationc.158T>Cp.Val53Alap.V53AQ8N543protein_codingtolerated(1)benign(0)TCGA-BH-A18G-01Breastbreast invasive carcinomaFemale>=65I/IIUnknownUnknownSD
OGFOD1SNVMissense_Mutationnovelc.709N>Gp.Phe237Valp.F237VQ8N543protein_codingdeleterious(0)probably_damaging(0.997)TCGA-C8-A12X-01Breastbreast invasive carcinomaFemale<65I/IIUnknownUnknownSD
OGFOD1SNVMissense_Mutationnovelc.709T>Gp.Phe237Valp.F237VQ8N543protein_codingdeleterious(0)probably_damaging(0.997)TCGA-D8-A1X7-01Breastbreast invasive carcinomaFemale<65I/IIChemotherapyHormone Therapydoxorubicine+cyclophosphamide+tamoxifenSD
OGFOD1SNVMissense_Mutationnovelc.709N>Gp.Phe237Valp.F237VQ8N543protein_codingdeleterious(0)probably_damaging(0.997)TCGA-E2-A14Q-01Breastbreast invasive carcinomaFemale<65I/IIHormone TherapytamoxiphenSD
OGFOD1SNVMissense_Mutationc.105G>Cp.Leu35Phep.L35FQ8N543protein_codingtolerated(0.29)benign(0.007)TCGA-MY-A5BD-01Cervixcervical & endocervical cancerFemale<65I/IIChemotherapycisplatinCR
OGFOD1SNVMissense_Mutationnovelc.1456N>Ap.Glu486Lysp.E486KQ8N543protein_codingdeleterious(0)probably_damaging(1)TCGA-VS-A959-01Cervixcervical & endocervical cancerFemale>=65I/IIUnknownUnknownSD
OGFOD1insertionFrame_Shift_Insnovelc.740_741insAGTGp.Asn247LysfsTer5p.N247Kfs*5Q8N543protein_codingTCGA-DS-A1OB-01Cervixcervical & endocervical cancerFemale<65I/IIChemotherapycarboplatinPD
OGFOD1insertionIn_Frame_Insnovelc.741_742insTGGGATp.Asn247_Tyr248insTrpAspp.N247_Y248insWDQ8N543protein_codingTCGA-DS-A1OB-01Cervixcervical & endocervical cancerFemale<65I/IIChemotherapycarboplatinPD
OGFOD1insertionFrame_Shift_Insnovelc.740_741insAGTGp.Asn247LysfsTer5p.N247Kfs*5Q8N543protein_codingTCGA-DS-A1OC-01Cervixcervical & endocervical cancerFemale<65I/IIChemotherapygemcitabineSD
Page: 1 2 3 4 

Top

Related drugs of malignant transformation related genes

check buttonIdentification of chemicals and drugs interact with genes involved in malignant transfromation
(DGIdb 4.0)
Entrez IDSymbolCategoryInteraction TypesDrug Claim NameDrug NamePMIDs
Page: 1