
|
|||||
|
 | |
| |
| |
| |
| |
| |
|
Gene: OGDHL |
Gene summary for OGDHL |
| Gene information | Species | Human | Gene symbol | OGDHL | Gene ID | 55753 |
| Gene name | oxoglutarate dehydrogenase L | |
| Gene Alias | OGDHL | |
| Cytomap | 10q11.23 | |
| Gene Type | protein-coding | GO ID | GO:0005975 | UniProtAcc | Q9ULD0 |
Top |
Malignant transformation analysis |
| Identification of the aberrant gene expression in precancerous and cancerous lesions by comparing the gene expression of stem-like cells in diseased tissues with normal stem cells |
| Entrez ID | Symbol | Replicates | Species | Organ | Tissue | Adj P-value | Log2FC | Malignancy |
| 55753 | OGDHL | HCC1_Meng | Human | Liver | HCC | 7.52e-13 | 2.95e-03 | 0.0246 |
| 55753 | OGDHL | HCC2 | Human | Liver | HCC | 2.57e-10 | 2.41e+00 | 0.5341 |
| 55753 | OGDHL | S027 | Human | Liver | HCC | 3.16e-02 | 3.04e-01 | 0.2446 |
| 55753 | OGDHL | S028 | Human | Liver | HCC | 1.03e-11 | 4.78e-01 | 0.2503 |
| 55753 | OGDHL | S029 | Human | Liver | HCC | 1.45e-10 | 5.28e-01 | 0.2581 |
| Page: 1 |
| Tissue | Expression Dynamics | Abbreviation |
| Liver | 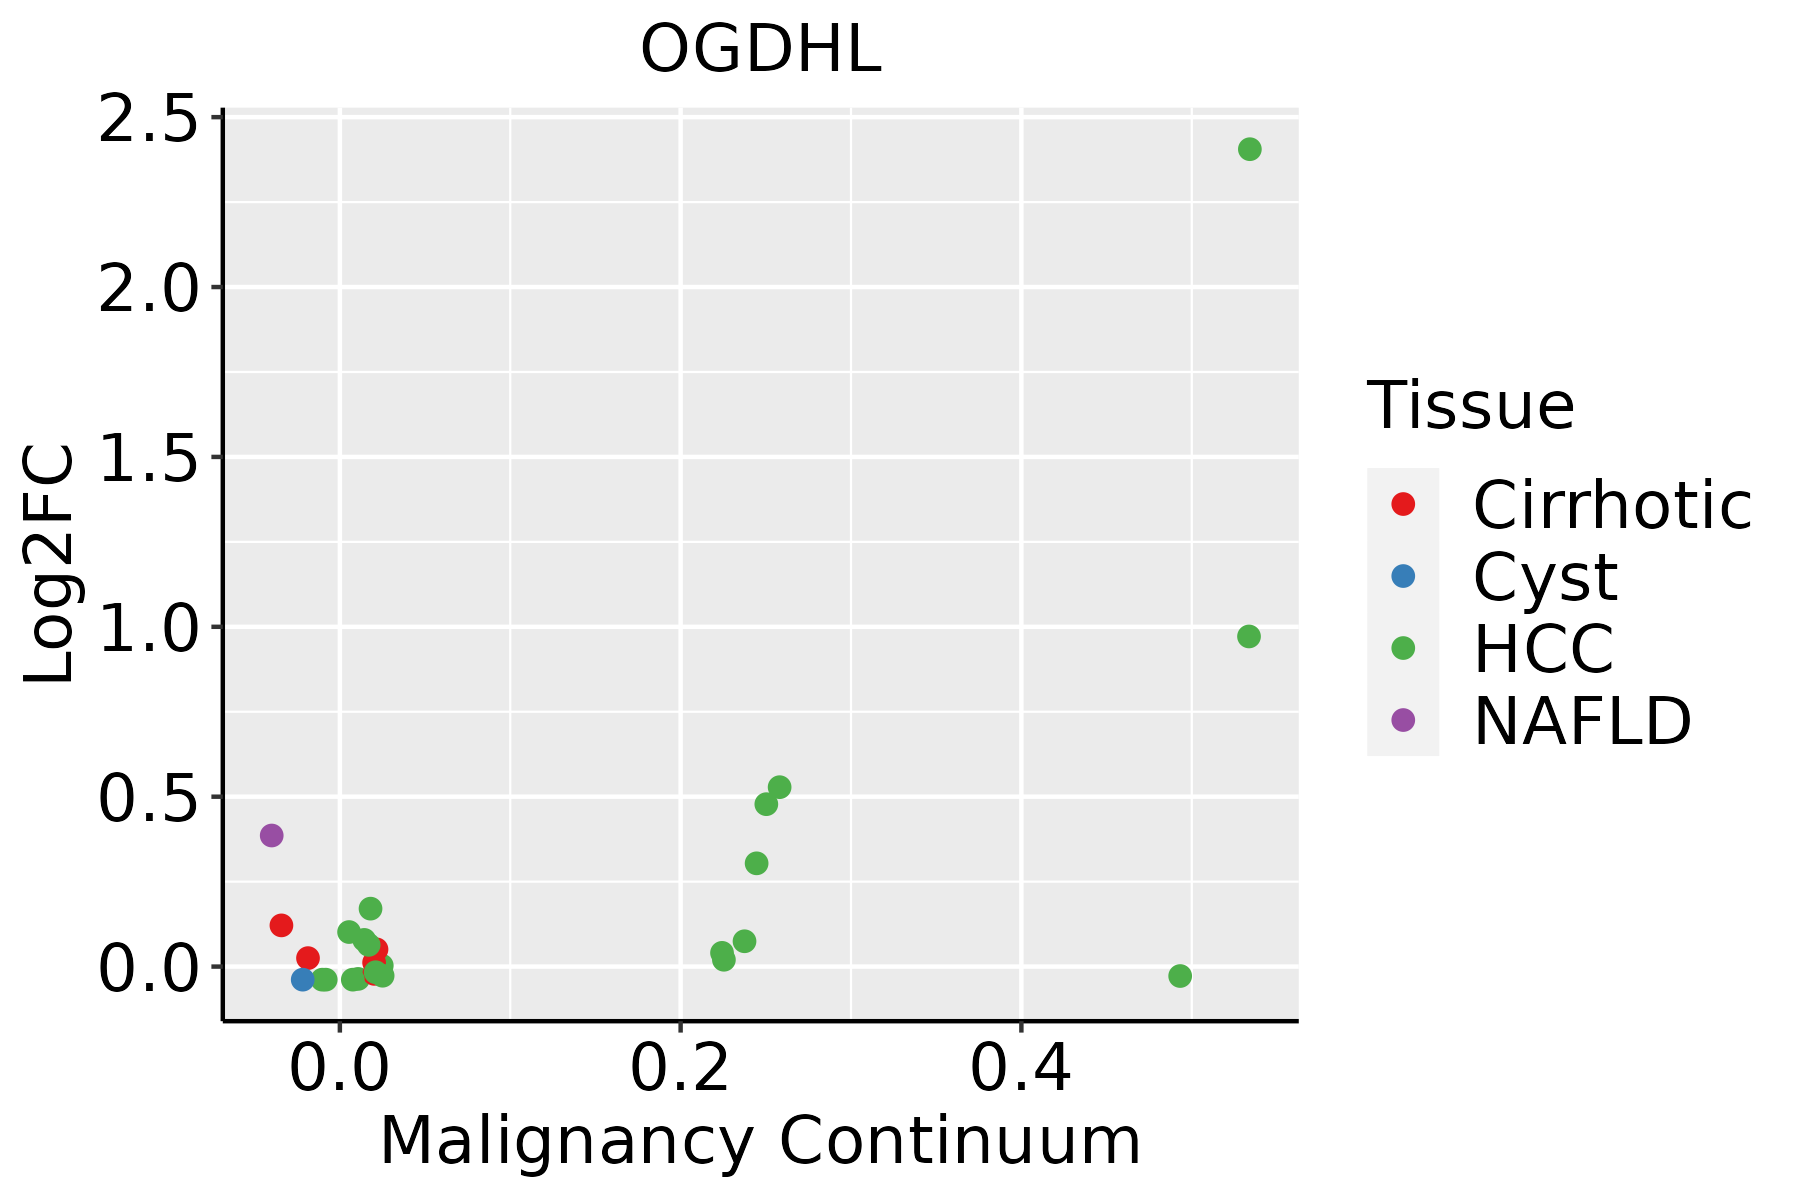 | HCC: Hepatocellular carcinoma |
| NAFLD: Non-alcoholic fatty liver disease |
| ∗log2FC in expression of this searched gene in stem-like cells from each diseased tissue sample relative to stem-like cells in normal samples in each tissue plotted against the malignancy continuum. Samples are colored based on if they are from different disease stage. |
Top |
Malignant transformation related pathway analysis |
| Find out the enriched GO biological processes and KEGG pathways involved in transition from healthy to precancer to cancer |
| Tissue | Disease Stage | Enriched GO biological Processes |
| Colorectum | AD |  |
| Colorectum | SER |  |
| Colorectum | MSS |  |
| Colorectum | MSI-H |  |
| Colorectum | FAP |  |
| ∗Top 15 enriched GO BP terms are showed in the bar plot of each disease state in each tissue. Each row represents a significant GO biological process which is colored according to the -log10(p.adjust). |
| Page: 1 2 3 4 5 6 7 8 9 |
| GO ID | Tissue | Disease Stage | Description | Gene Ratio | Bg Ratio | pvalue | p.adjust | Count |
| GO:000609122 | Liver | HCC | generation of precursor metabolites and energy | 340/7958 | 490/18723 | 4.04e-34 | 2.85e-31 | 340 |
| GO:000906012 | Liver | HCC | aerobic respiration | 147/7958 | 189/18723 | 3.13e-23 | 6.61e-21 | 147 |
| GO:004533312 | Liver | HCC | cellular respiration | 171/7958 | 230/18723 | 6.35e-23 | 1.26e-20 | 171 |
| GO:004603422 | Liver | HCC | ATP metabolic process | 198/7958 | 277/18723 | 8.30e-23 | 1.55e-20 | 198 |
| GO:001598022 | Liver | HCC | energy derivation by oxidation of organic compounds | 221/7958 | 318/18723 | 1.02e-22 | 1.86e-20 | 221 |
| GO:000911722 | Liver | HCC | nucleotide metabolic process | 300/7958 | 489/18723 | 1.61e-17 | 1.71e-15 | 300 |
| GO:000675322 | Liver | HCC | nucleoside phosphate metabolic process | 304/7958 | 497/18723 | 1.78e-17 | 1.85e-15 | 304 |
| GO:001969322 | Liver | HCC | ribose phosphate metabolic process | 248/7958 | 396/18723 | 3.15e-16 | 2.70e-14 | 248 |
| GO:000925922 | Liver | HCC | ribonucleotide metabolic process | 240/7958 | 385/18723 | 2.07e-15 | 1.51e-13 | 240 |
| GO:000915022 | Liver | HCC | purine ribonucleotide metabolic process | 226/7958 | 368/18723 | 1.36e-13 | 7.69e-12 | 226 |
| GO:007252122 | Liver | HCC | purine-containing compound metabolic process | 250/7958 | 416/18723 | 2.26e-13 | 1.24e-11 | 250 |
| GO:000616322 | Liver | HCC | purine nucleotide metabolic process | 236/7958 | 396/18723 | 3.59e-12 | 1.62e-10 | 236 |
| GO:00436482 | Liver | HCC | dicarboxylic acid metabolic process | 68/7958 | 96/18723 | 1.73e-08 | 4.14e-07 | 68 |
| GO:000609022 | Liver | HCC | pyruvate metabolic process | 73/7958 | 106/18723 | 3.52e-08 | 7.82e-07 | 73 |
| GO:001605222 | Liver | HCC | carbohydrate catabolic process | 99/7958 | 154/18723 | 3.79e-08 | 8.30e-07 | 99 |
| GO:000609911 | Liver | HCC | tricarboxylic acid cycle | 27/7958 | 30/18723 | 7.59e-08 | 1.52e-06 | 27 |
| GO:000918522 | Liver | HCC | ribonucleoside diphosphate metabolic process | 72/7958 | 106/18723 | 1.05e-07 | 2.03e-06 | 72 |
| GO:004603122 | Liver | HCC | ADP metabolic process | 63/7958 | 90/18723 | 1.17e-07 | 2.25e-06 | 63 |
| GO:000913522 | Liver | HCC | purine nucleoside diphosphate metabolic process | 70/7958 | 103/18723 | 1.52e-07 | 2.82e-06 | 70 |
| GO:000917922 | Liver | HCC | purine ribonucleoside diphosphate metabolic process | 70/7958 | 103/18723 | 1.52e-07 | 2.82e-06 | 70 |
| Page: 1 2 |
| Pathway ID | Tissue | Disease Stage | Description | Gene Ratio | Bg Ratio | pvalue | p.adjust | qvalue | Count |
| hsa0120041 | Liver | HCC | Carbon metabolism | 89/4020 | 115/8465 | 3.92e-11 | 6.56e-10 | 3.65e-10 | 89 |
| hsa0002021 | Liver | HCC | Citrate cycle (TCA cycle) | 28/4020 | 30/8465 | 1.08e-07 | 1.44e-06 | 8.02e-07 | 28 |
| hsa00785 | Liver | HCC | Lipoic acid metabolism | 14/4020 | 19/8465 | 1.89e-02 | 4.40e-02 | 2.45e-02 | 14 |
| hsa0120051 | Liver | HCC | Carbon metabolism | 89/4020 | 115/8465 | 3.92e-11 | 6.56e-10 | 3.65e-10 | 89 |
| hsa0002031 | Liver | HCC | Citrate cycle (TCA cycle) | 28/4020 | 30/8465 | 1.08e-07 | 1.44e-06 | 8.02e-07 | 28 |
| hsa007851 | Liver | HCC | Lipoic acid metabolism | 14/4020 | 19/8465 | 1.89e-02 | 4.40e-02 | 2.45e-02 | 14 |
| Page: 1 |
Top |
Cell-cell communication analysis |
| Identification of potential cell-cell interactions between two cell types and their ligand-receptor pairs for different disease states |
| Ligand | Receptor | LRpair | Pathway | Tissue | Disease Stage |
| Page: 1 |
Top |
Single-cell gene regulatory network inference analysis |
| Find out the significant the regulons (TFs) and the target genes of each regulon across cell types for different disease states |
| TF | Cell Type | Tissue | Disease Stage | Target Gene | RSS | Regulon Activity |
| ∗The dot plots of a searched regulon are shown for all cell subpopulations in each disease state of each tissue based on the regulon specific score inferred using pySCENIC and by calculating the average expression. |
| Page: 1 |
Top |
Somatic mutation of malignant transformation related genes |
| Annotation of somatic variants for genes involved in malignant transformation |
| Hugo Symbol | Variant Class | Variant Classification | dbSNP RS | HGVSc | HGVSp | HGVSp Short | SWISSPROT | BIOTYPE | SIFT | PolyPhen | Tumor Sample Barcode | Tissue | Histology | Sex | Age | Stage | Therapy Types | Drugs | Outcome |
| OGDHL | SNV | Missense_Mutation | c.2345C>A | p.Pro782His | p.P782H | Q9ULD0 | protein_coding | deleterious(0.01) | probably_damaging(0.971) | TCGA-AN-A049-01 | Breast | breast invasive carcinoma | Female | <65 | I/II | Unknown | Unknown | SD | |
| OGDHL | SNV | Missense_Mutation | c.2452N>A | p.Cys818Ser | p.C818S | Q9ULD0 | protein_coding | deleterious(0.02) | possibly_damaging(0.833) | TCGA-AN-A0AT-01 | Breast | breast invasive carcinoma | Female | <65 | I/II | Unknown | Unknown | SD | |
| OGDHL | SNV | Missense_Mutation | c.1505N>G | p.Glu502Gly | p.E502G | Q9ULD0 | protein_coding | deleterious(0) | probably_damaging(1) | TCGA-AO-A0J2-01 | Breast | breast invasive carcinoma | Female | <65 | I/II | Chemotherapy | cyclophosphamide | SD | |
| OGDHL | SNV | Missense_Mutation | c.143G>T | p.Gly48Val | p.G48V | Q9ULD0 | protein_coding | deleterious(0) | benign(0) | TCGA-AR-A1AH-01 | Breast | breast invasive carcinoma | Female | <65 | I/II | Unspecific | PD | ||
| OGDHL | SNV | Missense_Mutation | c.142G>T | p.Gly48Cys | p.G48C | Q9ULD0 | protein_coding | deleterious(0) | benign(0.377) | TCGA-AR-A1AH-01 | Breast | breast invasive carcinoma | Female | <65 | I/II | Unspecific | PD | ||
| OGDHL | SNV | Missense_Mutation | c.1693N>G | p.Ile565Val | p.I565V | Q9ULD0 | protein_coding | tolerated(0.73) | benign(0.021) | TCGA-D8-A1XQ-01 | Breast | breast invasive carcinoma | Female | >=65 | I/II | Unknown | Unknown | SD | |
| OGDHL | SNV | Missense_Mutation | rs554687335 | c.2744N>A | p.Arg915His | p.R915H | Q9ULD0 | protein_coding | deleterious(0) | probably_damaging(1) | TCGA-E9-A1R4-01 | Breast | breast invasive carcinoma | Female | >=65 | I/II | Chemotherapy | 5-fluorouracil | SD |
| OGDHL | SNV | Missense_Mutation | rs145127820 | c.311N>A | p.Arg104Gln | p.R104Q | Q9ULD0 | protein_coding | tolerated(0.59) | benign(0) | TCGA-E9-A1RH-01 | Breast | breast invasive carcinoma | Female | <65 | I/II | Chemotherapy | 5-fluorouracil | SD |
| OGDHL | SNV | Missense_Mutation | novel | c.355N>A | p.Ser119Thr | p.S119T | Q9ULD0 | protein_coding | tolerated(0.84) | benign(0.022) | TCGA-S3-A6ZH-01 | Breast | breast invasive carcinoma | Female | <65 | III/IV | Chemotherapy | adriamycin | CR |
| OGDHL | SNV | Missense_Mutation | rs375656495 | c.844G>A | p.Asp282Asn | p.D282N | Q9ULD0 | protein_coding | deleterious(0) | probably_damaging(0.998) | TCGA-2W-A8YY-01 | Cervix | cervical & endocervical cancer | Female | <65 | I/II | Chemotherapy | cisplatin | CR |
| Page: 1 2 3 4 5 6 7 8 9 10 11 12 13 14 15 16 17 |
Top |
Related drugs of malignant transformation related genes |
| Identification of chemicals and drugs interact with genes involved in malignant transfromation |
| (DGIdb 4.0) |
| Entrez ID | Symbol | Category | Interaction Types | Drug Claim Name | Drug Name | PMIDs |
| Page: 1 |

Copyright 2023-Present -The University of Texas Health Science Center at Houston |