
|
|||||
|
 | |
| |
| |
| |
| |
| |
|
Gene: ODF2L |
Gene summary for ODF2L |
| Gene information | Species | Human | Gene symbol | ODF2L | Gene ID | 57489 |
| Gene name | outer dense fiber of sperm tails 2 like | |
| Gene Alias | ODF2L | |
| Cytomap | 1p22.3 | |
| Gene Type | protein-coding | GO ID | GO:0006996 | UniProtAcc | Q9ULJ1 |
Top |
Malignant transformation analysis |
| Identification of the aberrant gene expression in precancerous and cancerous lesions by comparing the gene expression of stem-like cells in diseased tissues with normal stem cells |
| Entrez ID | Symbol | Replicates | Species | Organ | Tissue | Adj P-value | Log2FC | Malignancy |
| 57489 | ODF2L | CA_HPV_1 | Human | Cervix | CC | 2.05e-02 | -1.66e-01 | 0.0264 |
| 57489 | ODF2L | CCI_2 | Human | Cervix | CC | 1.56e-02 | 6.16e-01 | 0.5249 |
| 57489 | ODF2L | CCI_3 | Human | Cervix | CC | 8.99e-03 | 5.39e-01 | 0.516 |
| 57489 | ODF2L | sample3 | Human | Cervix | CC | 3.52e-10 | 3.47e-01 | 0.1387 |
| 57489 | ODF2L | H2 | Human | Cervix | HSIL_HPV | 4.16e-02 | 2.79e-01 | 0.0632 |
| 57489 | ODF2L | T3 | Human | Cervix | CC | 3.37e-06 | 3.11e-01 | 0.1389 |
| 57489 | ODF2L | LZE4T | Human | Esophagus | ESCC | 6.52e-09 | 2.20e-01 | 0.0811 |
| 57489 | ODF2L | LZE5T | Human | Esophagus | ESCC | 4.49e-04 | 3.81e-01 | 0.0514 |
| 57489 | ODF2L | LZE7T | Human | Esophagus | ESCC | 2.43e-14 | 8.77e-01 | 0.0667 |
| 57489 | ODF2L | LZE8T | Human | Esophagus | ESCC | 6.10e-12 | 3.82e-01 | 0.067 |
| 57489 | ODF2L | LZE20T | Human | Esophagus | ESCC | 1.76e-10 | 4.01e-01 | 0.0662 |
| 57489 | ODF2L | LZE22D1 | Human | Esophagus | HGIN | 2.80e-07 | 1.76e-01 | 0.0595 |
| 57489 | ODF2L | LZE24T | Human | Esophagus | ESCC | 4.20e-23 | 7.73e-01 | 0.0596 |
| 57489 | ODF2L | LZE6T | Human | Esophagus | ESCC | 2.31e-08 | 2.77e-01 | 0.0845 |
| 57489 | ODF2L | P1T-E | Human | Esophagus | ESCC | 4.45e-13 | 6.04e-01 | 0.0875 |
| 57489 | ODF2L | P2T-E | Human | Esophagus | ESCC | 2.77e-35 | 6.95e-01 | 0.1177 |
| 57489 | ODF2L | P4T-E | Human | Esophagus | ESCC | 4.20e-23 | 4.66e-01 | 0.1323 |
| 57489 | ODF2L | P5T-E | Human | Esophagus | ESCC | 3.97e-20 | 4.41e-01 | 0.1327 |
| 57489 | ODF2L | P8T-E | Human | Esophagus | ESCC | 2.62e-64 | 1.38e+00 | 0.0889 |
| 57489 | ODF2L | P9T-E | Human | Esophagus | ESCC | 1.95e-16 | 3.88e-01 | 0.1131 |
| Page: 1 2 3 4 5 6 7 8 |
| Tissue | Expression Dynamics | Abbreviation |
| Cervix |  | CC: Cervix cancer |
| HSIL_HPV: HPV-infected high-grade squamous intraepithelial lesions | ||
| N_HPV: HPV-infected normal cervix | ||
| Esophagus |  | ESCC: Esophageal squamous cell carcinoma |
| HGIN: High-grade intraepithelial neoplasias | ||
| LGIN: Low-grade intraepithelial neoplasias | ||
| Liver |  | HCC: Hepatocellular carcinoma |
| NAFLD: Non-alcoholic fatty liver disease | ||
| Lung |  | AAH: Atypical adenomatous hyperplasia |
| AIS: Adenocarcinoma in situ | ||
| IAC: Invasive lung adenocarcinoma | ||
| MIA: Minimally invasive adenocarcinoma | ||
| Oral Cavity | 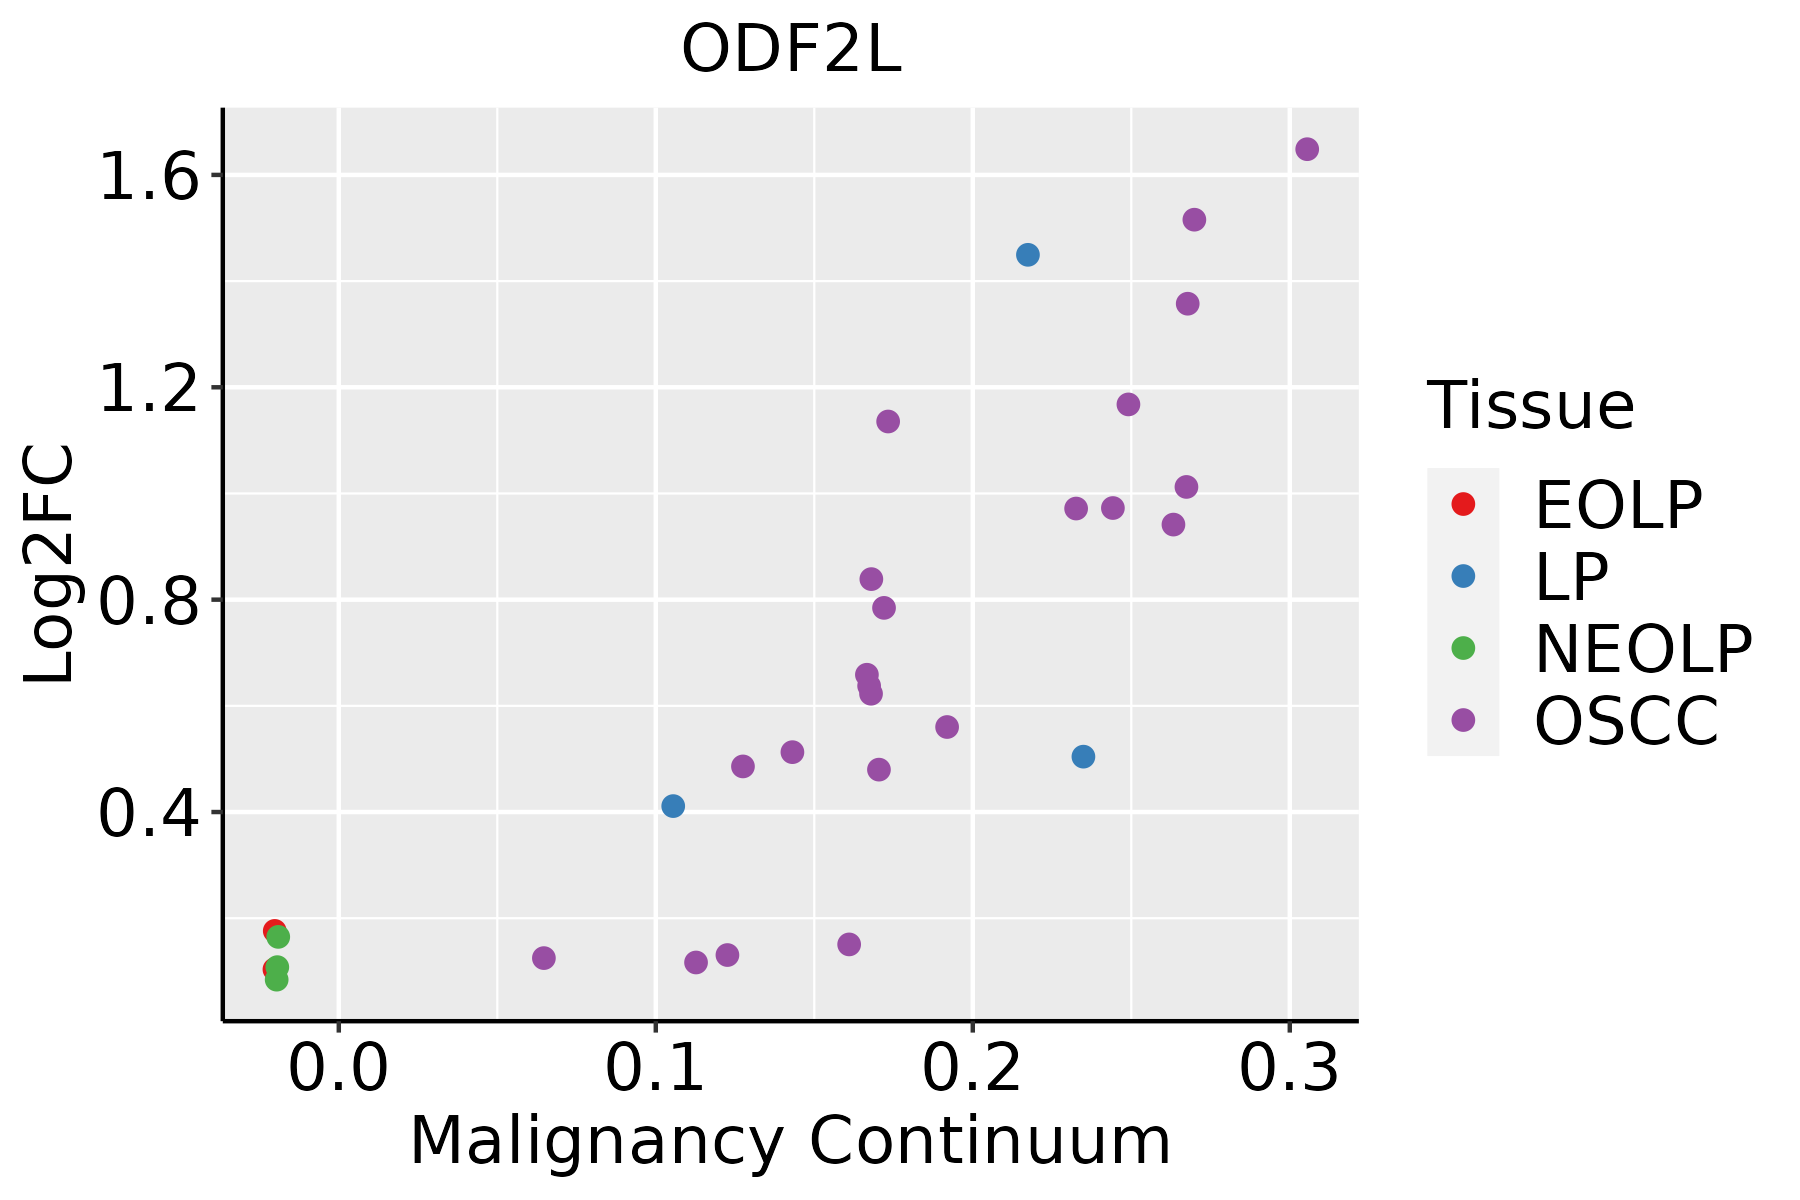 | EOLP: Erosive Oral lichen planus |
| LP: leukoplakia | ||
| NEOLP: Non-erosive oral lichen planus | ||
| OSCC: Oral squamous cell carcinoma | ||
| Skin |  | AK: Actinic keratosis |
| cSCC: Cutaneous squamous cell carcinoma | ||
| SCCIS:squamous cell carcinoma in situ | ||
| Thyroid | 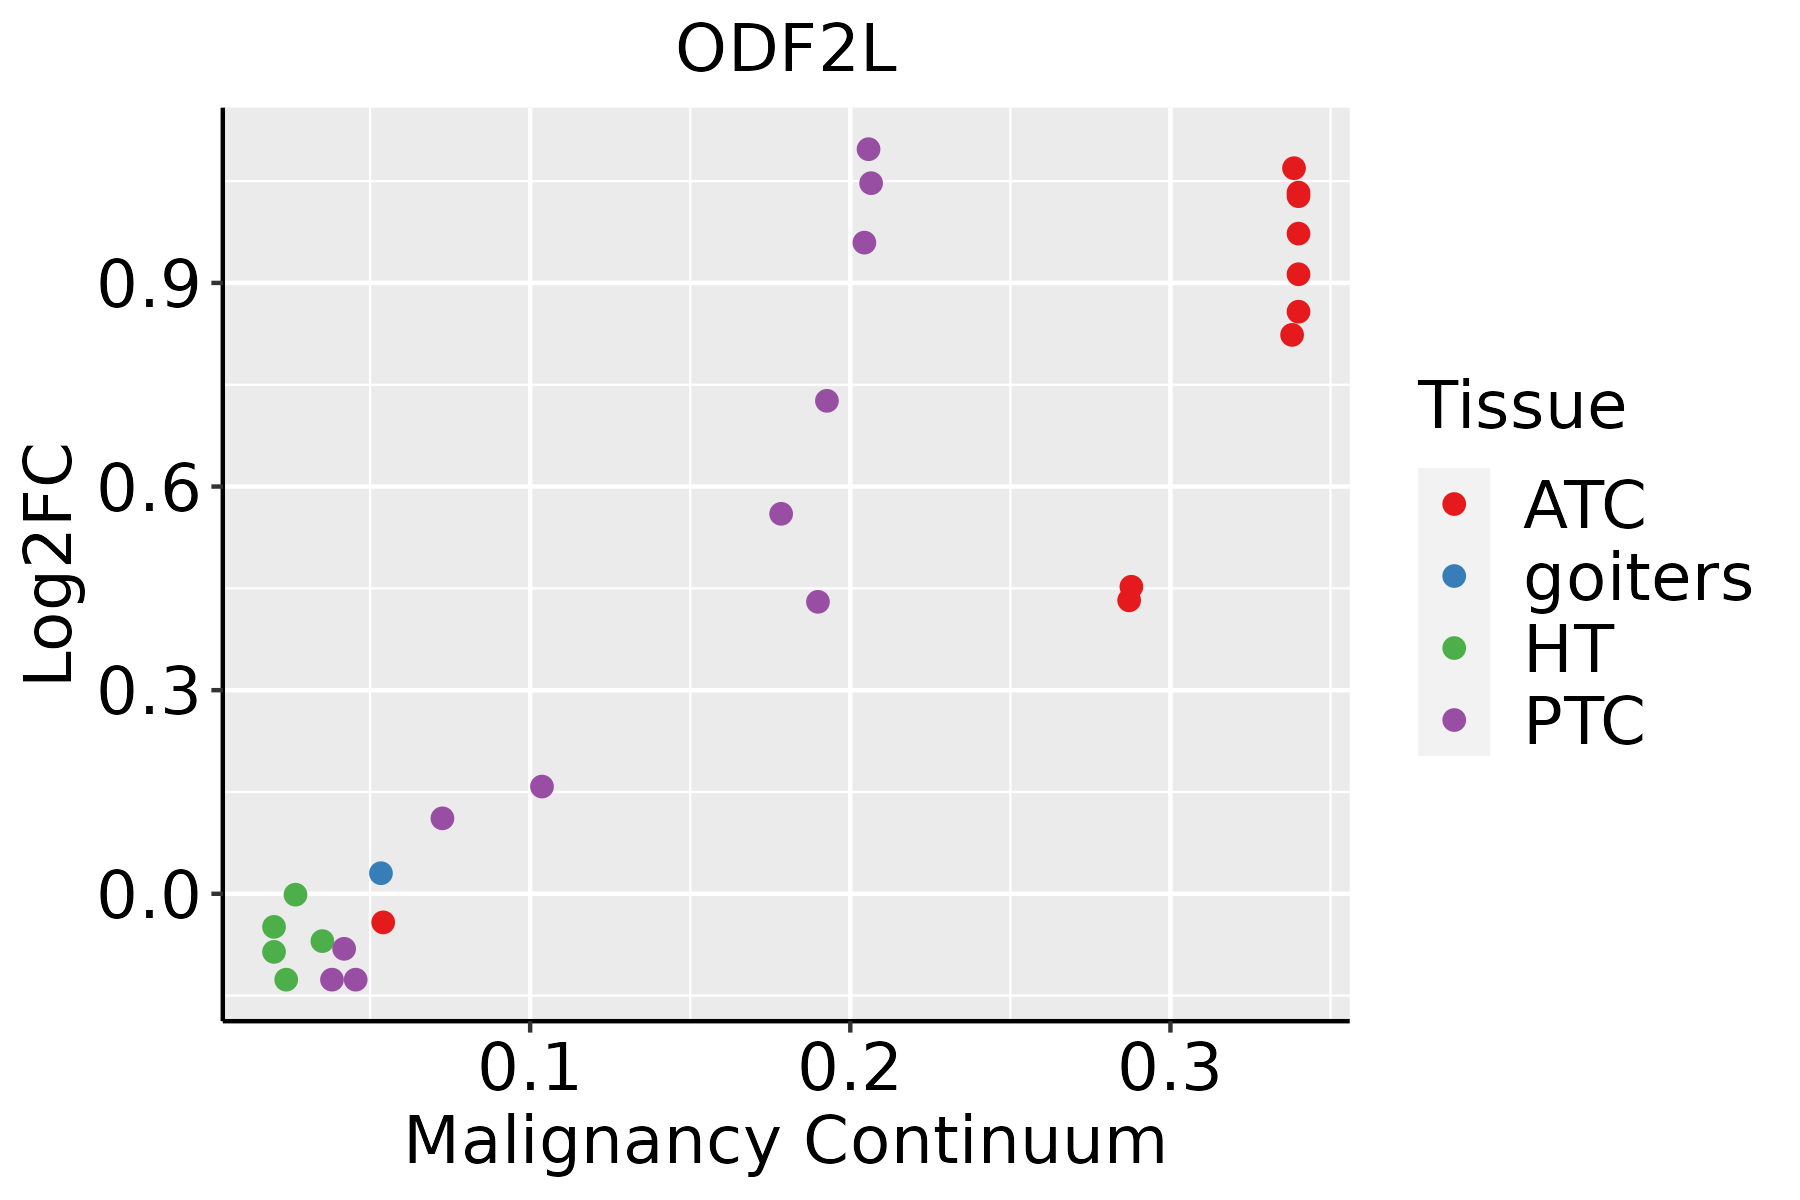 | ATC: Anaplastic thyroid cancer |
| HT: Hashimoto's thyroiditis | ||
| PTC: Papillary thyroid cancer |
| ∗log2FC in expression of this searched gene in stem-like cells from each diseased tissue sample relative to stem-like cells in normal samples in each tissue plotted against the malignancy continuum. Samples are colored based on if they are from different disease stage. |
Top |
Malignant transformation related pathway analysis |
| Find out the enriched GO biological processes and KEGG pathways involved in transition from healthy to precancer to cancer |
| Tissue | Disease Stage | Enriched GO biological Processes |
| Colorectum | AD |  |
| Colorectum | SER |  |
| Colorectum | MSS |  |
| Colorectum | MSI-H |  |
| Colorectum | FAP |  |
| ∗Top 15 enriched GO BP terms are showed in the bar plot of each disease state in each tissue. Each row represents a significant GO biological process which is colored according to the -log10(p.adjust). |
| Page: 1 2 3 4 5 6 7 8 9 |
| GO ID | Tissue | Disease Stage | Description | Gene Ratio | Bg Ratio | pvalue | p.adjust | Count |
| GO:00106399 | Cervix | CC | negative regulation of organelle organization | 68/2311 | 348/18723 | 7.40e-05 | 1.03e-03 | 68 |
| GO:19021153 | Cervix | CC | regulation of organelle assembly | 40/2311 | 186/18723 | 2.92e-04 | 3.15e-03 | 40 |
| GO:00313456 | Cervix | CC | negative regulation of cell projection organization | 39/2311 | 186/18723 | 5.86e-04 | 5.57e-03 | 39 |
| GO:01200328 | Cervix | CC | regulation of plasma membrane bounded cell projection assembly | 38/2311 | 186/18723 | 1.14e-03 | 9.35e-03 | 38 |
| GO:00604917 | Cervix | CC | regulation of cell projection assembly | 38/2311 | 188/18723 | 1.40e-03 | 1.10e-02 | 38 |
| GO:001063920 | Esophagus | HGIN | negative regulation of organelle organization | 79/2587 | 348/18723 | 4.12e-06 | 1.37e-04 | 79 |
| GO:19021156 | Esophagus | HGIN | regulation of organelle assembly | 46/2587 | 186/18723 | 4.63e-05 | 1.12e-03 | 46 |
| GO:19021162 | Esophagus | HGIN | negative regulation of organelle assembly | 13/2587 | 41/18723 | 2.62e-03 | 2.58e-02 | 13 |
| GO:006049117 | Esophagus | HGIN | regulation of cell projection assembly | 39/2587 | 188/18723 | 5.61e-03 | 4.57e-02 | 39 |
| GO:0010639110 | Esophagus | ESCC | negative regulation of organelle organization | 215/8552 | 348/18723 | 8.20e-10 | 2.01e-08 | 215 |
| GO:190211514 | Esophagus | ESCC | regulation of organelle assembly | 116/8552 | 186/18723 | 3.15e-06 | 3.53e-05 | 116 |
| GO:006049118 | Esophagus | ESCC | regulation of cell projection assembly | 110/8552 | 188/18723 | 2.60e-04 | 1.58e-03 | 110 |
| GO:012003218 | Esophagus | ESCC | regulation of plasma membrane bounded cell projection assembly | 108/8552 | 186/18723 | 4.37e-04 | 2.46e-03 | 108 |
| GO:190211611 | Esophagus | ESCC | negative regulation of organelle assembly | 28/8552 | 41/18723 | 2.88e-03 | 1.21e-02 | 28 |
| GO:00106397 | Liver | Cirrhotic | negative regulation of organelle organization | 124/4634 | 348/18723 | 3.20e-06 | 5.60e-05 | 124 |
| GO:1902115 | Liver | Cirrhotic | regulation of organelle assembly | 66/4634 | 186/18723 | 6.66e-04 | 5.04e-03 | 66 |
| GO:01200326 | Liver | Cirrhotic | regulation of plasma membrane bounded cell projection assembly | 63/4634 | 186/18723 | 3.16e-03 | 1.78e-02 | 63 |
| GO:00604915 | Liver | Cirrhotic | regulation of cell projection assembly | 63/4634 | 188/18723 | 4.17e-03 | 2.22e-02 | 63 |
| GO:001063912 | Liver | HCC | negative regulation of organelle organization | 204/7958 | 348/18723 | 7.67e-10 | 2.37e-08 | 204 |
| GO:19021151 | Liver | HCC | regulation of organelle assembly | 110/7958 | 186/18723 | 3.30e-06 | 4.34e-05 | 110 |
| Page: 1 2 3 4 |
| Pathway ID | Tissue | Disease Stage | Description | Gene Ratio | Bg Ratio | pvalue | p.adjust | qvalue | Count |
| Page: 1 |
Top |
Cell-cell communication analysis |
| Identification of potential cell-cell interactions between two cell types and their ligand-receptor pairs for different disease states |
| Ligand | Receptor | LRpair | Pathway | Tissue | Disease Stage |
| Page: 1 |
Top |
Single-cell gene regulatory network inference analysis |
| Find out the significant the regulons (TFs) and the target genes of each regulon across cell types for different disease states |
| TF | Cell Type | Tissue | Disease Stage | Target Gene | RSS | Regulon Activity |
| ∗The dot plots of a searched regulon are shown for all cell subpopulations in each disease state of each tissue based on the regulon specific score inferred using pySCENIC and by calculating the average expression. |
| Page: 1 |
Top |
Somatic mutation of malignant transformation related genes |
| Annotation of somatic variants for genes involved in malignant transformation |
| Hugo Symbol | Variant Class | Variant Classification | dbSNP RS | HGVSc | HGVSp | HGVSp Short | SWISSPROT | BIOTYPE | SIFT | PolyPhen | Tumor Sample Barcode | Tissue | Histology | Sex | Age | Stage | Therapy Types | Drugs | Outcome |
| ODF2L | SNV | Missense_Mutation | c.377G>C | p.Gly126Ala | p.G126A | Q9ULJ1 | protein_coding | tolerated(0.22) | benign(0.108) | TCGA-AC-A23H-01 | Breast | breast invasive carcinoma | Female | >=65 | I/II | Unknown | Unknown | PD | |
| ODF2L | SNV | Missense_Mutation | c.241G>C | p.Glu81Gln | p.E81Q | Q9ULJ1 | protein_coding | tolerated(0.21) | possibly_damaging(0.806) | TCGA-AC-A23H-01 | Breast | breast invasive carcinoma | Female | >=65 | I/II | Unknown | Unknown | PD | |
| ODF2L | SNV | Missense_Mutation | c.773N>T | p.Gly258Val | p.G258V | Q9ULJ1 | protein_coding | tolerated(0.08) | possibly_damaging(0.745) | TCGA-D8-A1XV-01 | Breast | breast invasive carcinoma | Female | >=65 | I/II | Unknown | Unknown | SD | |
| ODF2L | insertion | Nonsense_Mutation | novel | c.289_290insTAT | p.Glu97delinsValTer | p.E97delinsV* | Q9ULJ1 | protein_coding | TCGA-AR-A0TU-01 | Breast | breast invasive carcinoma | Female | <65 | I/II | Unspecific | Doxorubicin | SD | ||
| ODF2L | insertion | Nonsense_Mutation | novel | c.288_289insAATATATAGATAT | p.Glu97AsnfsTer3 | p.E97Nfs*3 | Q9ULJ1 | protein_coding | TCGA-AR-A0TU-01 | Breast | breast invasive carcinoma | Female | <65 | I/II | Unspecific | Doxorubicin | SD | ||
| ODF2L | SNV | Missense_Mutation | novel | c.1438N>T | p.His480Tyr | p.H480Y | Q9ULJ1 | protein_coding | deleterious(0.03) | benign(0.093) | TCGA-JW-A5VL-01 | Cervix | cervical & endocervical cancer | Female | <65 | I/II | Unknown | Unknown | SD |
| ODF2L | SNV | Missense_Mutation | c.1652T>C | p.Leu551Pro | p.L551P | Q9ULJ1 | protein_coding | deleterious(0) | probably_damaging(0.994) | TCGA-A6-2686-01 | Colorectum | colon adenocarcinoma | Female | >=65 | I/II | Unknown | Unknown | SD | |
| ODF2L | SNV | Missense_Mutation | novel | c.1454G>T | p.Ser485Ile | p.S485I | Q9ULJ1 | protein_coding | deleterious(0.02) | benign(0.406) | TCGA-AA-3941-01 | Colorectum | colon adenocarcinoma | Female | >=65 | I/II | Unknown | Unknown | SD |
| ODF2L | SNV | Missense_Mutation | novel | c.11N>A | p.Ala4Asp | p.A4D | Q9ULJ1 | protein_coding | deleterious_low_confidence(0) | benign(0.069) | TCGA-AA-3950-01 | Colorectum | colon adenocarcinoma | Female | >=65 | I/II | Unknown | Unknown | SD |
| ODF2L | SNV | Missense_Mutation | rs759040783 | c.1342A>C | p.Asn448His | p.N448H | Q9ULJ1 | protein_coding | tolerated(0.32) | probably_damaging(0.946) | TCGA-AA-3977-01 | Colorectum | colon adenocarcinoma | Male | >=65 | I/II | Unknown | Unknown | SD |
| Page: 1 2 3 4 5 6 7 8 |
Top |
Related drugs of malignant transformation related genes |
| Identification of chemicals and drugs interact with genes involved in malignant transfromation |
| (DGIdb 4.0) |
| Entrez ID | Symbol | Category | Interaction Types | Drug Claim Name | Drug Name | PMIDs |
| Page: 1 |

Copyright 2023-Present -The University of Texas Health Science Center at Houston |