| Tissue | Expression Dynamics | Abbreviation |
| Cervix | 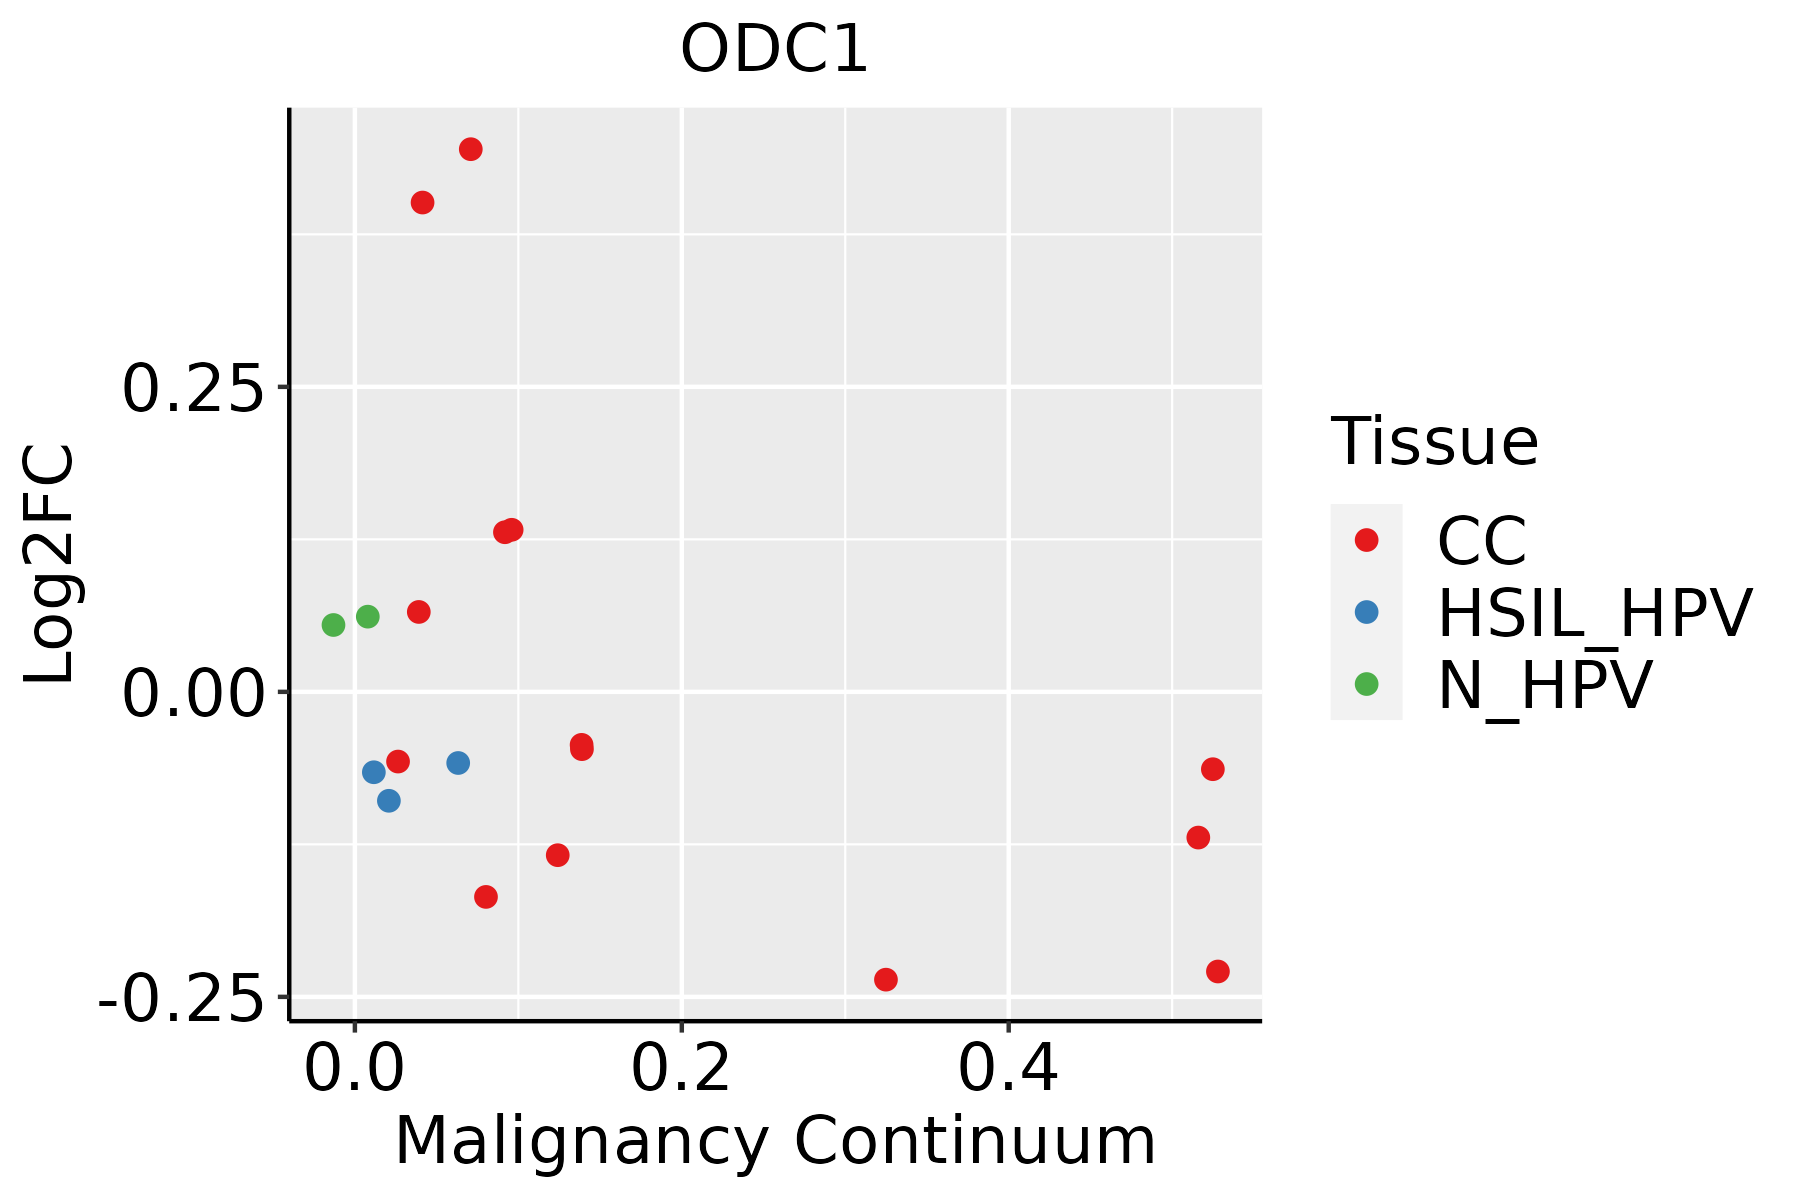 | CC: Cervix cancer |
| HSIL_HPV: HPV-infected high-grade squamous intraepithelial lesions |
| N_HPV: HPV-infected normal cervix |
| Colorectum (GSE201348) |  | FAP: Familial adenomatous polyposis |
| CRC: Colorectal cancer |
| Colorectum (HTA11) |  | AD: Adenomas |
| SER: Sessile serrated lesions |
| MSI-H: Microsatellite-high colorectal cancer |
| MSS: Microsatellite stable colorectal cancer |
| Esophagus | 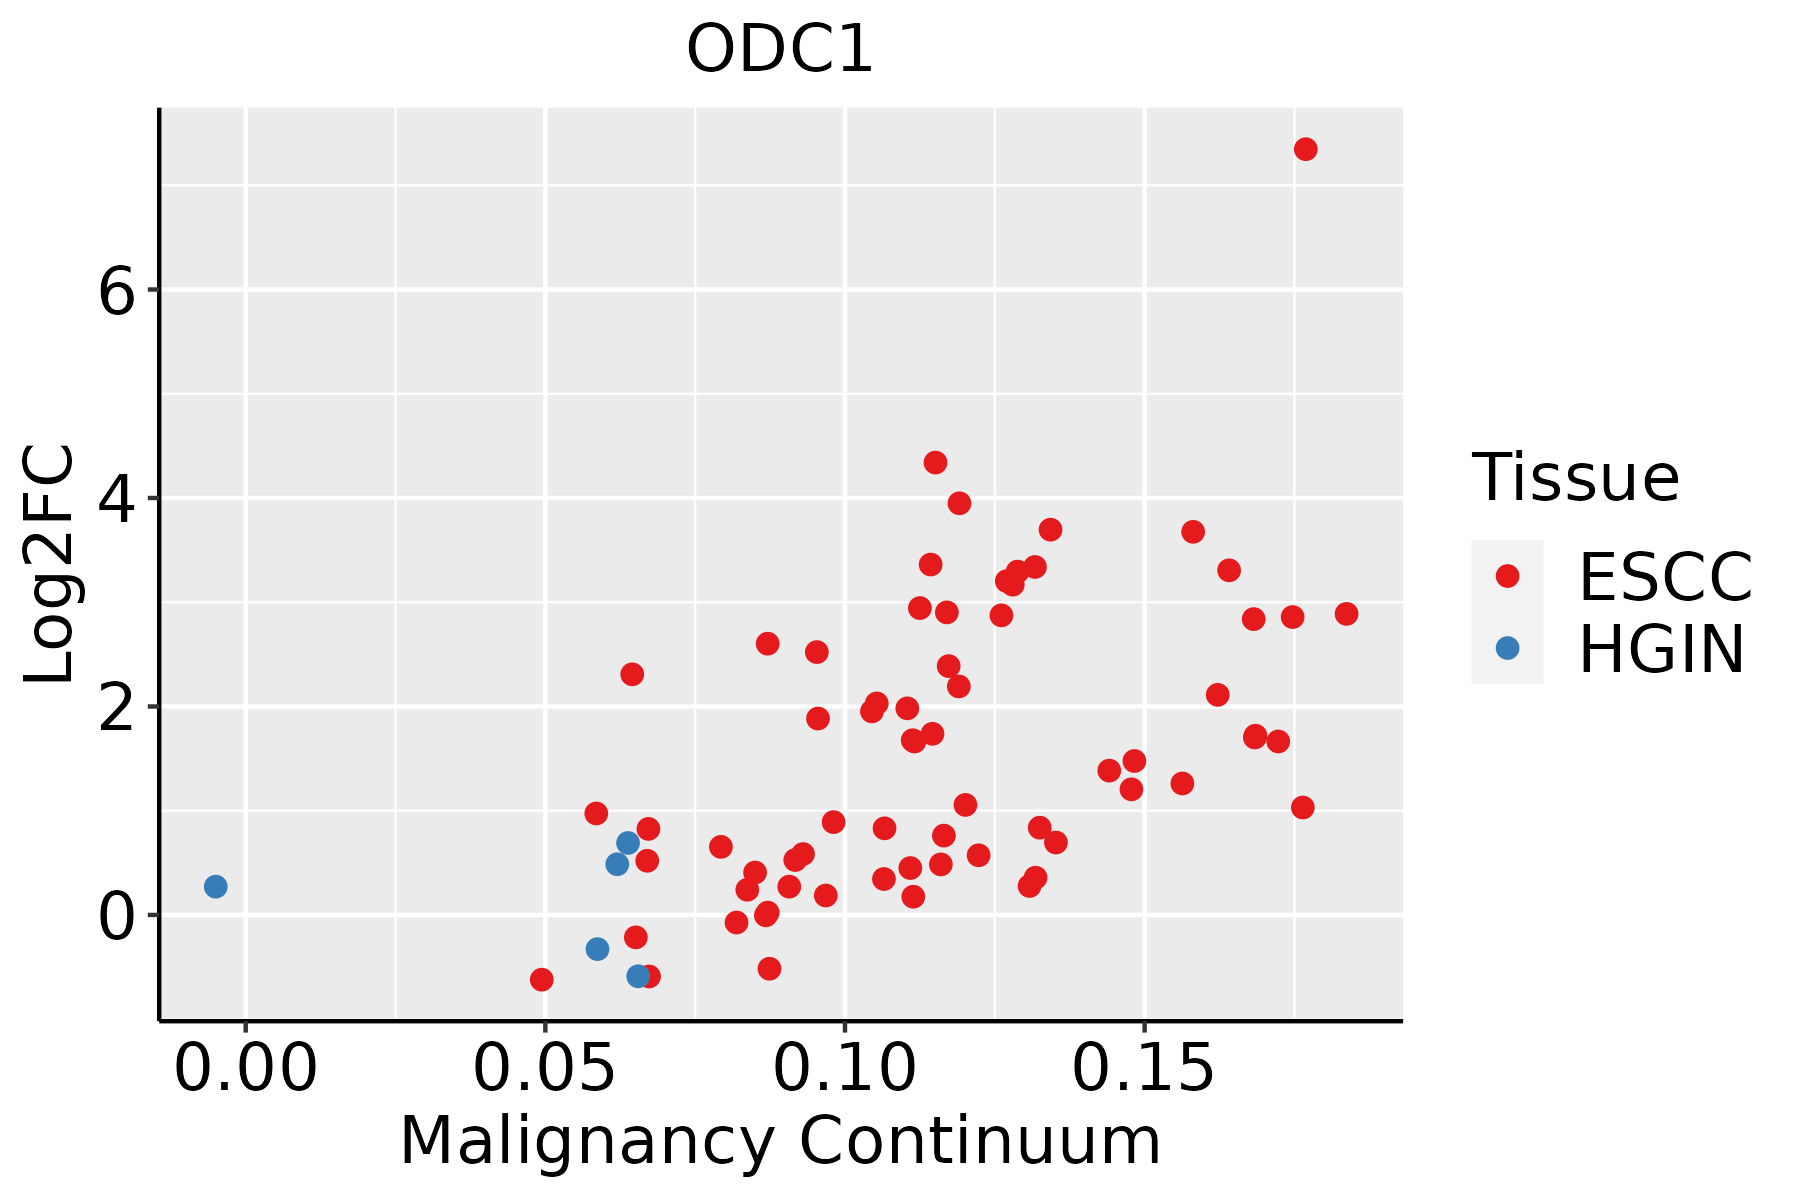 | ESCC: Esophageal squamous cell carcinoma |
| HGIN: High-grade intraepithelial neoplasias |
| LGIN: Low-grade intraepithelial neoplasias |
| Liver | 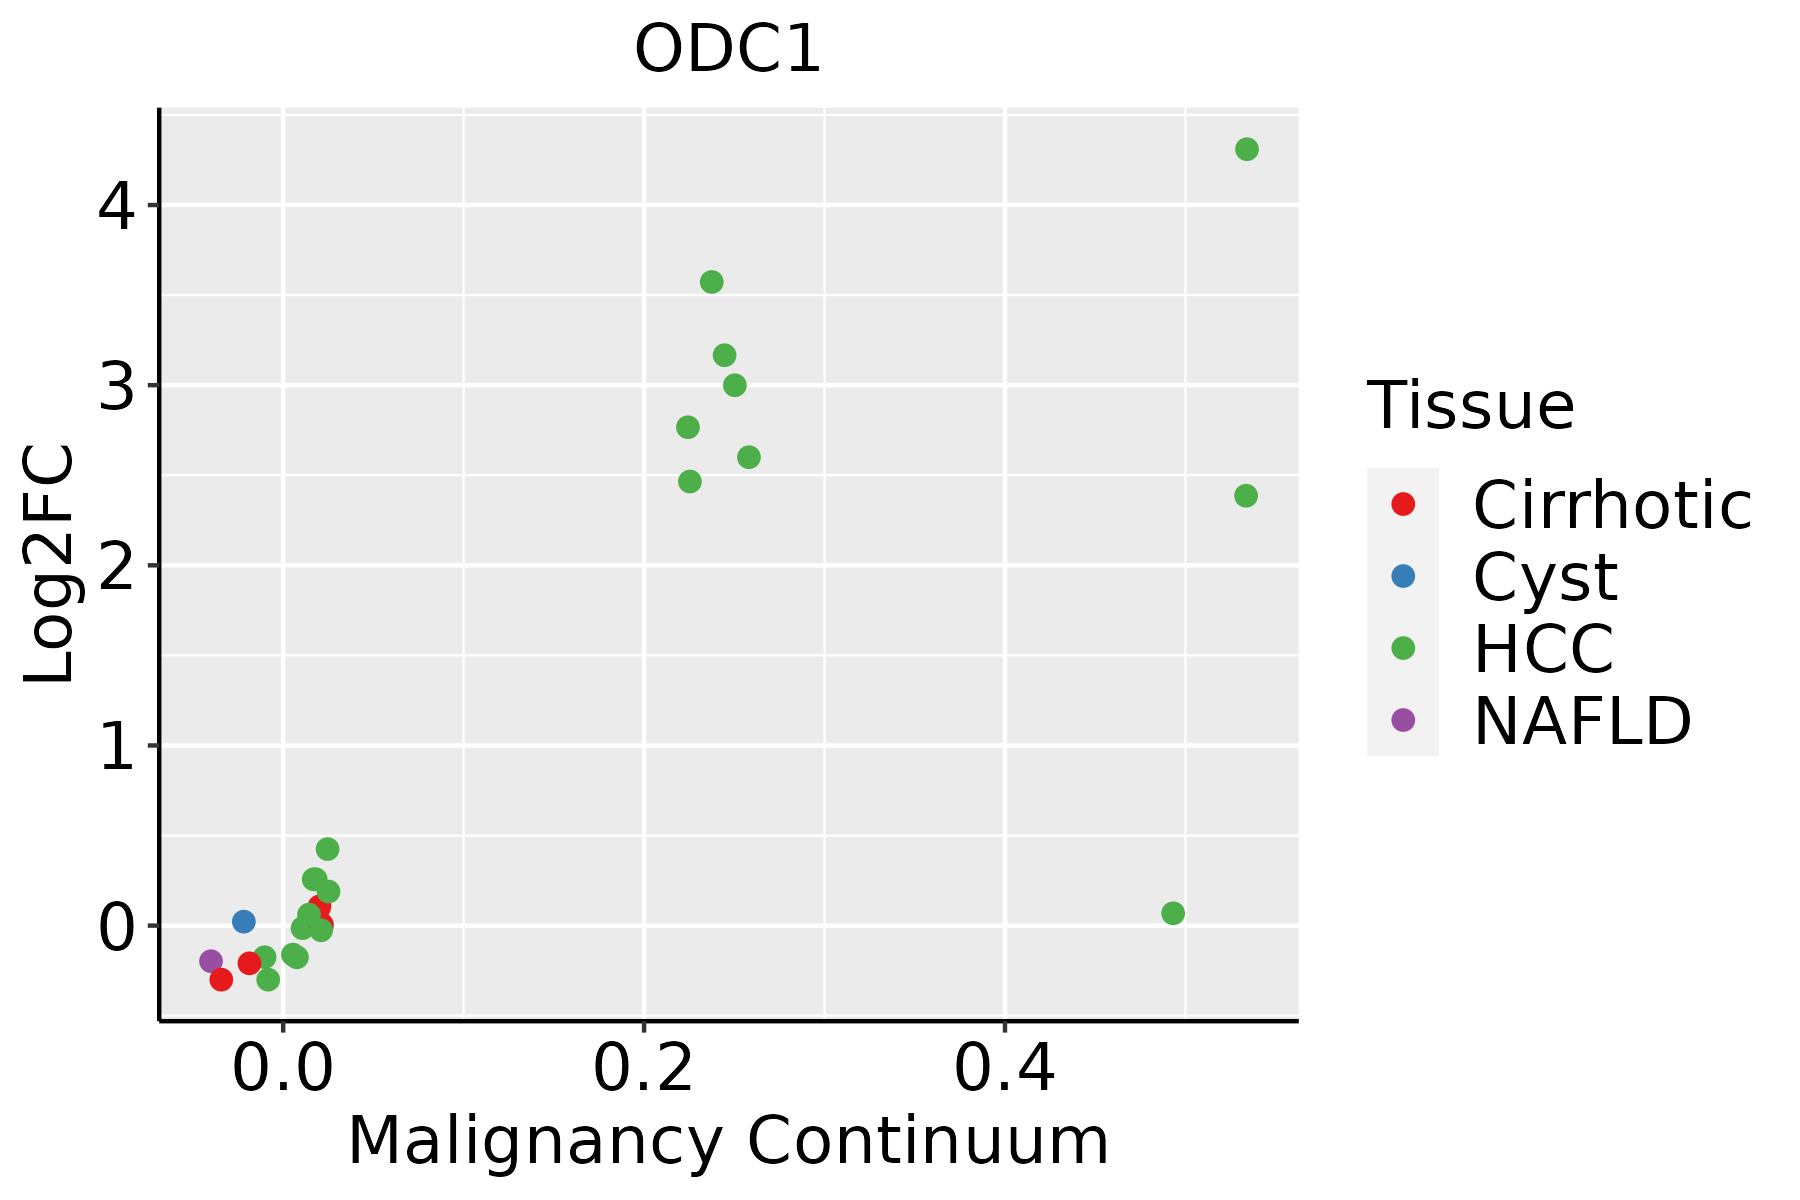 | HCC: Hepatocellular carcinoma |
| NAFLD: Non-alcoholic fatty liver disease |
| Oral Cavity |  | EOLP: Erosive Oral lichen planus |
| LP: leukoplakia |
| NEOLP: Non-erosive oral lichen planus |
| OSCC: Oral squamous cell carcinoma |
| Prostate | 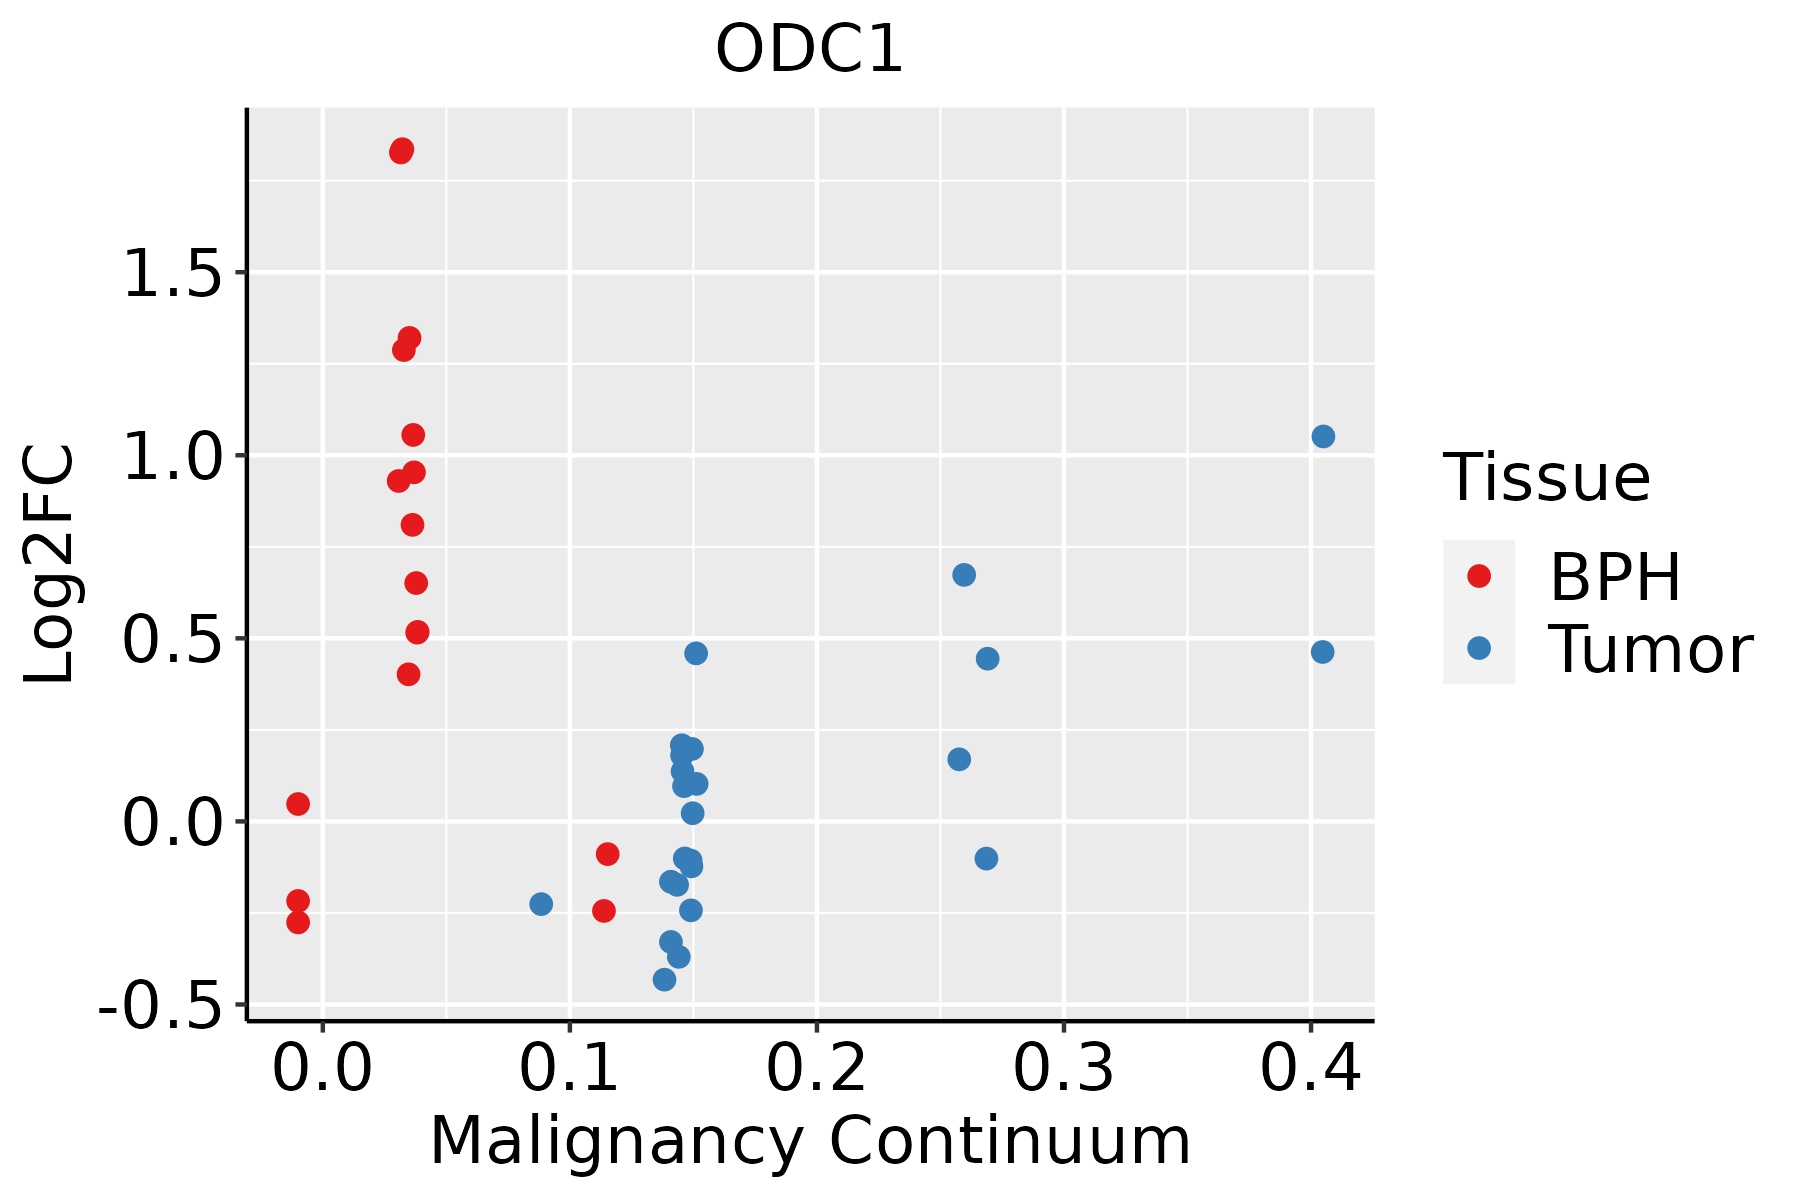 | BPH: Benign Prostatic Hyperplasia |
| Skin |  | AK: Actinic keratosis |
| cSCC: Cutaneous squamous cell carcinoma |
| SCCIS:squamous cell carcinoma in situ |
| Thyroid | 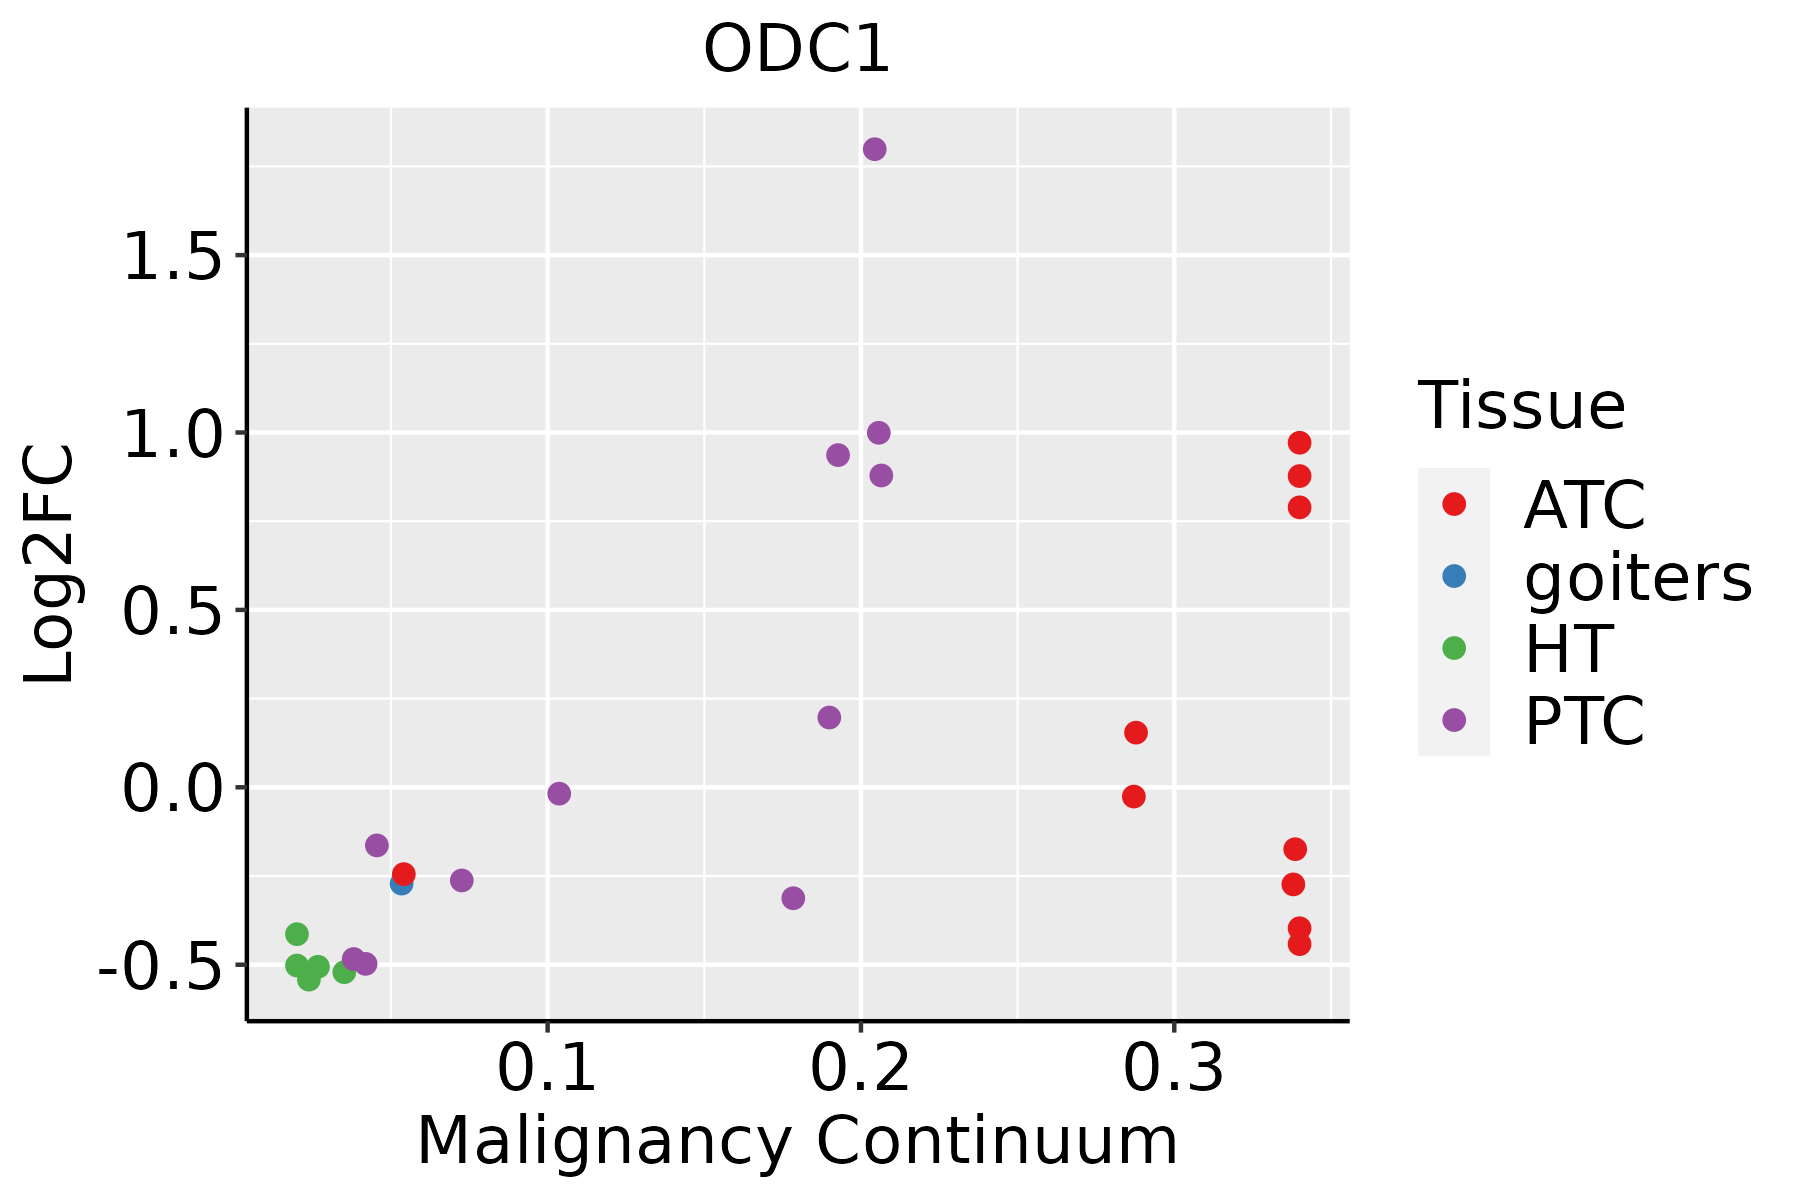 | ATC: Anaplastic thyroid cancer |
| HT: Hashimoto's thyroiditis |
| PTC: Papillary thyroid cancer |
| GO ID | Tissue | Disease Stage | Description | Gene Ratio | Bg Ratio | pvalue | p.adjust | Count |
| GO:004217610 | Cervix | CC | regulation of protein catabolic process | 104/2311 | 391/18723 | 9.39e-15 | 9.36e-12 | 104 |
| GO:00096158 | Cervix | CC | response to virus | 73/2311 | 367/18723 | 2.22e-05 | 3.95e-04 | 73 |
| GO:0042176 | Colorectum | AD | regulation of protein catabolic process | 160/3918 | 391/18723 | 1.06e-19 | 7.34e-17 | 160 |
| GO:0006520 | Colorectum | AD | cellular amino acid metabolic process | 81/3918 | 284/18723 | 1.37e-03 | 1.19e-02 | 81 |
| GO:00421761 | Colorectum | SER | regulation of protein catabolic process | 126/2897 | 391/18723 | 5.33e-17 | 2.52e-14 | 126 |
| GO:00065201 | Colorectum | SER | cellular amino acid metabolic process | 61/2897 | 284/18723 | 4.20e-03 | 3.41e-02 | 61 |
| GO:00421762 | Colorectum | MSS | regulation of protein catabolic process | 145/3467 | 391/18723 | 2.03e-18 | 1.17e-15 | 145 |
| GO:0006596 | Colorectum | MSS | polyamine biosynthetic process | 7/3467 | 14/18723 | 7.51e-03 | 4.72e-02 | 7 |
| GO:00421763 | Colorectum | MSI-H | regulation of protein catabolic process | 65/1319 | 391/18723 | 6.96e-11 | 1.29e-08 | 65 |
| GO:1901605 | Colorectum | MSI-H | alpha-amino acid metabolic process | 26/1319 | 195/18723 | 1.26e-03 | 2.02e-02 | 26 |
| GO:0009615 | Colorectum | MSI-H | response to virus | 40/1319 | 367/18723 | 3.99e-03 | 4.61e-02 | 40 |
| GO:00421764 | Colorectum | FAP | regulation of protein catabolic process | 106/2622 | 391/18723 | 5.00e-12 | 3.06e-09 | 106 |
| GO:0042176111 | Esophagus | ESCC | regulation of protein catabolic process | 280/8552 | 391/18723 | 8.65e-26 | 2.39e-23 | 280 |
| GO:000961518 | Esophagus | ESCC | response to virus | 238/8552 | 367/18723 | 6.65e-14 | 3.32e-12 | 238 |
| GO:004217612 | Liver | Cirrhotic | regulation of protein catabolic process | 181/4634 | 391/18723 | 7.94e-21 | 2.77e-18 | 181 |
| GO:19016051 | Liver | Cirrhotic | alpha-amino acid metabolic process | 82/4634 | 195/18723 | 7.72e-08 | 2.30e-06 | 82 |
| GO:000652011 | Liver | Cirrhotic | cellular amino acid metabolic process | 103/4634 | 284/18723 | 8.88e-06 | 1.30e-04 | 103 |
| GO:00096155 | Liver | Cirrhotic | response to virus | 126/4634 | 367/18723 | 2.10e-05 | 2.77e-04 | 126 |
| GO:0006595 | Liver | Cirrhotic | polyamine metabolic process | 12/4634 | 18/18723 | 2.07e-04 | 1.90e-03 | 12 |
| GO:00065962 | Liver | Cirrhotic | polyamine biosynthetic process | 10/4634 | 14/18723 | 3.11e-04 | 2.72e-03 | 10 |
| Pathway ID | Tissue | Disease Stage | Description | Gene Ratio | Bg Ratio | pvalue | p.adjust | qvalue | Count |
| hsa00330 | Colorectum | AD | Arginine and proline metabolism | 23/2092 | 50/8465 | 8.27e-04 | 5.90e-03 | 3.76e-03 | 23 |
| hsa00480 | Colorectum | AD | Glutathione metabolism | 23/2092 | 57/8465 | 6.52e-03 | 2.76e-02 | 1.76e-02 | 23 |
| hsa003301 | Colorectum | AD | Arginine and proline metabolism | 23/2092 | 50/8465 | 8.27e-04 | 5.90e-03 | 3.76e-03 | 23 |
| hsa004801 | Colorectum | AD | Glutathione metabolism | 23/2092 | 57/8465 | 6.52e-03 | 2.76e-02 | 1.76e-02 | 23 |
| hsa003304 | Colorectum | MSS | Arginine and proline metabolism | 23/1875 | 50/8465 | 1.52e-04 | 1.24e-03 | 7.61e-04 | 23 |
| hsa004802 | Colorectum | MSS | Glutathione metabolism | 22/1875 | 57/8465 | 3.58e-03 | 1.64e-02 | 1.01e-02 | 22 |
| hsa003305 | Colorectum | MSS | Arginine and proline metabolism | 23/1875 | 50/8465 | 1.52e-04 | 1.24e-03 | 7.61e-04 | 23 |
| hsa004803 | Colorectum | MSS | Glutathione metabolism | 22/1875 | 57/8465 | 3.58e-03 | 1.64e-02 | 1.01e-02 | 22 |
| hsa003306 | Colorectum | FAP | Arginine and proline metabolism | 16/1404 | 50/8465 | 5.33e-03 | 2.10e-02 | 1.27e-02 | 16 |
| hsa003307 | Colorectum | FAP | Arginine and proline metabolism | 16/1404 | 50/8465 | 5.33e-03 | 2.10e-02 | 1.27e-02 | 16 |
| hsa0048018 | Esophagus | ESCC | Glutathione metabolism | 44/4205 | 57/8465 | 1.81e-05 | 9.03e-05 | 4.63e-05 | 44 |
| hsa0048019 | Esophagus | ESCC | Glutathione metabolism | 44/4205 | 57/8465 | 1.81e-05 | 9.03e-05 | 4.63e-05 | 44 |
| hsa004809 | Liver | Cirrhotic | Glutathione metabolism | 30/2530 | 57/8465 | 2.63e-04 | 1.72e-03 | 1.06e-03 | 30 |
| hsa003308 | Liver | Cirrhotic | Arginine and proline metabolism | 25/2530 | 50/8465 | 2.18e-03 | 9.41e-03 | 5.80e-03 | 25 |
| hsa0048012 | Liver | Cirrhotic | Glutathione metabolism | 30/2530 | 57/8465 | 2.63e-04 | 1.72e-03 | 1.06e-03 | 30 |
| hsa0033011 | Liver | Cirrhotic | Arginine and proline metabolism | 25/2530 | 50/8465 | 2.18e-03 | 9.41e-03 | 5.80e-03 | 25 |
| hsa0048022 | Liver | HCC | Glutathione metabolism | 42/4020 | 57/8465 | 5.00e-05 | 2.62e-04 | 1.46e-04 | 42 |
| hsa0033021 | Liver | HCC | Arginine and proline metabolism | 33/4020 | 50/8465 | 6.28e-03 | 1.77e-02 | 9.83e-03 | 33 |
| hsa0048032 | Liver | HCC | Glutathione metabolism | 42/4020 | 57/8465 | 5.00e-05 | 2.62e-04 | 1.46e-04 | 42 |
| hsa0033031 | Liver | HCC | Arginine and proline metabolism | 33/4020 | 50/8465 | 6.28e-03 | 1.77e-02 | 9.83e-03 | 33 |
| Hugo Symbol | Variant Class | Variant Classification | dbSNP RS | HGVSc | HGVSp | HGVSp Short | SWISSPROT | BIOTYPE | SIFT | PolyPhen | Tumor Sample Barcode | Tissue | Histology | Sex | Age | Stage | Therapy Types | Drugs | Outcome |
| ODC1 | SNV | Missense_Mutation | novel | c.867N>G | p.Asn289Lys | p.N289K | P11926 | protein_coding | deleterious(0.03) | possibly_damaging(0.779) | TCGA-AN-A0FN-01 | Breast | breast invasive carcinoma | Female | <65 | I/II | Unknown | Unknown | SD |
| ODC1 | SNV | Missense_Mutation | novel | c.1306N>C | p.Thr436Pro | p.T436P | P11926 | protein_coding | tolerated(0.41) | benign(0) | TCGA-D8-A1JA-01 | Breast | breast invasive carcinoma | Female | <65 | III/IV | Chemotherapy | adriamycin | PD |
| ODC1 | insertion | Frame_Shift_Ins | novel | c.868_869insCGGAAGCCCCATCCTCCCAT | p.Ile290ThrfsTer15 | p.I290Tfs*15 | P11926 | protein_coding | | | TCGA-AN-A0FN-01 | Breast | breast invasive carcinoma | Female | <65 | I/II | Unknown | Unknown | SD |
| ODC1 | deletion | Frame_Shift_Del | novel | c.335delA | p.Asn112IlefsTer19 | p.N112Ifs*19 | P11926 | protein_coding | | | TCGA-D8-A27V-01 | Breast | breast invasive carcinoma | Female | <65 | I/II | Hormone Therapy | tamoxiphen | SD |
| ODC1 | SNV | Missense_Mutation | novel | c.484G>A | p.Ala162Thr | p.A162T | P11926 | protein_coding | deleterious(0.05) | benign(0.3) | TCGA-2W-A8YY-01 | Cervix | cervical & endocervical cancer | Female | <65 | I/II | Chemotherapy | cisplatin | CR |
| ODC1 | SNV | Missense_Mutation | rs759064940 | c.638N>G | p.Ser213Cys | p.S213C | P11926 | protein_coding | deleterious(0) | possibly_damaging(0.658) | TCGA-C5-A1MH-01 | Cervix | cervical & endocervical cancer | Female | >=65 | III/IV | Chemotherapy | cisplatin | PD |
| ODC1 | SNV | Missense_Mutation | novel | c.380N>A | p.Gly127Glu | p.G127E | P11926 | protein_coding | deleterious(0.04) | probably_damaging(0.99) | TCGA-C5-A2LZ-01 | Cervix | cervical & endocervical cancer | Female | >=65 | III/IV | Unknown | Unknown | PD |
| ODC1 | SNV | Missense_Mutation | rs368830902 | c.355C>G | p.Gln119Glu | p.Q119E | P11926 | protein_coding | deleterious(0.01) | benign(0.056) | TCGA-C5-A7UI-01 | Cervix | cervical & endocervical cancer | Female | <65 | I/II | Unknown | Unknown | SD |
| ODC1 | SNV | Missense_Mutation | novel | c.1058N>T | p.Ser353Phe | p.S353F | P11926 | protein_coding | deleterious(0) | possibly_damaging(0.516) | TCGA-EA-A3HU-01 | Cervix | cervical & endocervical cancer | Female | <65 | I/II | Unknown | Unknown | SD |
| ODC1 | SNV | Missense_Mutation | rs745661230 | c.199N>A | p.Ala67Thr | p.A67T | P11926 | protein_coding | tolerated(0.23) | probably_damaging(0.981) | TCGA-AA-3715-01 | Colorectum | colon adenocarcinoma | Male | >=65 | I/II | Unknown | Unknown | PD |


