
|
|||||
|
 | |
| |
| |
| |
| |
| |
|
Gene: OCLN |
Gene summary for OCLN |
| Gene information | Species | Human | Gene symbol | OCLN | Gene ID | 100506658 |
| Gene name | occludin | |
| Gene Alias | BLCPMG | |
| Cytomap | 5q13.2 | |
| Gene Type | protein-coding | GO ID | GO:0000226 | UniProtAcc | A8K3T2 |
Top |
Malignant transformation analysis |
| Identification of the aberrant gene expression in precancerous and cancerous lesions by comparing the gene expression of stem-like cells in diseased tissues with normal stem cells |
| Entrez ID | Symbol | Replicates | Species | Organ | Tissue | Adj P-value | Log2FC | Malignancy |
| 100506658 | OCLN | HTA11_3410_2000001011 | Human | Colorectum | AD | 1.39e-14 | -5.77e-01 | 0.0155 |
| 100506658 | OCLN | HTA11_2487_2000001011 | Human | Colorectum | SER | 2.22e-02 | -4.08e-01 | -0.1808 |
| 100506658 | OCLN | HTA11_1938_2000001011 | Human | Colorectum | AD | 9.40e-03 | -4.28e-01 | -0.0811 |
| 100506658 | OCLN | HTA11_3361_2000001011 | Human | Colorectum | AD | 1.78e-05 | -5.58e-01 | -0.1207 |
| 100506658 | OCLN | HTA11_696_2000001011 | Human | Colorectum | AD | 2.59e-07 | -3.96e-01 | -0.1464 |
| 100506658 | OCLN | HTA11_866_2000001011 | Human | Colorectum | AD | 6.82e-08 | -3.85e-01 | -0.1001 |
| 100506658 | OCLN | HTA11_1391_2000001011 | Human | Colorectum | AD | 1.68e-02 | -4.12e-01 | -0.059 |
| 100506658 | OCLN | HTA11_546_2000001011 | Human | Colorectum | AD | 2.22e-03 | -5.48e-01 | -0.0842 |
| 100506658 | OCLN | HTA11_866_3004761011 | Human | Colorectum | AD | 5.77e-10 | -5.27e-01 | 0.096 |
| 100506658 | OCLN | HTA11_10711_2000001011 | Human | Colorectum | AD | 1.62e-04 | -4.67e-01 | 0.0338 |
| 100506658 | OCLN | HTA11_7696_3000711011 | Human | Colorectum | AD | 8.49e-19 | -5.49e-01 | 0.0674 |
| 100506658 | OCLN | HTA11_6818_2000001021 | Human | Colorectum | AD | 6.49e-06 | -5.96e-01 | 0.0588 |
| 100506658 | OCLN | HTA11_99999970781_79442 | Human | Colorectum | MSS | 2.17e-15 | -5.14e-01 | 0.294 |
| 100506658 | OCLN | HTA11_99999974143_84620 | Human | Colorectum | MSS | 1.60e-11 | -4.83e-01 | 0.3005 |
| 100506658 | OCLN | F007 | Human | Colorectum | FAP | 7.01e-03 | -2.93e-01 | 0.1176 |
| 100506658 | OCLN | A002-C-010 | Human | Colorectum | FAP | 1.92e-06 | -2.84e-01 | 0.242 |
| 100506658 | OCLN | A001-C-207 | Human | Colorectum | FAP | 2.02e-05 | -3.09e-01 | 0.1278 |
| 100506658 | OCLN | A015-C-203 | Human | Colorectum | FAP | 2.15e-33 | -5.06e-01 | -0.1294 |
| 100506658 | OCLN | A015-C-204 | Human | Colorectum | FAP | 1.60e-09 | -4.49e-01 | -0.0228 |
| 100506658 | OCLN | A014-C-040 | Human | Colorectum | FAP | 8.52e-07 | -5.51e-01 | -0.1184 |
| Page: 1 2 3 4 5 6 7 |
| Tissue | Expression Dynamics | Abbreviation |
| Colorectum (GSE201348) | 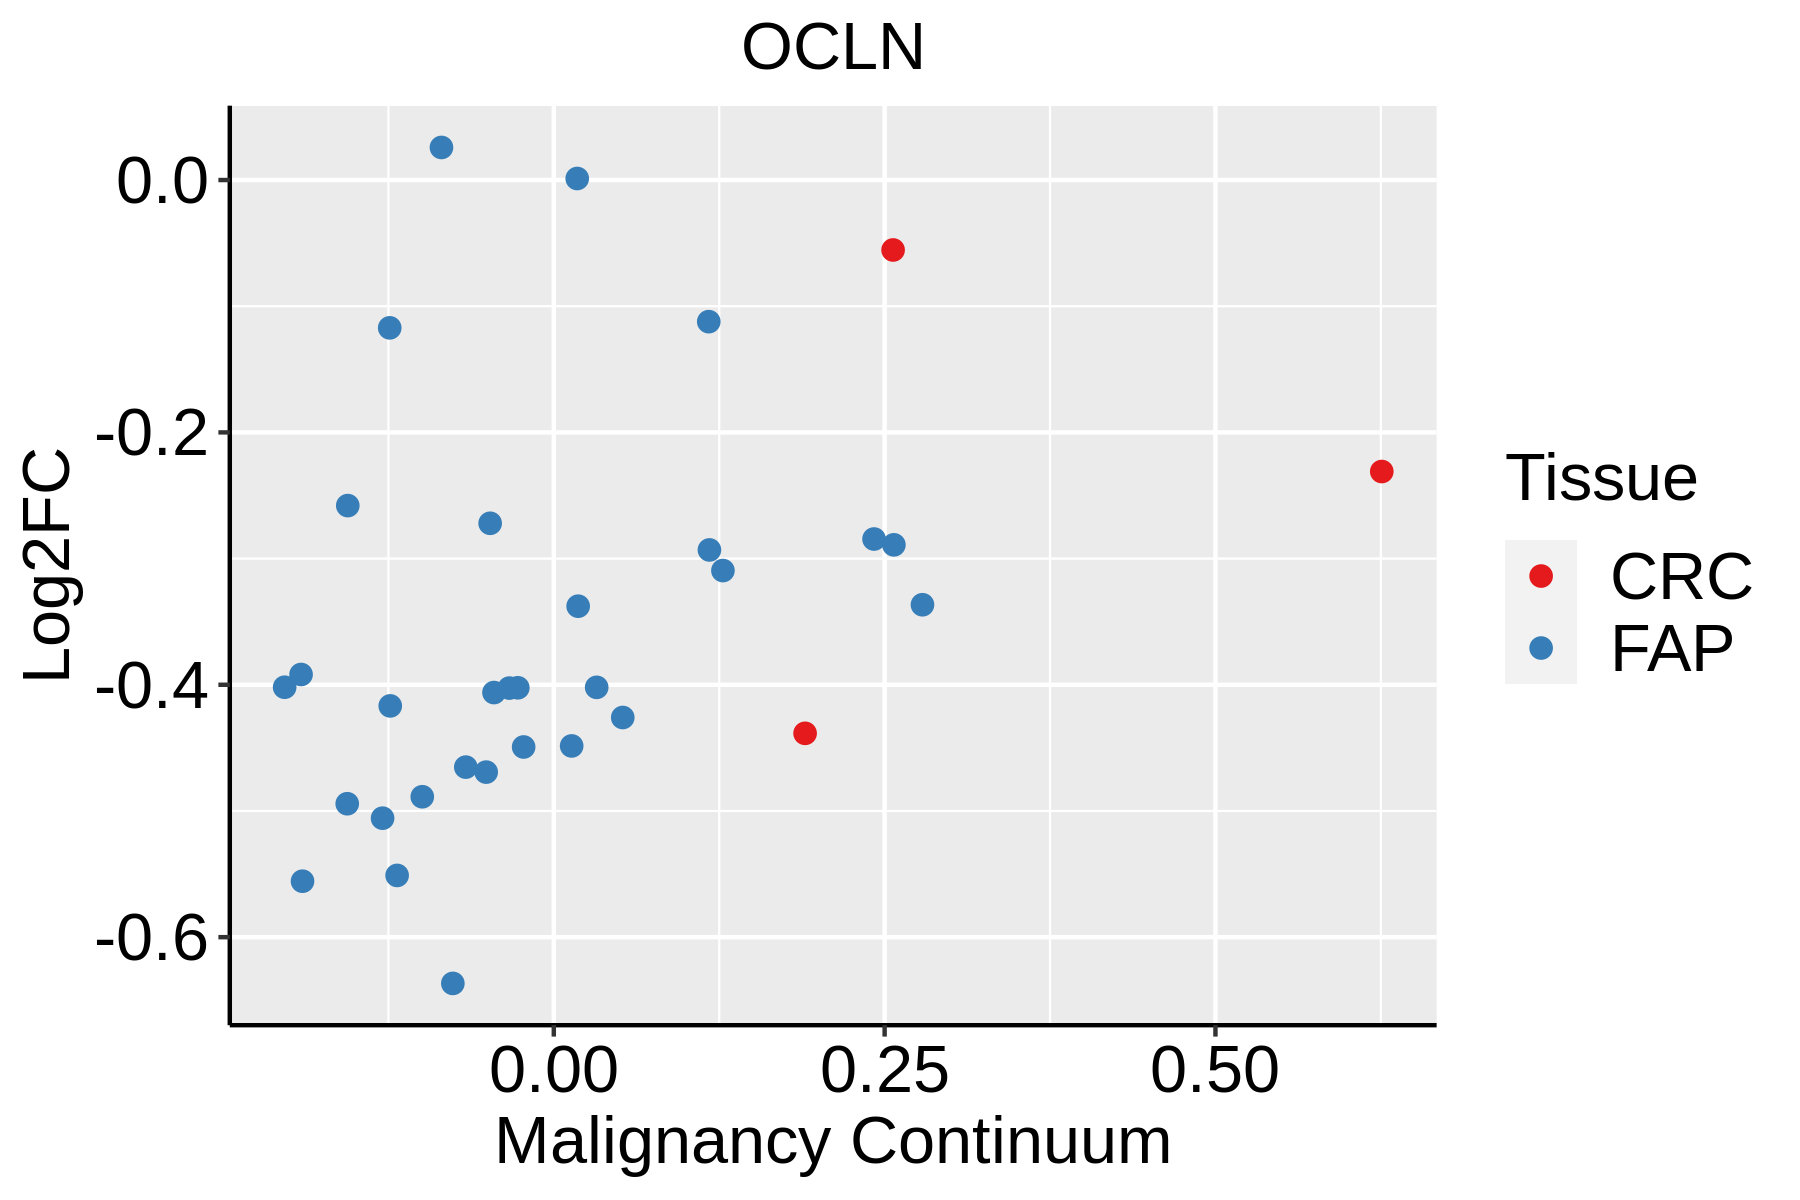 | FAP: Familial adenomatous polyposis |
| CRC: Colorectal cancer | ||
| Colorectum (HTA11) |  | AD: Adenomas |
| SER: Sessile serrated lesions | ||
| MSI-H: Microsatellite-high colorectal cancer | ||
| MSS: Microsatellite stable colorectal cancer | ||
| Esophagus | 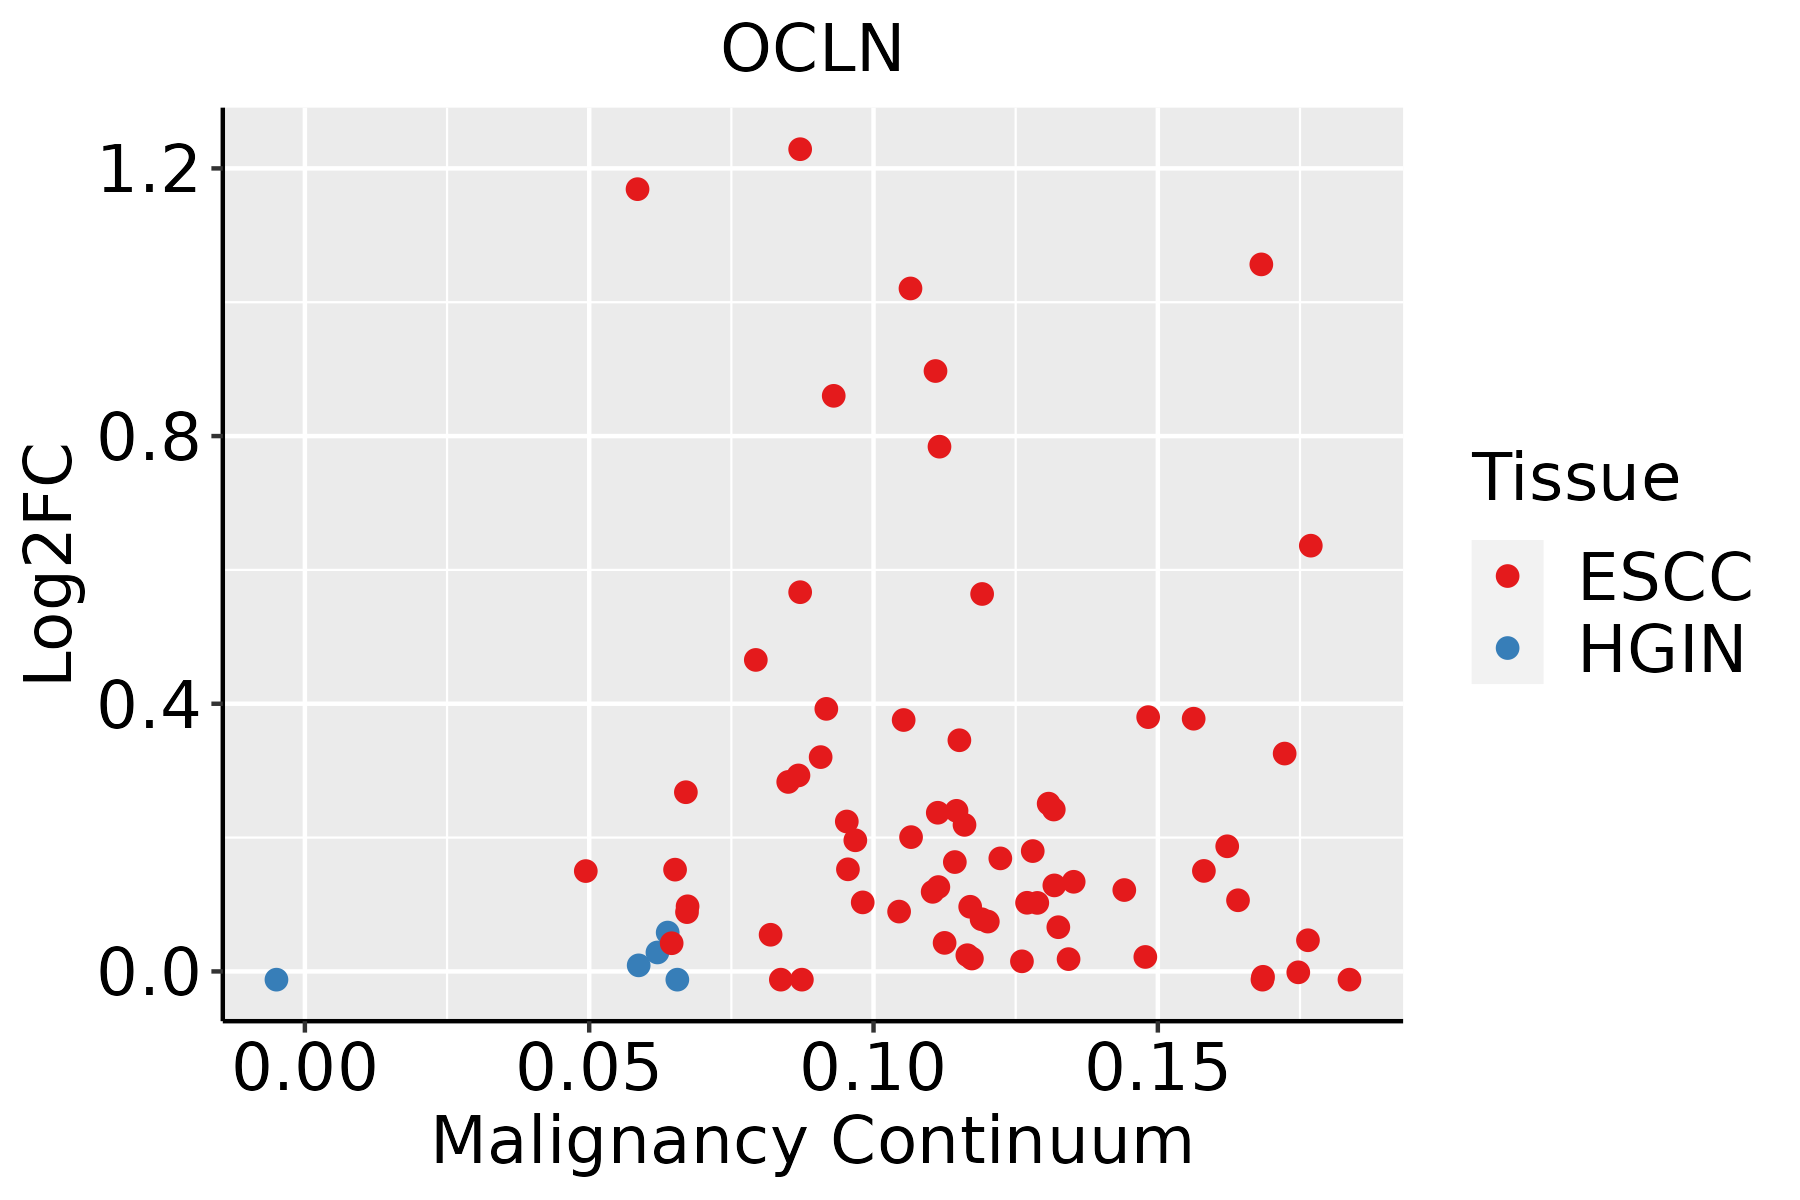 | ESCC: Esophageal squamous cell carcinoma |
| HGIN: High-grade intraepithelial neoplasias | ||
| LGIN: Low-grade intraepithelial neoplasias | ||
| GC |  | CAG: Chronic atrophic gastritis |
| CAG with IM: Chronic atrophic gastritis with intestinal metaplasia | ||
| CSG: Chronic superficial gastritis | ||
| GC: Gastric cancer | ||
| SIM: Severe intestinal metaplasia | ||
| WIM: Wild intestinal metaplasia | ||
| Liver | 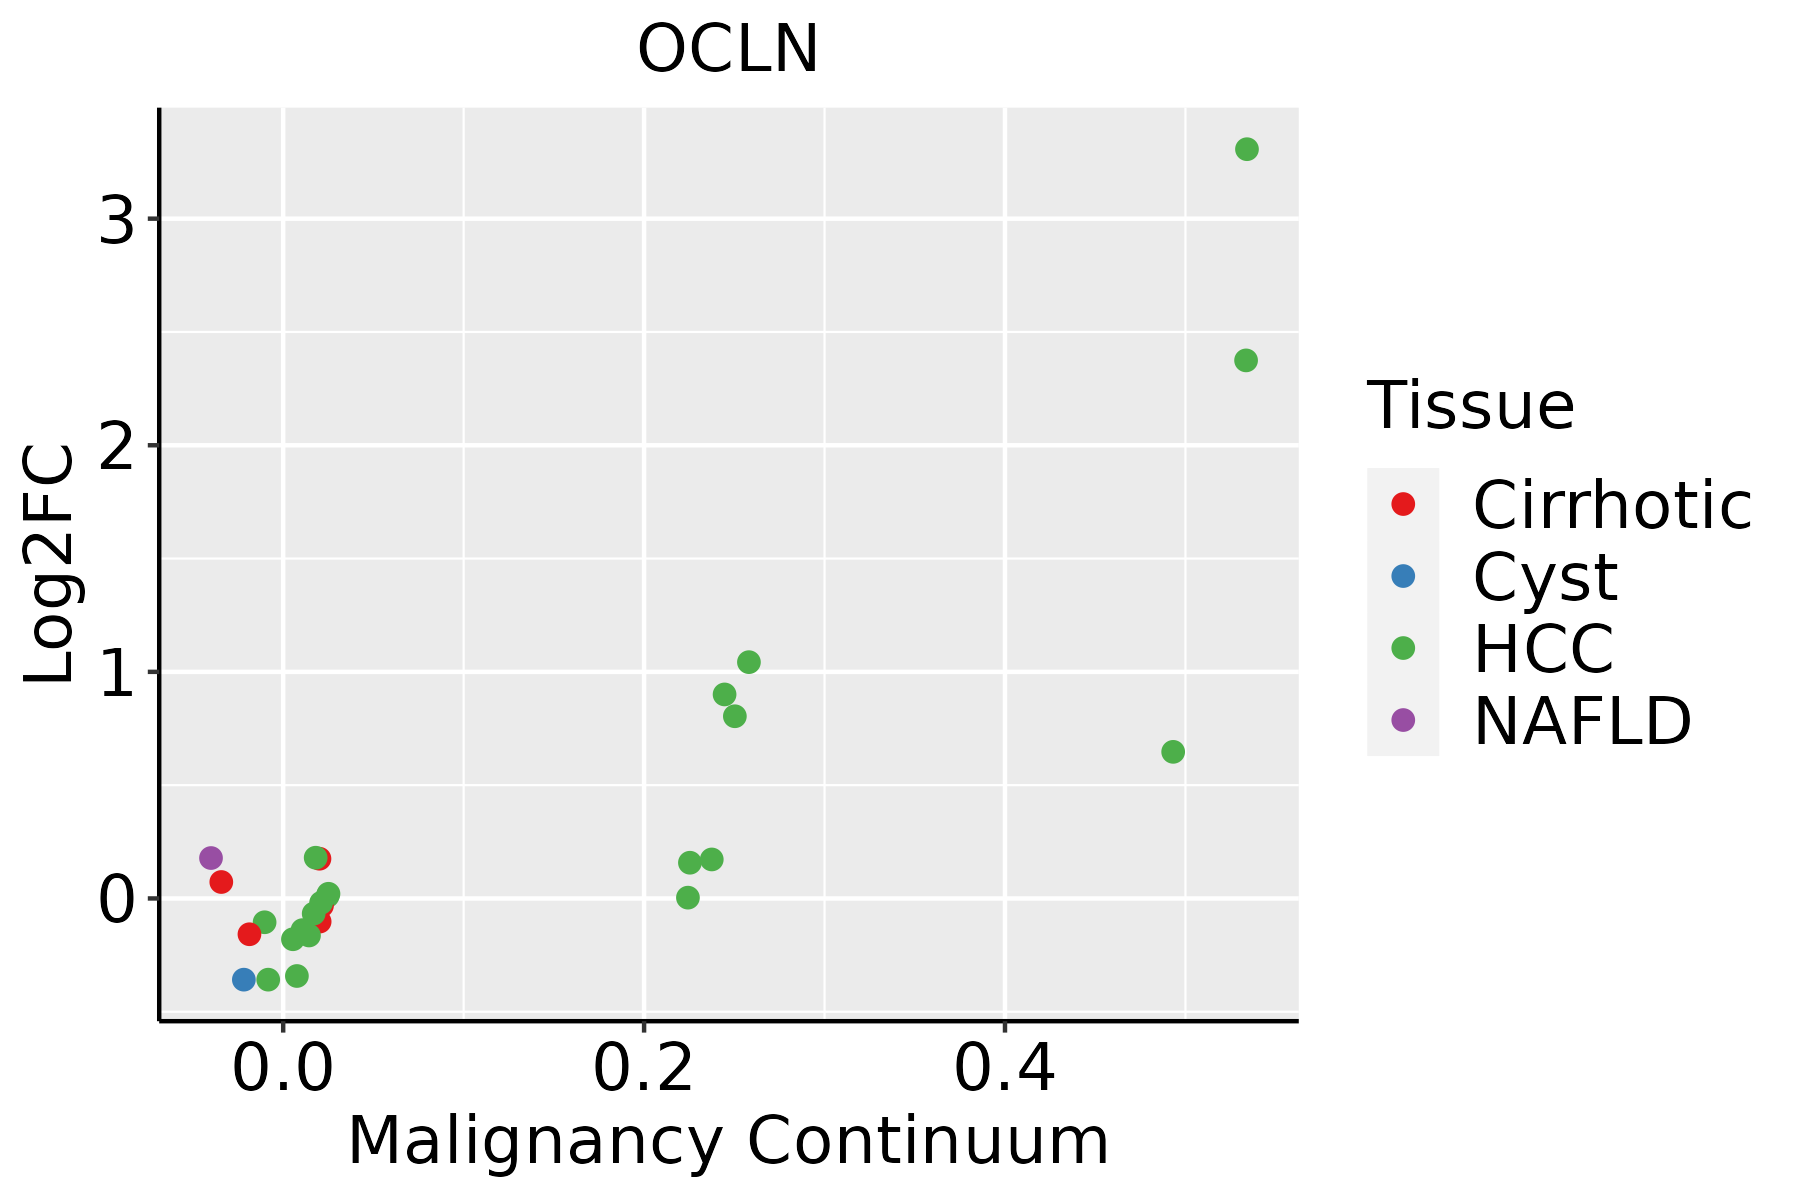 | HCC: Hepatocellular carcinoma |
| NAFLD: Non-alcoholic fatty liver disease | ||
| Lung | 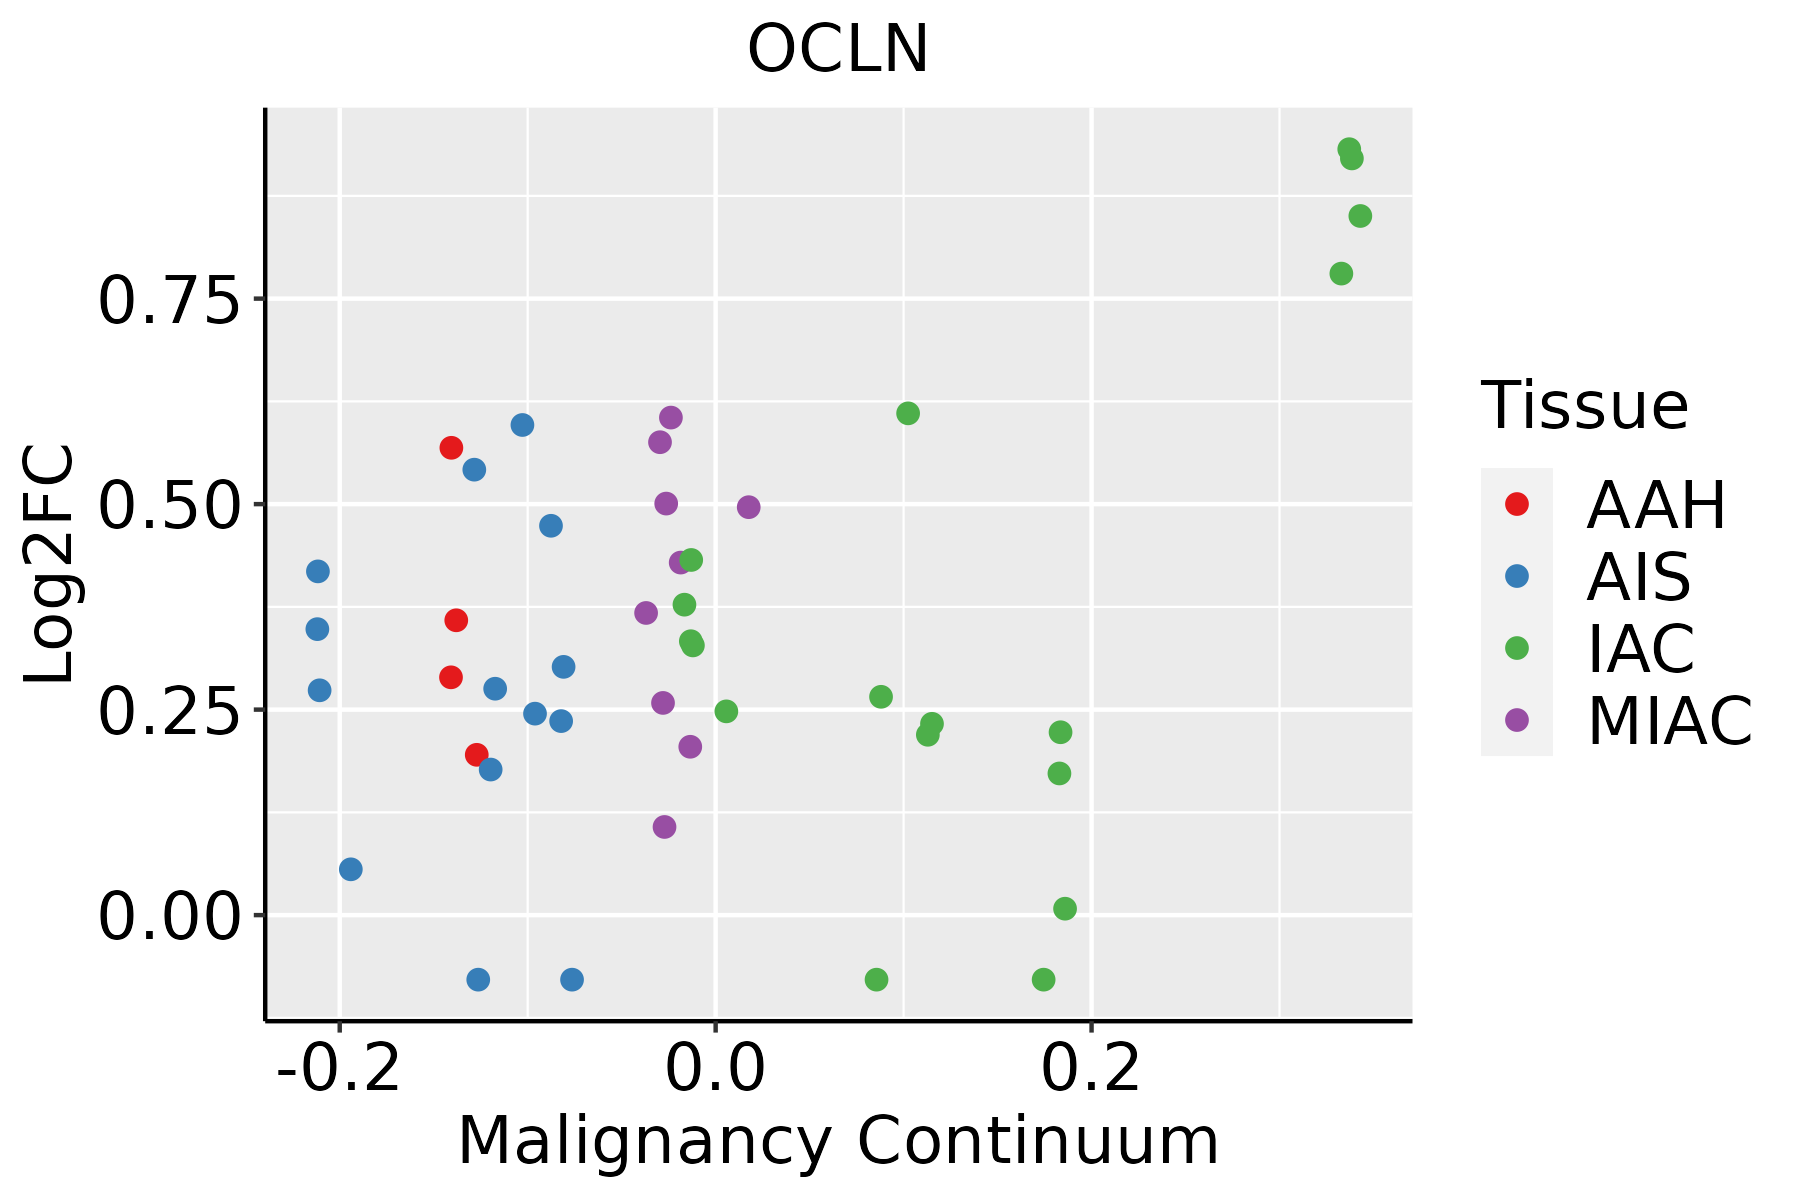 | AAH: Atypical adenomatous hyperplasia |
| AIS: Adenocarcinoma in situ | ||
| IAC: Invasive lung adenocarcinoma | ||
| MIA: Minimally invasive adenocarcinoma | ||
| Thyroid | 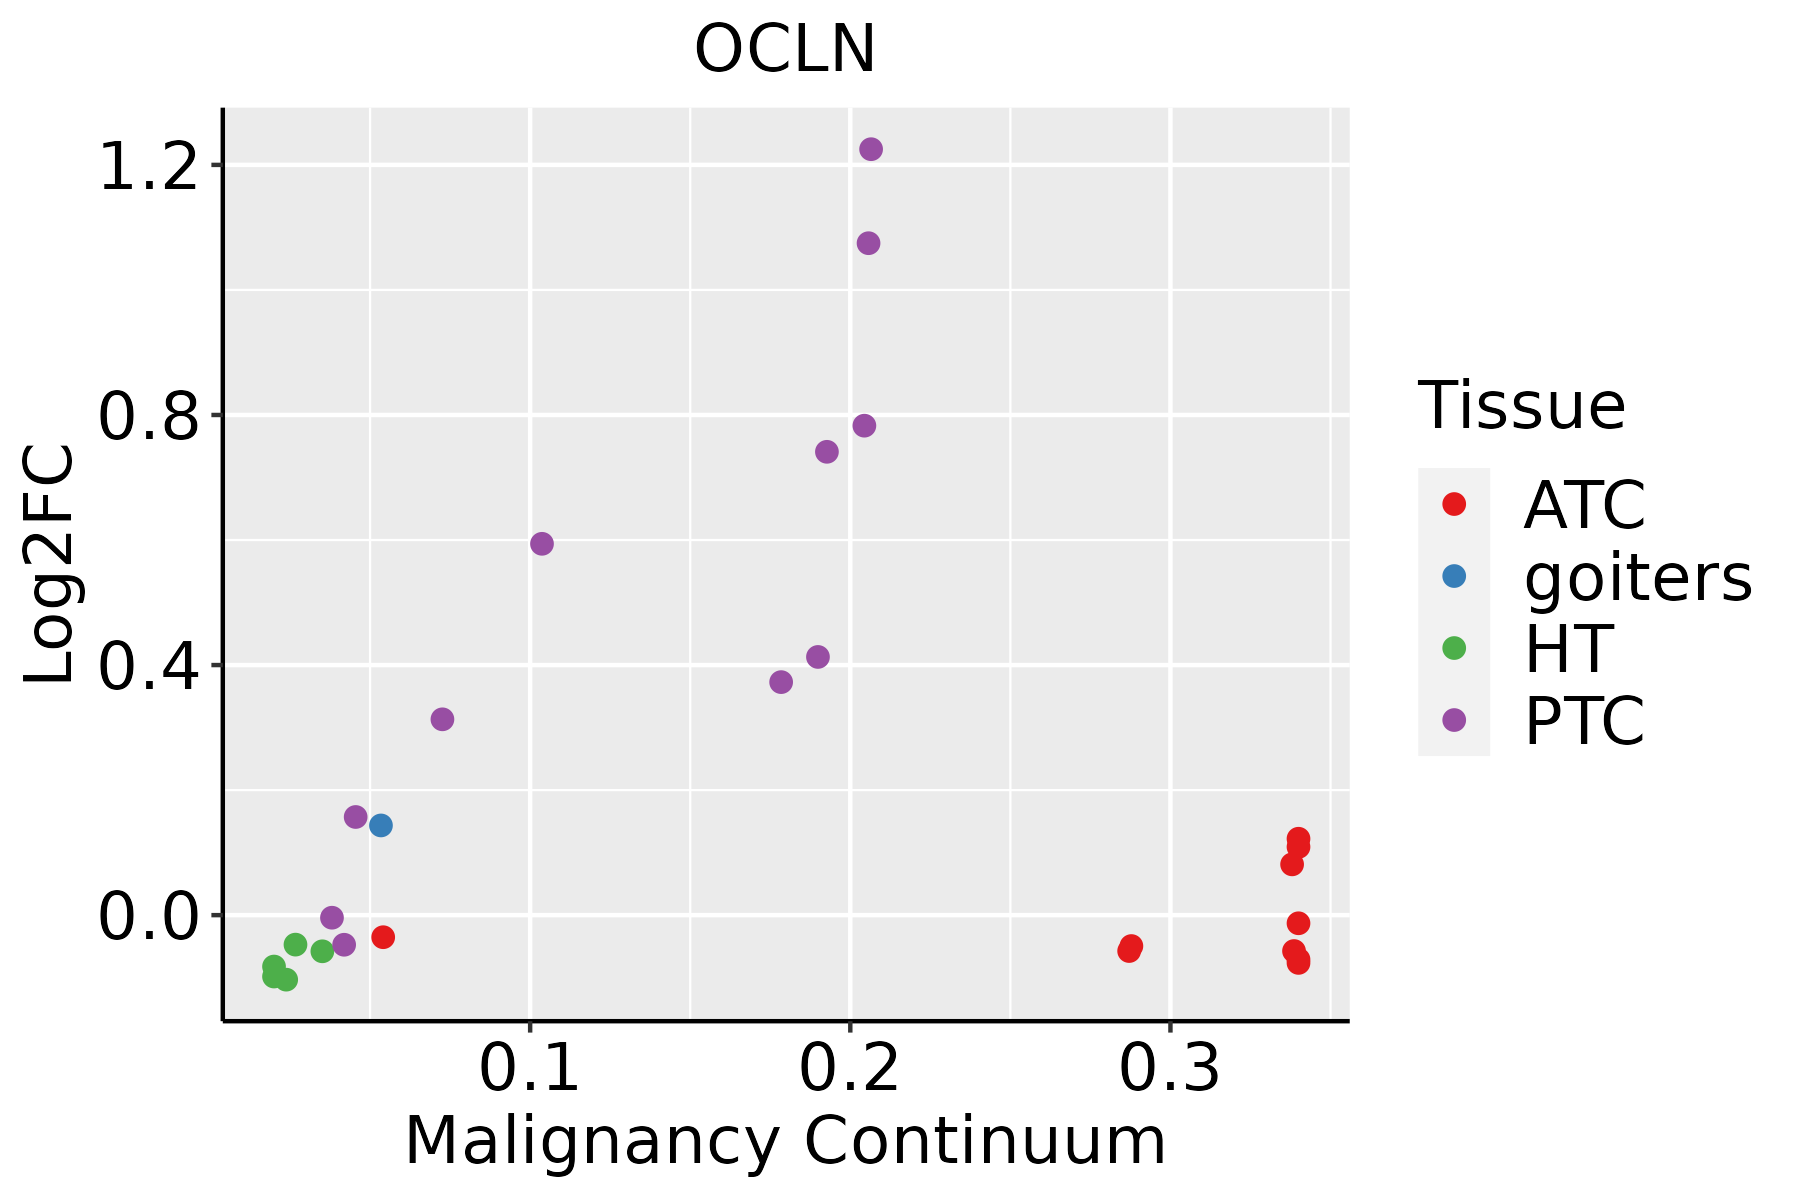 | ATC: Anaplastic thyroid cancer |
| HT: Hashimoto's thyroiditis | ||
| PTC: Papillary thyroid cancer |
| ∗log2FC in expression of this searched gene in stem-like cells from each diseased tissue sample relative to stem-like cells in normal samples in each tissue plotted against the malignancy continuum. Samples are colored based on if they are from different disease stage. |
Top |
Malignant transformation related pathway analysis |
| Find out the enriched GO biological processes and KEGG pathways involved in transition from healthy to precancer to cancer |
| Tissue | Disease Stage | Enriched GO biological Processes |
| Colorectum | AD |  |
| Colorectum | SER |  |
| Colorectum | MSS |  |
| Colorectum | MSI-H |  |
| Colorectum | FAP |  |
| ∗Top 15 enriched GO BP terms are showed in the bar plot of each disease state in each tissue. Each row represents a significant GO biological process which is colored according to the -log10(p.adjust). |
| Page: 1 2 3 4 5 6 7 8 9 |
| GO ID | Tissue | Disease Stage | Description | Gene Ratio | Bg Ratio | pvalue | p.adjust | Count |
| GO:1902903 | Colorectum | AD | regulation of supramolecular fiber organization | 139/3918 | 383/18723 | 2.01e-12 | 3.19e-10 | 139 |
| GO:0032271 | Colorectum | AD | regulation of protein polymerization | 94/3918 | 233/18723 | 1.01e-11 | 1.29e-09 | 94 |
| GO:0051258 | Colorectum | AD | protein polymerization | 112/3918 | 297/18723 | 1.85e-11 | 2.27e-09 | 112 |
| GO:0043254 | Colorectum | AD | regulation of protein-containing complex assembly | 148/3918 | 428/18723 | 2.64e-11 | 3.18e-09 | 148 |
| GO:1902905 | Colorectum | AD | positive regulation of supramolecular fiber organization | 85/3918 | 209/18723 | 5.95e-11 | 6.33e-09 | 85 |
| GO:0051495 | Colorectum | AD | positive regulation of cytoskeleton organization | 89/3918 | 226/18723 | 1.61e-10 | 1.56e-08 | 89 |
| GO:0032273 | Colorectum | AD | positive regulation of protein polymerization | 62/3918 | 138/18723 | 1.94e-10 | 1.76e-08 | 62 |
| GO:0031334 | Colorectum | AD | positive regulation of protein-containing complex assembly | 91/3918 | 237/18723 | 4.78e-10 | 3.99e-08 | 91 |
| GO:0045216 | Colorectum | AD | cell-cell junction organization | 80/3918 | 200/18723 | 5.57e-10 | 4.58e-08 | 80 |
| GO:0034329 | Colorectum | AD | cell junction assembly | 136/3918 | 420/18723 | 2.02e-08 | 1.15e-06 | 136 |
| GO:0007043 | Colorectum | AD | cell-cell junction assembly | 57/3918 | 146/18723 | 4.18e-07 | 1.61e-05 | 57 |
| GO:0042060 | Colorectum | AD | wound healing | 128/3918 | 422/18723 | 2.73e-06 | 7.89e-05 | 128 |
| GO:0043297 | Colorectum | AD | apical junction assembly | 34/3918 | 78/18723 | 5.31e-06 | 1.37e-04 | 34 |
| GO:0010563 | Colorectum | AD | negative regulation of phosphorus metabolic process | 130/3918 | 442/18723 | 1.26e-05 | 2.76e-04 | 130 |
| GO:0045936 | Colorectum | AD | negative regulation of phosphate metabolic process | 129/3918 | 441/18723 | 1.81e-05 | 3.76e-04 | 129 |
| GO:1902743 | Colorectum | AD | regulation of lamellipodium organization | 25/3918 | 54/18723 | 2.63e-05 | 5.01e-04 | 25 |
| GO:0120193 | Colorectum | AD | tight junction organization | 33/3918 | 80/18723 | 2.93e-05 | 5.42e-04 | 33 |
| GO:0120192 | Colorectum | AD | tight junction assembly | 31/3918 | 74/18723 | 3.53e-05 | 6.43e-04 | 31 |
| GO:1902745 | Colorectum | AD | positive regulation of lamellipodium organization | 19/3918 | 37/18723 | 4.08e-05 | 7.26e-04 | 19 |
| GO:0097581 | Colorectum | AD | lamellipodium organization | 35/3918 | 90/18723 | 7.39e-05 | 1.18e-03 | 35 |
| Page: 1 2 3 4 5 6 7 8 9 10 11 12 13 14 15 16 17 18 19 20 21 22 23 24 25 26 27 28 |
| Pathway ID | Tissue | Disease Stage | Description | Gene Ratio | Bg Ratio | pvalue | p.adjust | qvalue | Count |
| hsa04530 | Colorectum | AD | Tight junction | 76/2092 | 169/8465 | 5.49e-09 | 9.69e-08 | 6.18e-08 | 76 |
| hsa05130 | Colorectum | AD | Pathogenic Escherichia coli infection | 79/2092 | 197/8465 | 1.05e-06 | 1.36e-05 | 8.65e-06 | 79 |
| hsa05160 | Colorectum | AD | Hepatitis C | 54/2092 | 157/8465 | 3.87e-03 | 1.96e-02 | 1.25e-02 | 54 |
| hsa04670 | Colorectum | AD | Leukocyte transendothelial migration | 41/2092 | 114/8465 | 4.60e-03 | 2.20e-02 | 1.40e-02 | 41 |
| hsa045301 | Colorectum | AD | Tight junction | 76/2092 | 169/8465 | 5.49e-09 | 9.69e-08 | 6.18e-08 | 76 |
| hsa051301 | Colorectum | AD | Pathogenic Escherichia coli infection | 79/2092 | 197/8465 | 1.05e-06 | 1.36e-05 | 8.65e-06 | 79 |
| hsa051601 | Colorectum | AD | Hepatitis C | 54/2092 | 157/8465 | 3.87e-03 | 1.96e-02 | 1.25e-02 | 54 |
| hsa046701 | Colorectum | AD | Leukocyte transendothelial migration | 41/2092 | 114/8465 | 4.60e-03 | 2.20e-02 | 1.40e-02 | 41 |
| hsa045302 | Colorectum | SER | Tight junction | 59/1580 | 169/8465 | 3.24e-07 | 5.98e-06 | 4.34e-06 | 59 |
| hsa051302 | Colorectum | SER | Pathogenic Escherichia coli infection | 60/1580 | 197/8465 | 3.63e-05 | 4.31e-04 | 3.13e-04 | 60 |
| hsa046702 | Colorectum | SER | Leukocyte transendothelial migration | 37/1580 | 114/8465 | 2.77e-04 | 2.56e-03 | 1.86e-03 | 37 |
| hsa045303 | Colorectum | SER | Tight junction | 59/1580 | 169/8465 | 3.24e-07 | 5.98e-06 | 4.34e-06 | 59 |
| hsa051303 | Colorectum | SER | Pathogenic Escherichia coli infection | 60/1580 | 197/8465 | 3.63e-05 | 4.31e-04 | 3.13e-04 | 60 |
| hsa046703 | Colorectum | SER | Leukocyte transendothelial migration | 37/1580 | 114/8465 | 2.77e-04 | 2.56e-03 | 1.86e-03 | 37 |
| hsa045304 | Colorectum | MSS | Tight junction | 66/1875 | 169/8465 | 4.10e-07 | 6.25e-06 | 3.83e-06 | 66 |
| hsa051304 | Colorectum | MSS | Pathogenic Escherichia coli infection | 73/1875 | 197/8465 | 1.10e-06 | 1.48e-05 | 9.06e-06 | 73 |
| hsa051602 | Colorectum | MSS | Hepatitis C | 52/1875 | 157/8465 | 9.29e-04 | 5.58e-03 | 3.42e-03 | 52 |
| hsa046704 | Colorectum | MSS | Leukocyte transendothelial migration | 36/1875 | 114/8465 | 1.21e-02 | 4.02e-02 | 2.46e-02 | 36 |
| hsa045305 | Colorectum | MSS | Tight junction | 66/1875 | 169/8465 | 4.10e-07 | 6.25e-06 | 3.83e-06 | 66 |
| hsa051305 | Colorectum | MSS | Pathogenic Escherichia coli infection | 73/1875 | 197/8465 | 1.10e-06 | 1.48e-05 | 9.06e-06 | 73 |
| Page: 1 2 3 4 5 6 |
Top |
Cell-cell communication analysis |
| Identification of potential cell-cell interactions between two cell types and their ligand-receptor pairs for different disease states |
| Ligand | Receptor | LRpair | Pathway | Tissue | Disease Stage |
| OCLN | OCLN | OCLN_OCLN | OCLN | CRC | AD |
| OCLN | OCLN | OCLN_OCLN | OCLN | CRC | ADJ |
| OCLN | OCLN | OCLN_OCLN | OCLN | CRC | CRC |
| OCLN | OCLN | OCLN_OCLN | OCLN | CRC | FAP |
| OCLN | OCLN | OCLN_OCLN | OCLN | CRC | Healthy |
| OCLN | OCLN | OCLN_OCLN | OCLN | CRC | MSI-H |
| OCLN | OCLN | OCLN_OCLN | OCLN | Endometrium | AEH |
| OCLN | OCLN | OCLN_OCLN | OCLN | Endometrium | EEC |
| OCLN | OCLN | OCLN_OCLN | OCLN | GC | ADJ |
| OCLN | OCLN | OCLN_OCLN | OCLN | HNSCC | ADJ |
| OCLN | OCLN | OCLN_OCLN | OCLN | HNSCC | OSCC |
| OCLN | OCLN | OCLN_OCLN | OCLN | HNSCC | Precancer |
| OCLN | OCLN | OCLN_OCLN | OCLN | Liver | HCC |
| OCLN | OCLN | OCLN_OCLN | OCLN | Liver | Healthy |
| OCLN | OCLN | OCLN_OCLN | OCLN | Liver | Precancer |
| OCLN | OCLN | OCLN_OCLN | OCLN | Lung | AAH |
| OCLN | OCLN | OCLN_OCLN | OCLN | Lung | IAC |
| OCLN | OCLN | OCLN_OCLN | OCLN | Lung | MIAC |
| OCLN | OCLN | OCLN_OCLN | OCLN | Prostate | BPH |
| OCLN | OCLN | OCLN_OCLN | OCLN | Prostate | Healthy |
| Page: 1 2 |
Top |
Single-cell gene regulatory network inference analysis |
| Find out the significant the regulons (TFs) and the target genes of each regulon across cell types for different disease states |
| TF | Cell Type | Tissue | Disease Stage | Target Gene | RSS | Regulon Activity |
| ∗The dot plots of a searched regulon are shown for all cell subpopulations in each disease state of each tissue based on the regulon specific score inferred using pySCENIC and by calculating the average expression. |
| Page: 1 |
Top |
Somatic mutation of malignant transformation related genes |
| Annotation of somatic variants for genes involved in malignant transformation |
| Hugo Symbol | Variant Class | Variant Classification | dbSNP RS | HGVSc | HGVSp | HGVSp Short | SWISSPROT | BIOTYPE | SIFT | PolyPhen | Tumor Sample Barcode | Tissue | Histology | Sex | Age | Stage | Therapy Types | Drugs | Outcome |
| OCLN | SNV | Missense_Mutation | rs753783440 | c.1243N>A | p.Asp415Asn | p.D415N | Q16625 | protein_coding | tolerated(0.12) | benign(0.376) | TCGA-BH-A0HF-01 | Breast | breast invasive carcinoma | Female | >=65 | I/II | Hormone Therapy | arimidex | SD |
| OCLN | SNV | Missense_Mutation | c.8N>G | p.Ser3Cys | p.S3C | Q16625 | protein_coding | deleterious(0.01) | possibly_damaging(0.499) | TCGA-D8-A27G-01 | Breast | breast invasive carcinoma | Female | >=65 | I/II | Unknown | Unknown | SD | |
| OCLN | SNV | Missense_Mutation | c.874N>A | p.Pro292Thr | p.P292T | Q16625 | protein_coding | deleterious(0.01) | possibly_damaging(0.625) | TCGA-E2-A14Z-01 | Breast | breast invasive carcinoma | Female | <65 | I/II | Hormone Therapy | arimidex | PD | |
| OCLN | insertion | Frame_Shift_Ins | novel | c.581_582insGTGC | p.Ile194MetfsTer83 | p.I194Mfs*83 | Q16625 | protein_coding | TCGA-A8-A06X-01 | Breast | breast invasive carcinoma | Female | >=65 | I/II | Unknown | Unknown | SD | ||
| OCLN | insertion | In_Frame_Ins | novel | c.582_583insCTTTCTTATACATTCTCATTTAAT | p.Ile194_Met195insLeuSerTyrThrPheSerPheAsn | p.I194_M195insLSYTFSFN | Q16625 | protein_coding | TCGA-A8-A06X-01 | Breast | breast invasive carcinoma | Female | >=65 | I/II | Unknown | Unknown | SD | ||
| OCLN | SNV | Missense_Mutation | c.1239N>T | p.Glu413Asp | p.E413D | Q16625 | protein_coding | tolerated(0.96) | benign(0.007) | TCGA-FU-A3HZ-01 | Cervix | cervical & endocervical cancer | Female | <65 | I/II | Chemotherapy | cisplatin | CR | |
| OCLN | SNV | Missense_Mutation | novel | c.125N>T | p.Pro42Leu | p.P42L | Q16625 | protein_coding | deleterious(0.04) | possibly_damaging(0.71) | TCGA-AA-3855-01 | Colorectum | colon adenocarcinoma | Male | >=65 | I/II | Unknown | Unknown | SD |
| OCLN | SNV | Missense_Mutation | novel | c.250G>A | p.Ala84Thr | p.A84T | Q16625 | protein_coding | deleterious(0.01) | benign(0.358) | TCGA-AA-3864-01 | Colorectum | colon adenocarcinoma | Male | >=65 | I/II | Unknown | Unknown | SD |
| OCLN | SNV | Missense_Mutation | novel | c.172T>A | p.Trp58Arg | p.W58R | Q16625 | protein_coding | deleterious(0) | probably_damaging(1) | TCGA-AA-3930-01 | Colorectum | colon adenocarcinoma | Male | >=65 | III/IV | Chemotherapy | capecitabine | PD |
| OCLN | SNV | Missense_Mutation | c.880N>A | p.Val294Ile | p.V294I | Q16625 | protein_coding | tolerated(0.05) | possibly_damaging(0.695) | TCGA-DY-A0XA-01 | Colorectum | rectum adenocarcinoma | Female | <65 | I/II | Chemotherapy | mayo | CR |
| Page: 1 2 3 4 5 6 |
Top |
Related drugs of malignant transformation related genes |
| Identification of chemicals and drugs interact with genes involved in malignant transfromation |
| (DGIdb 4.0) |
| Entrez ID | Symbol | Category | Interaction Types | Drug Claim Name | Drug Name | PMIDs |
| 100506658 | OCLN | DRUGGABLE GENOME, TRANSPORTER | RETINOIC ACID | 15500294 |
| Page: 1 |

Copyright 2023-Present -The University of Texas Health Science Center at Houston |