| Tissue | Expression Dynamics | Abbreviation |
| Colorectum (GSE201348) |  | FAP: Familial adenomatous polyposis |
| CRC: Colorectal cancer |
| Colorectum (HTA11) | 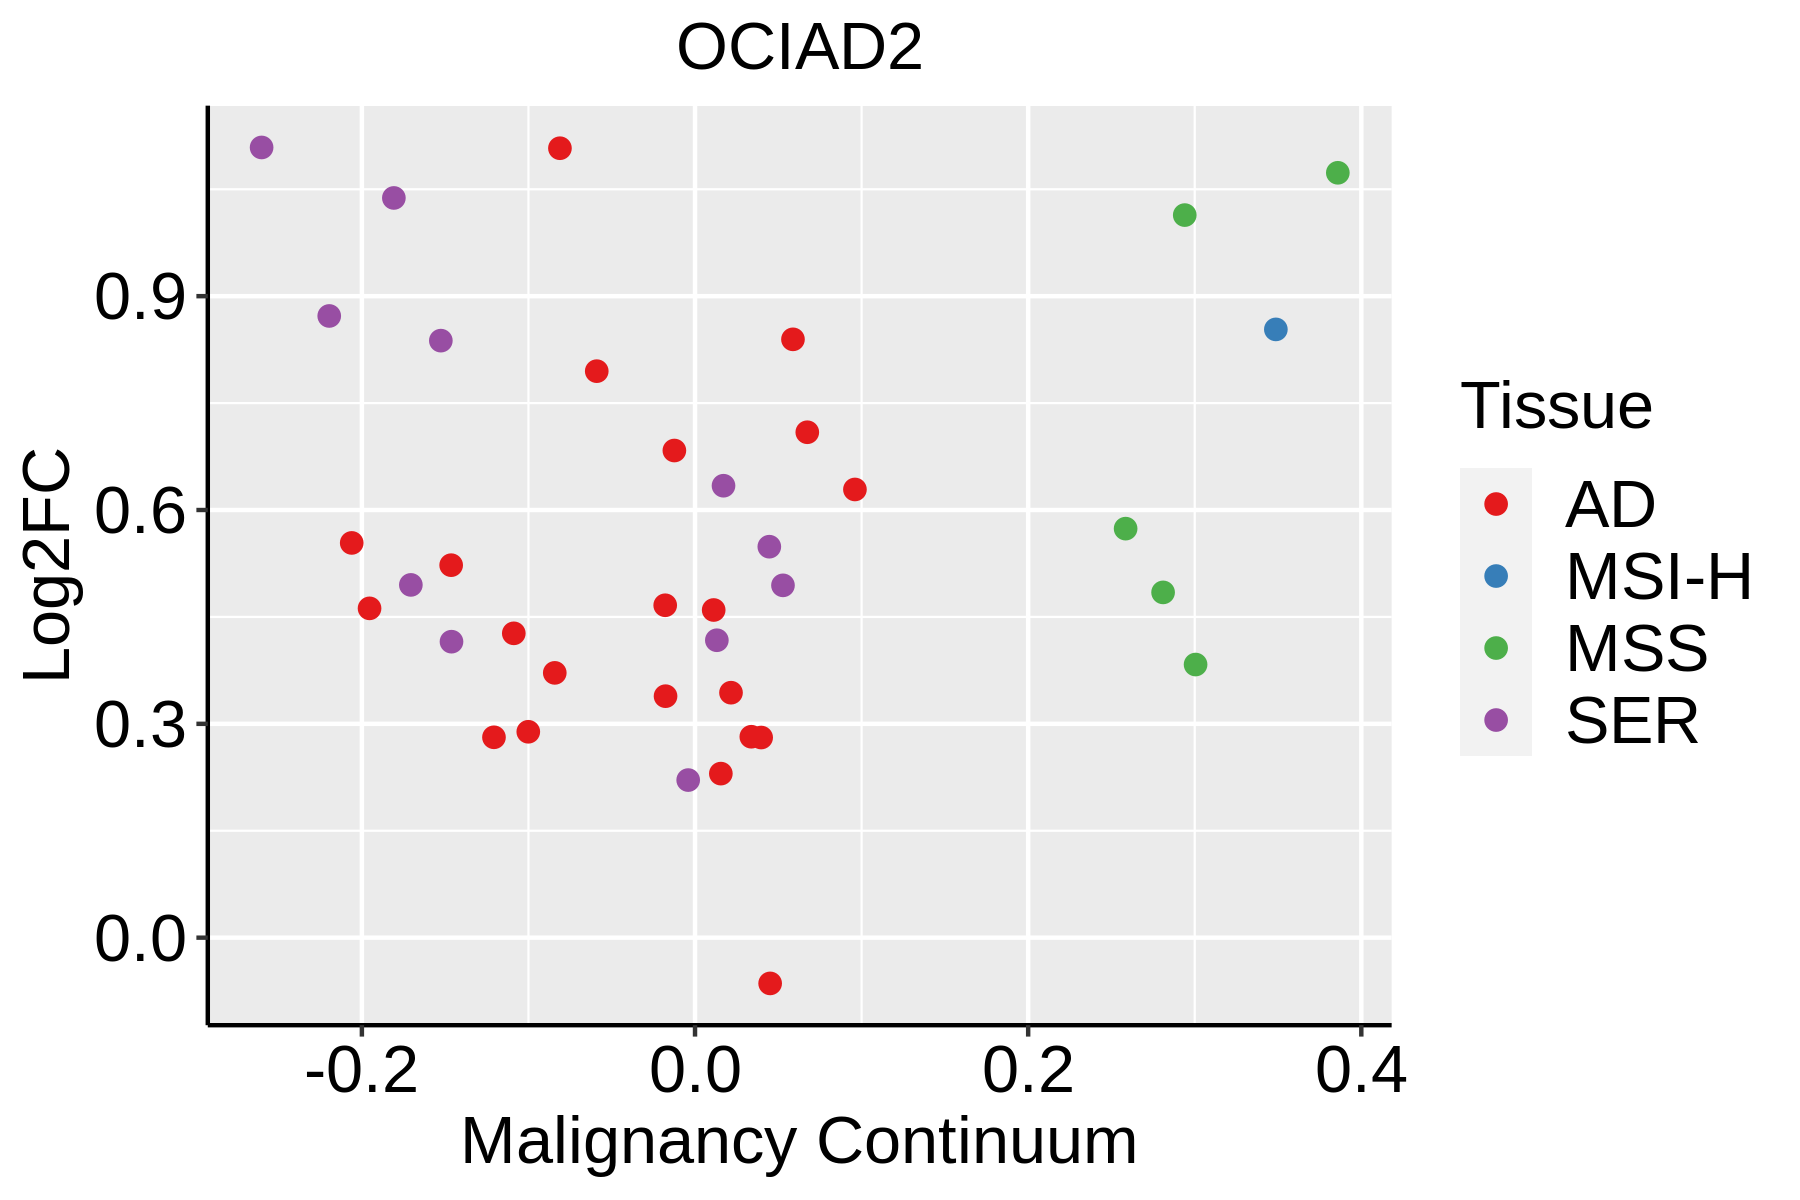 | AD: Adenomas |
| SER: Sessile serrated lesions |
| MSI-H: Microsatellite-high colorectal cancer |
| MSS: Microsatellite stable colorectal cancer |
| Endometrium | 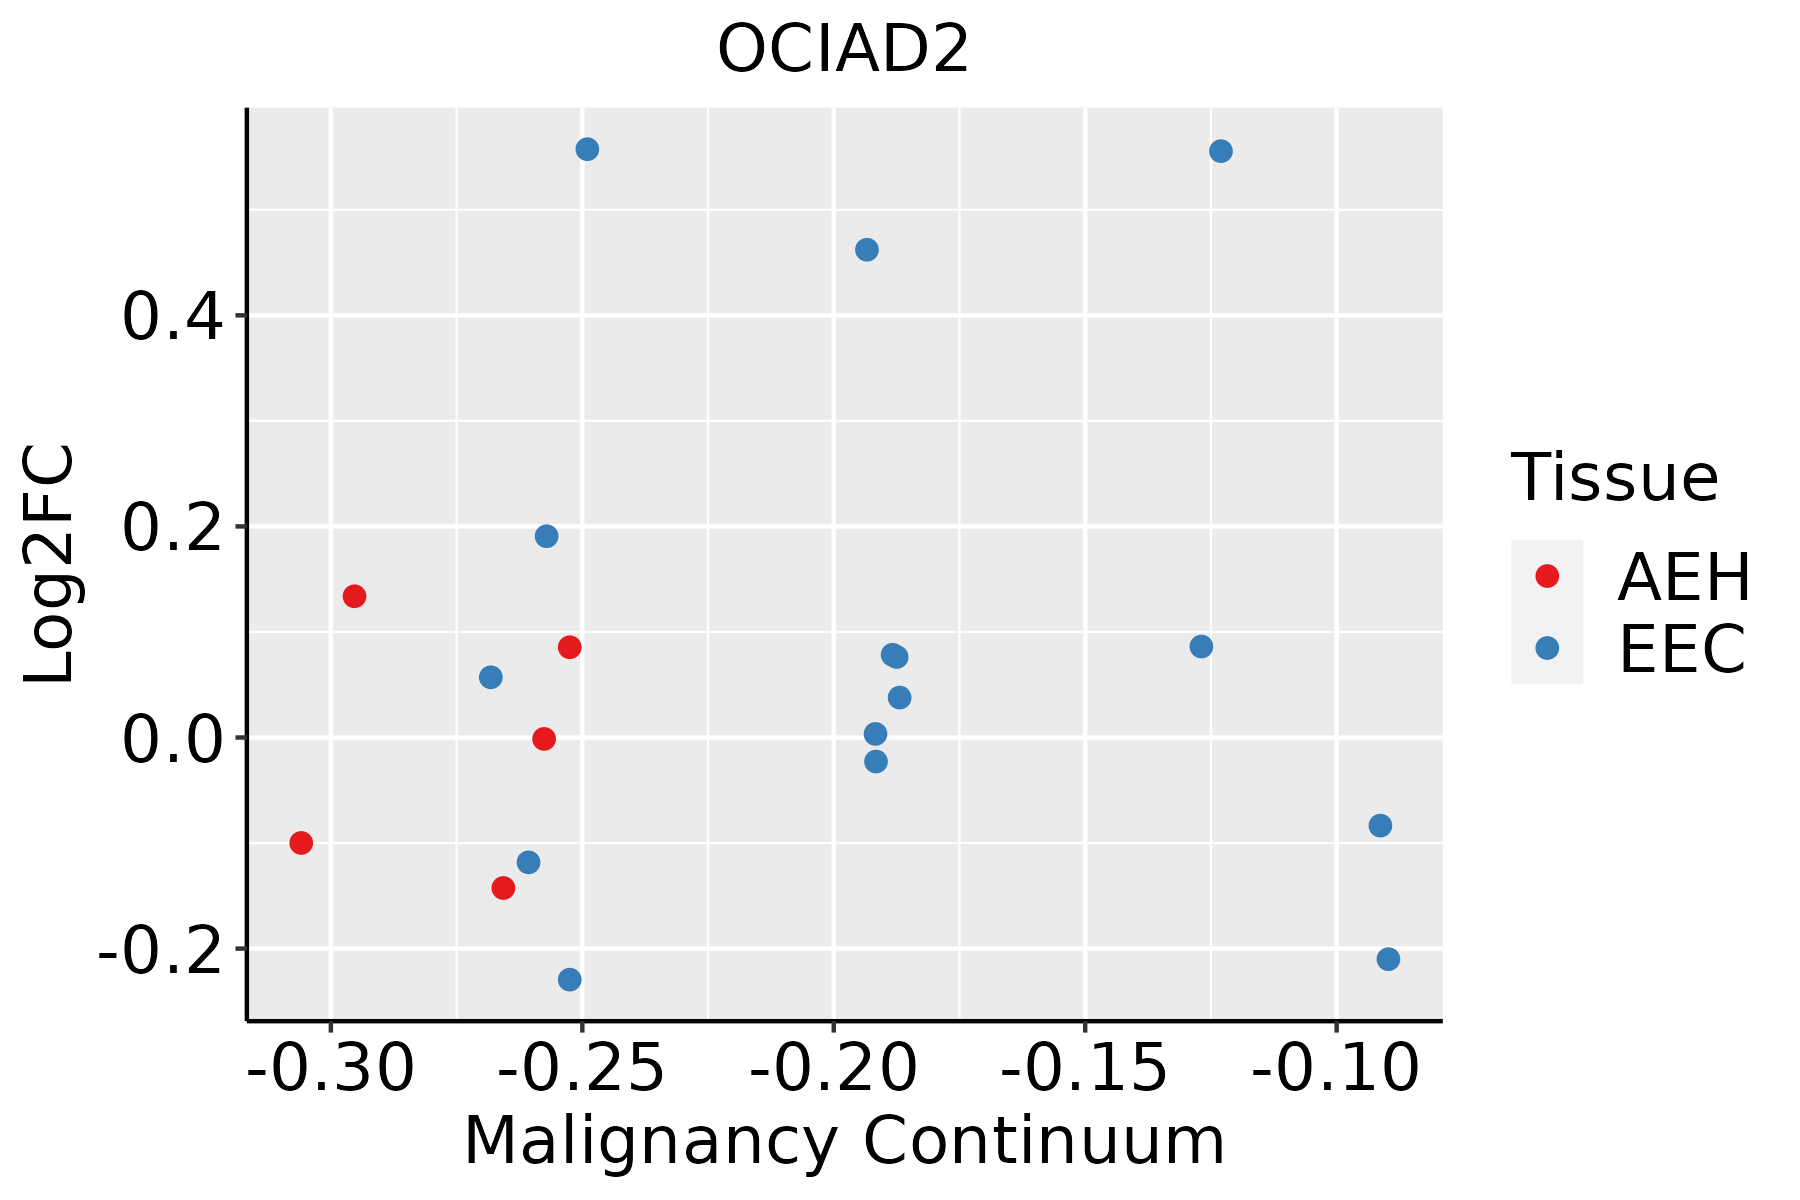 | AEH: Atypical endometrial hyperplasia |
| EEC: Endometrioid Cancer |
| Esophagus | 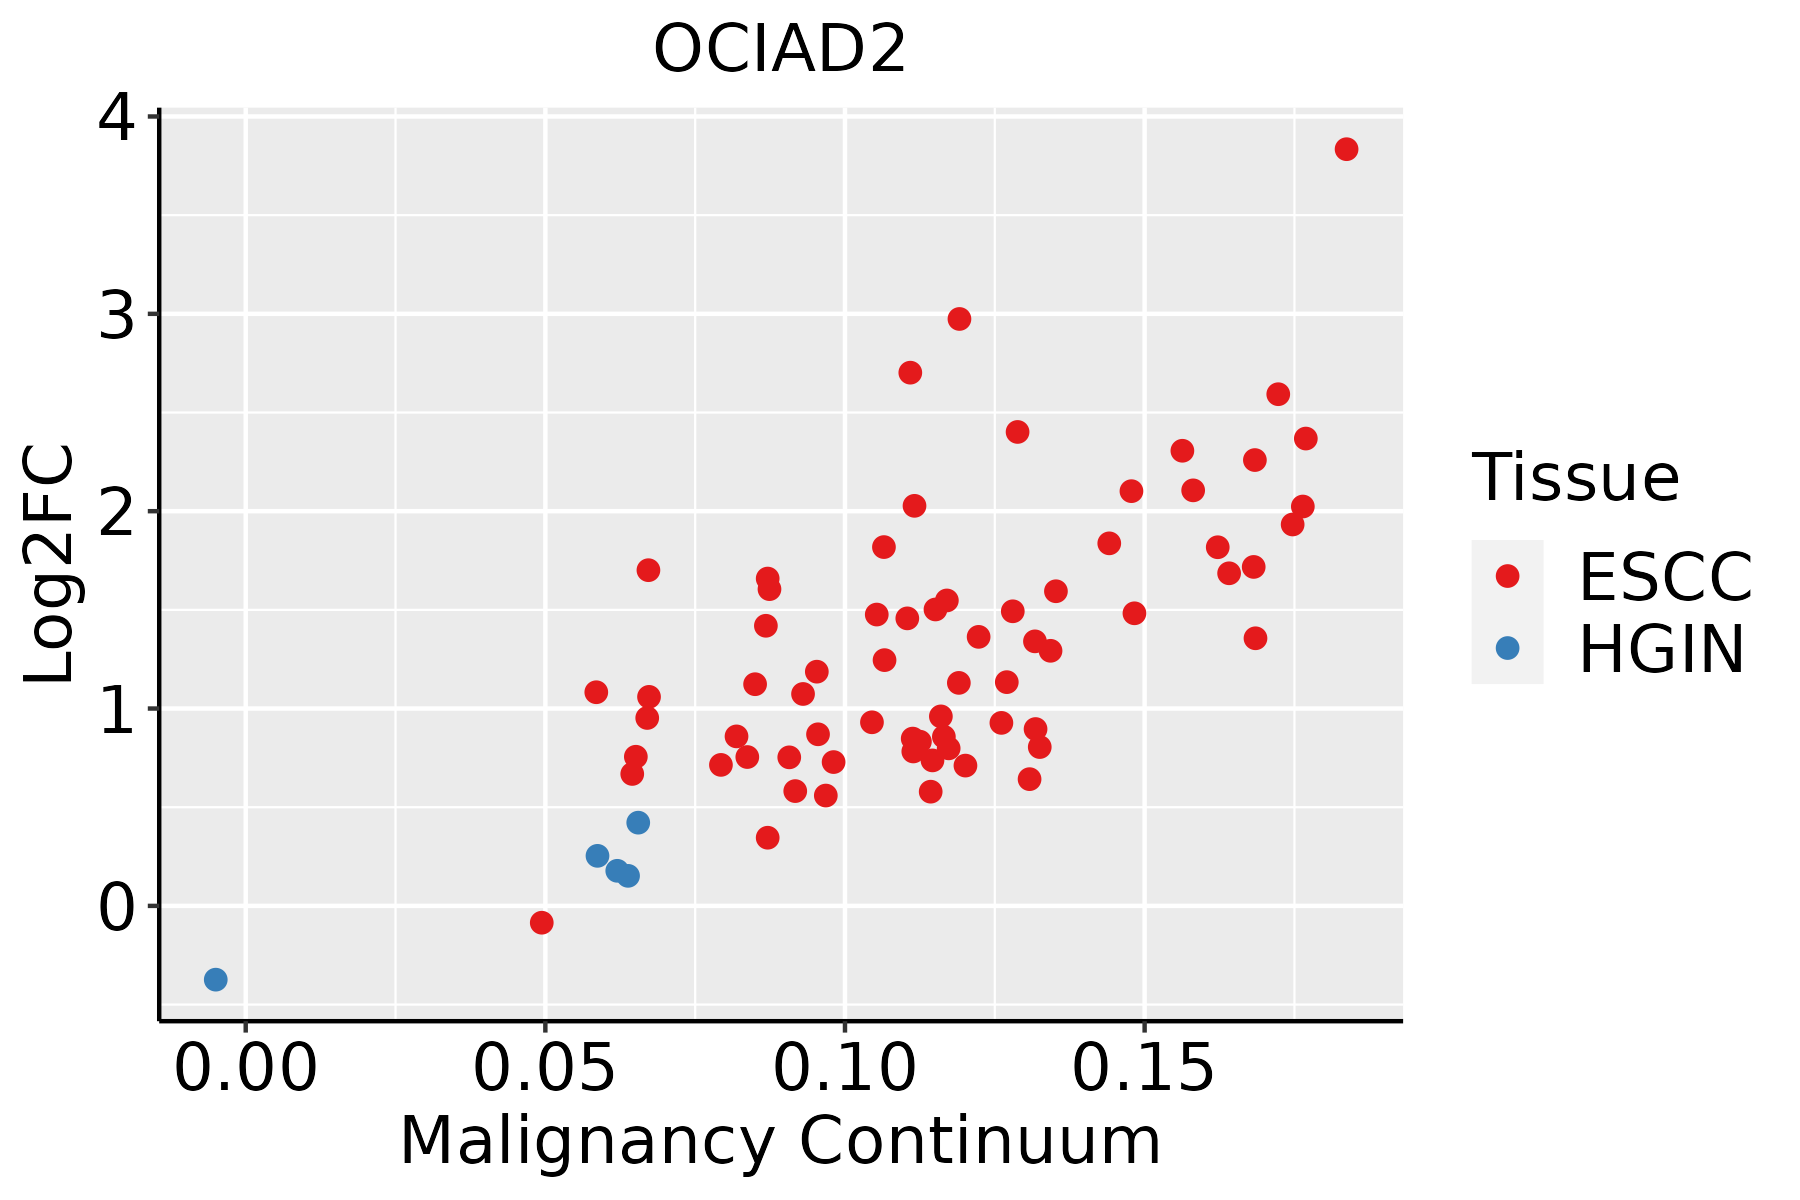 | ESCC: Esophageal squamous cell carcinoma |
| HGIN: High-grade intraepithelial neoplasias |
| LGIN: Low-grade intraepithelial neoplasias |
| GC | 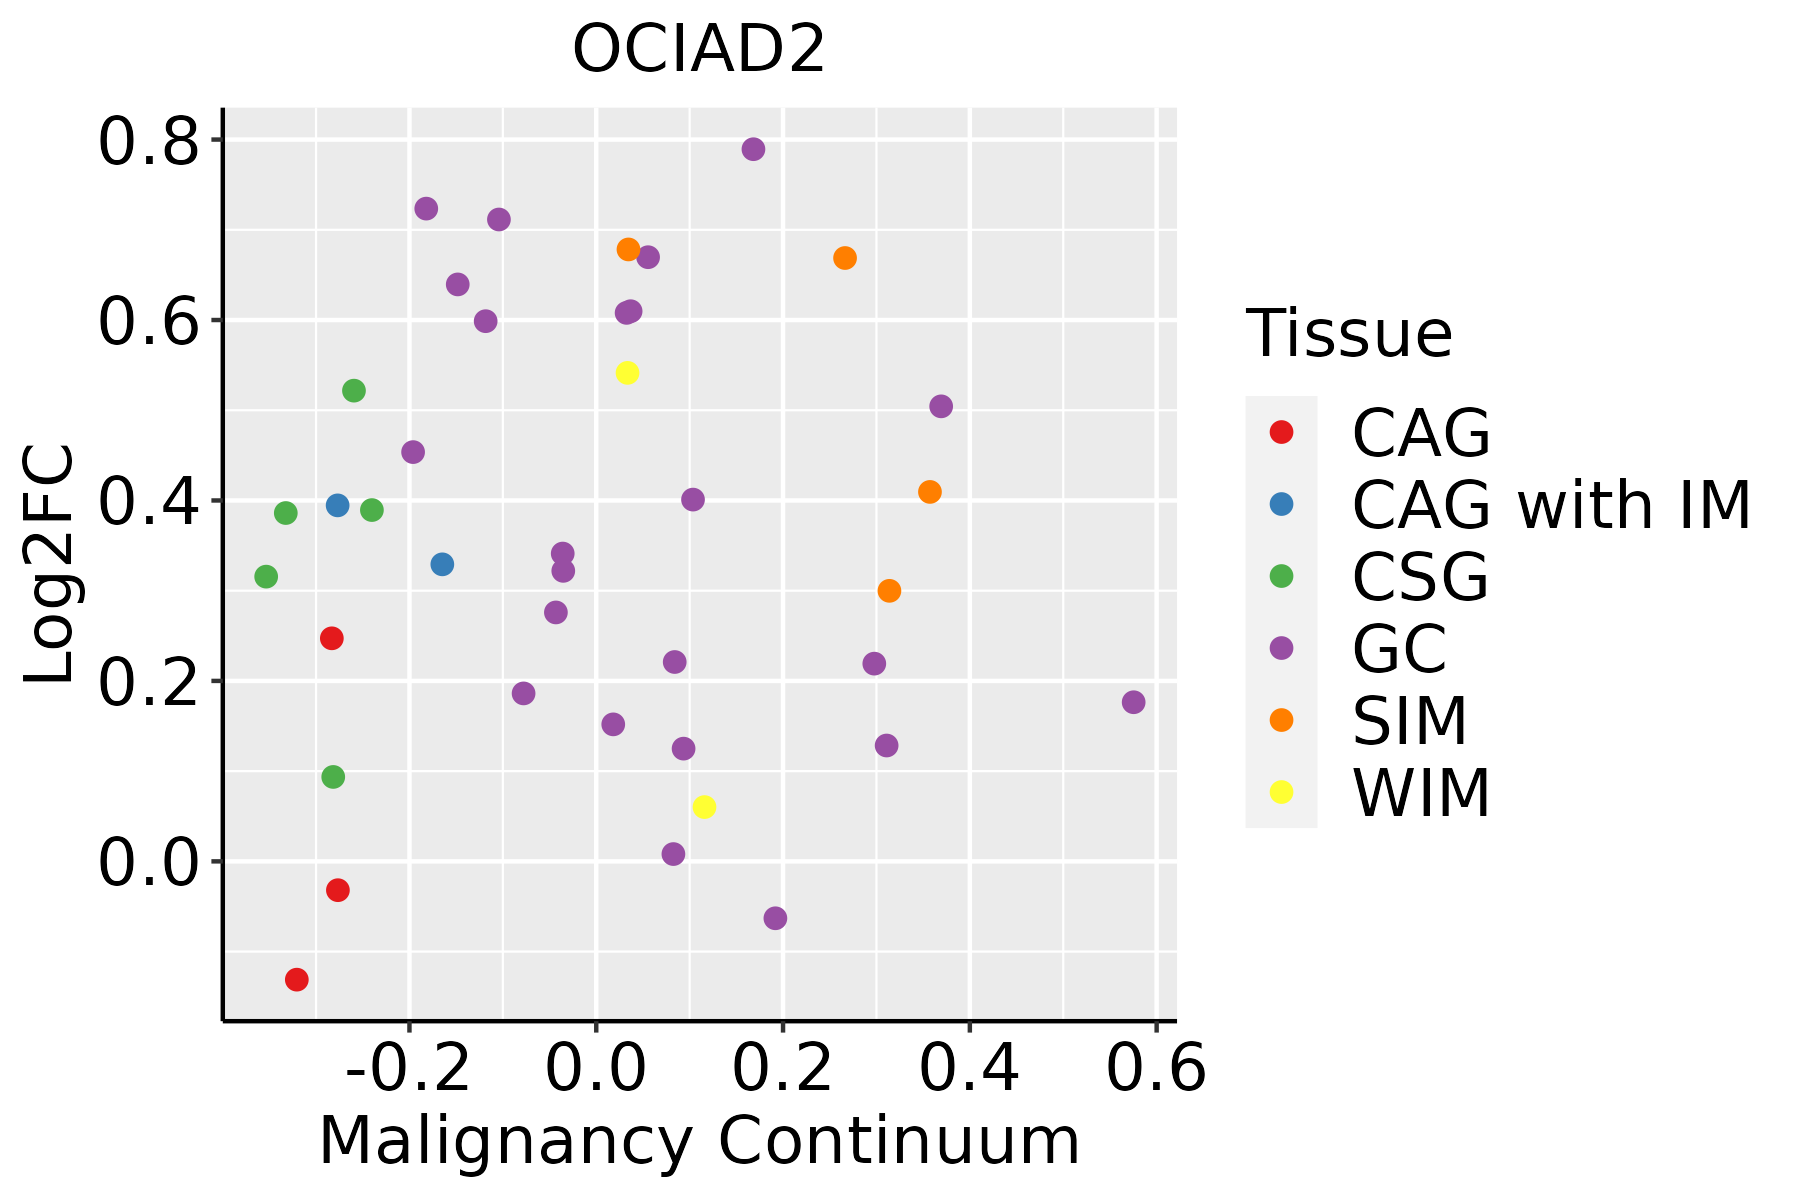 | CAG: Chronic atrophic gastritis |
| CAG with IM: Chronic atrophic gastritis with intestinal metaplasia |
| CSG: Chronic superficial gastritis |
| GC: Gastric cancer |
| SIM: Severe intestinal metaplasia |
| WIM: Wild intestinal metaplasia |
| Liver | 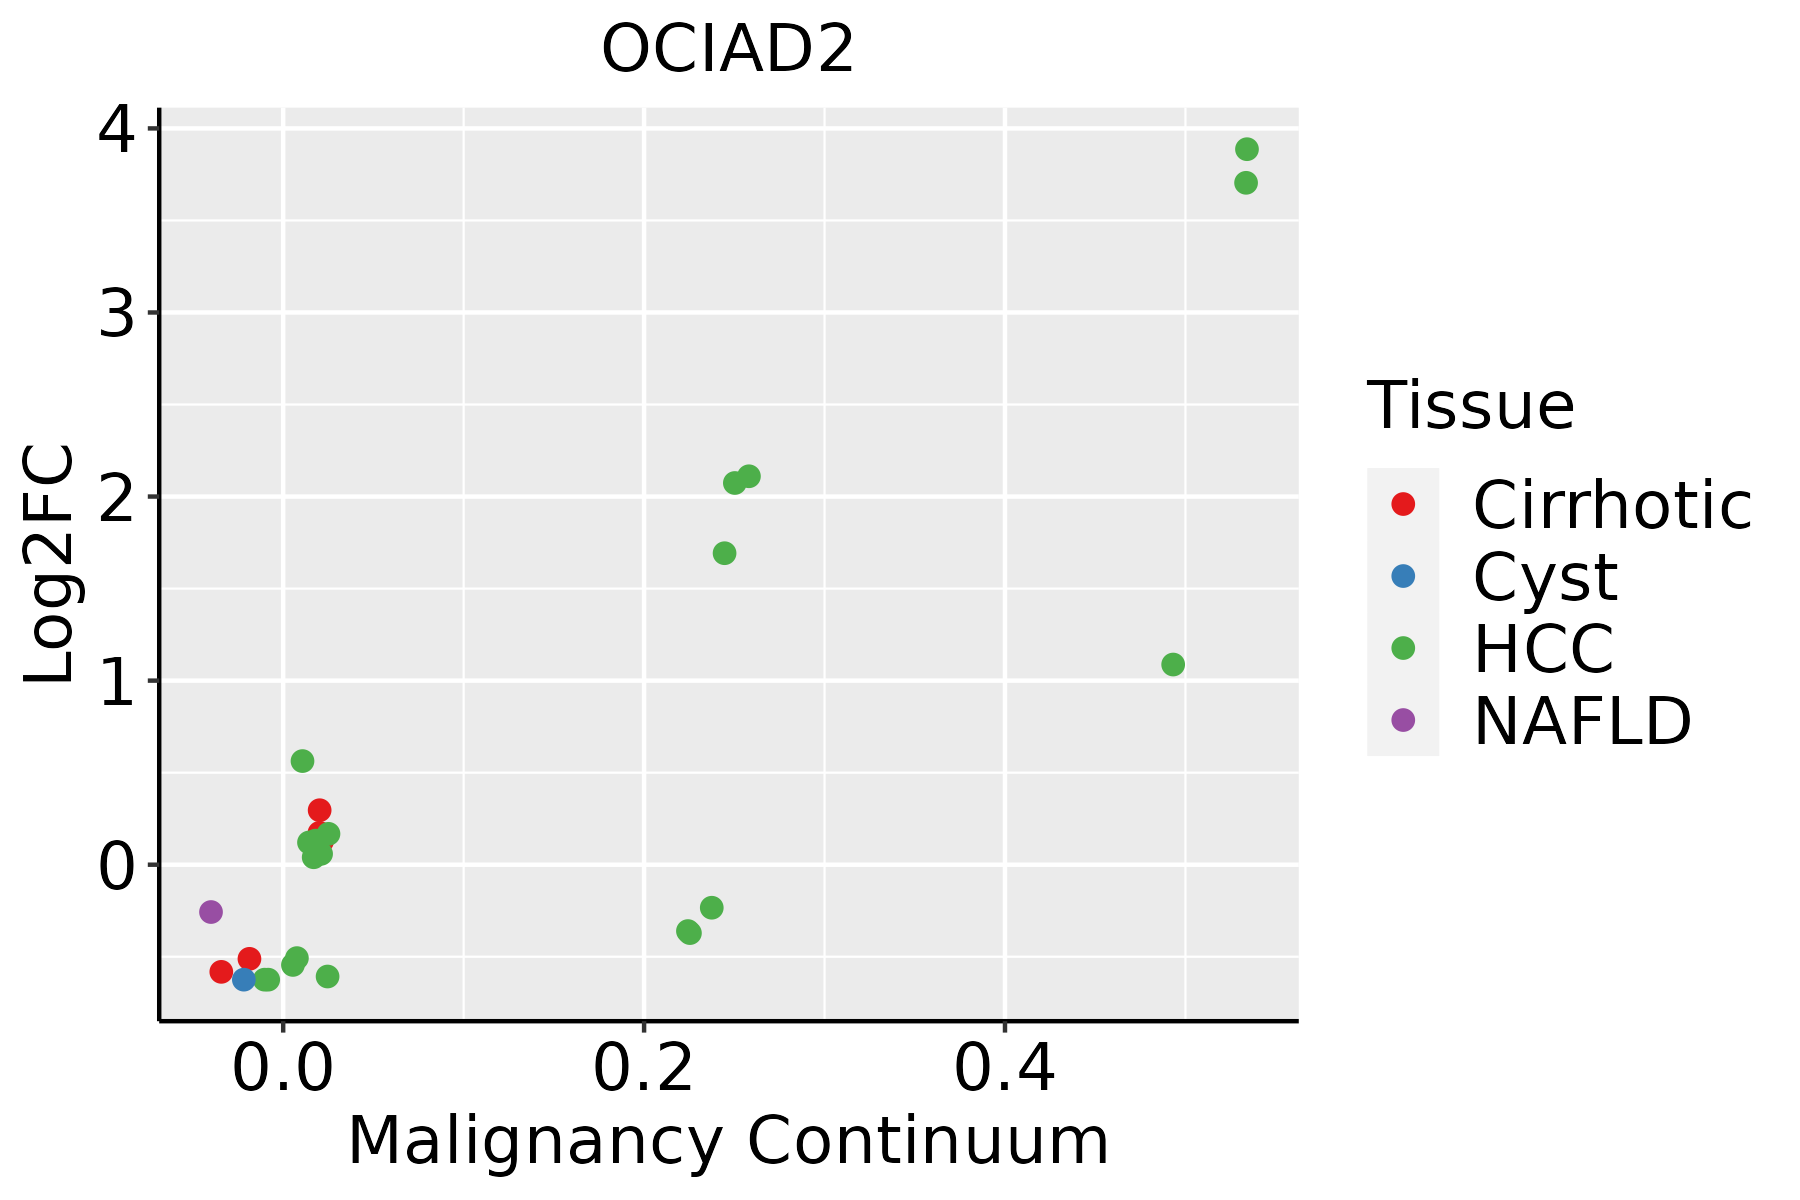 | HCC: Hepatocellular carcinoma |
| NAFLD: Non-alcoholic fatty liver disease |
| Lung | 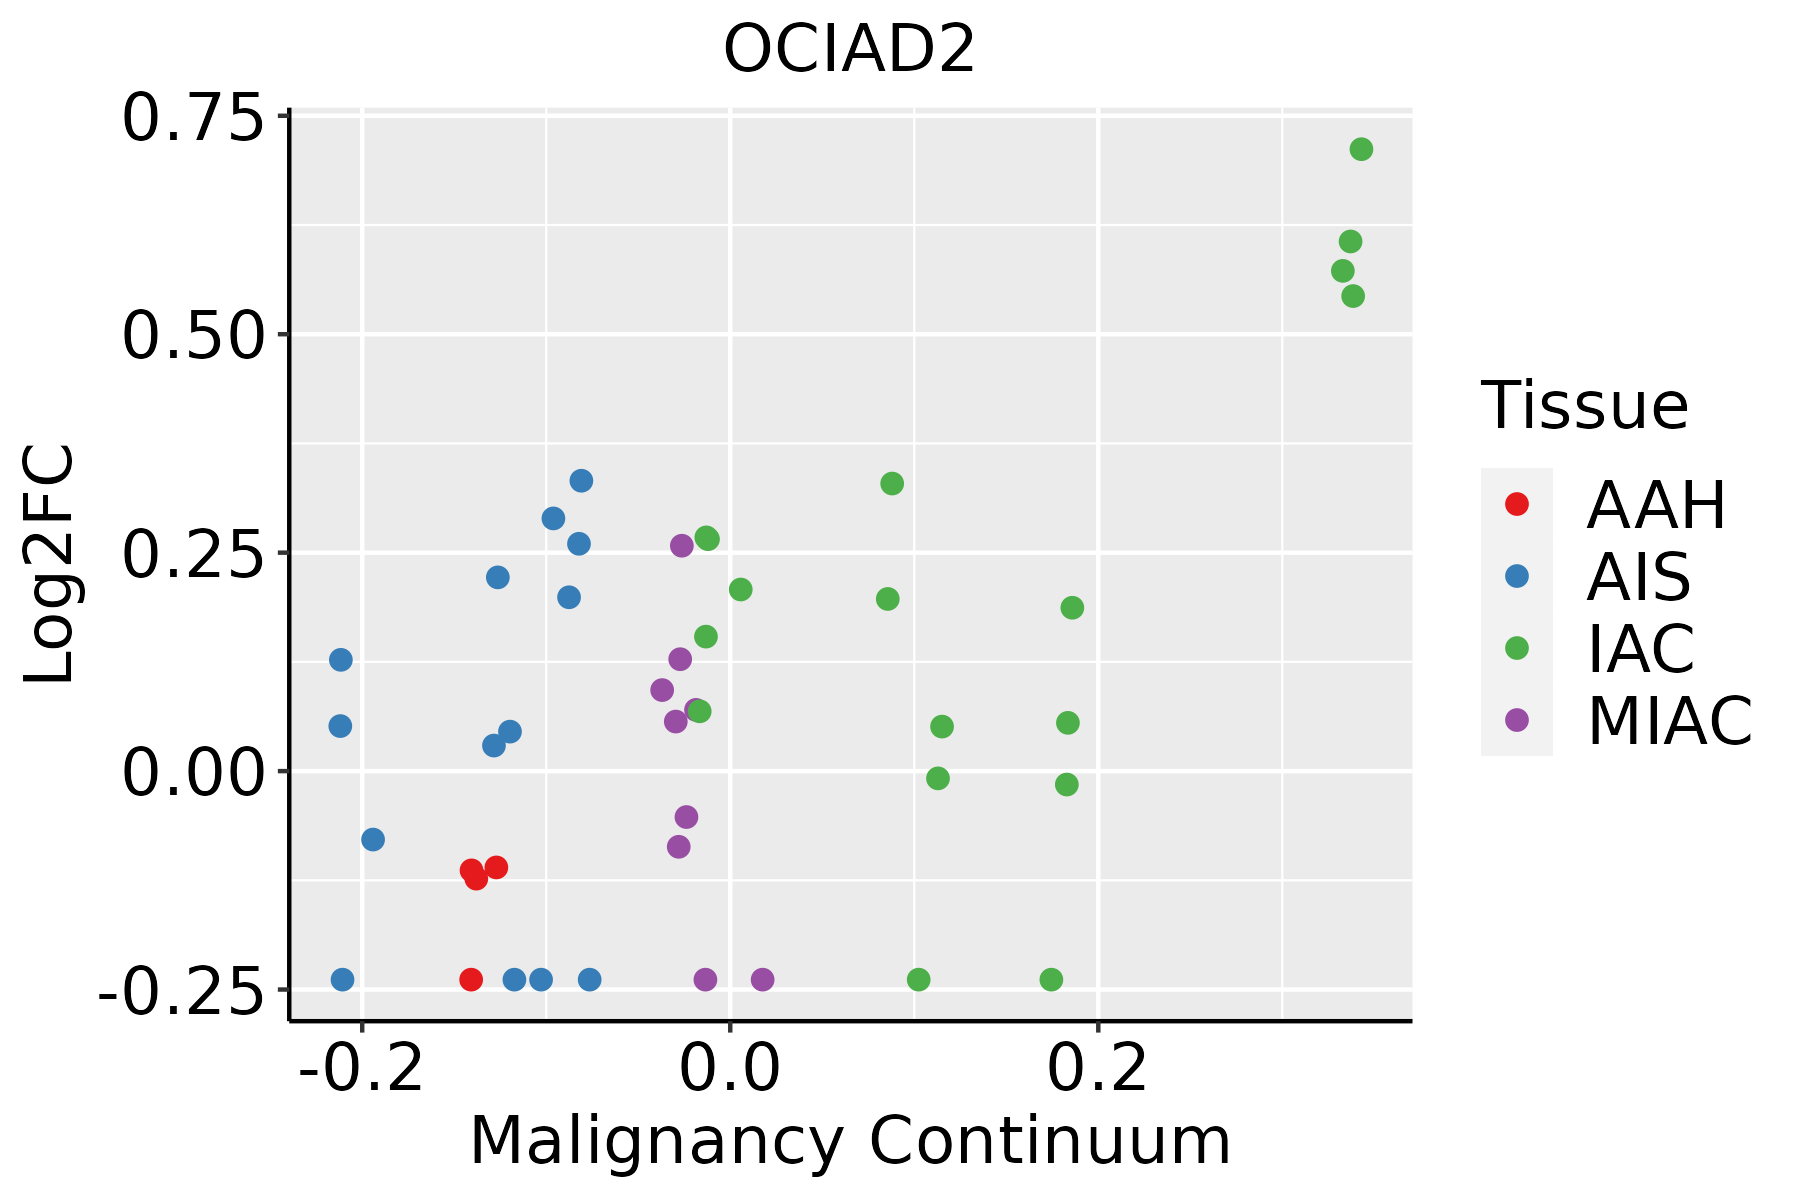 | AAH: Atypical adenomatous hyperplasia |
| AIS: Adenocarcinoma in situ |
| IAC: Invasive lung adenocarcinoma |
| MIA: Minimally invasive adenocarcinoma |
| Oral Cavity | 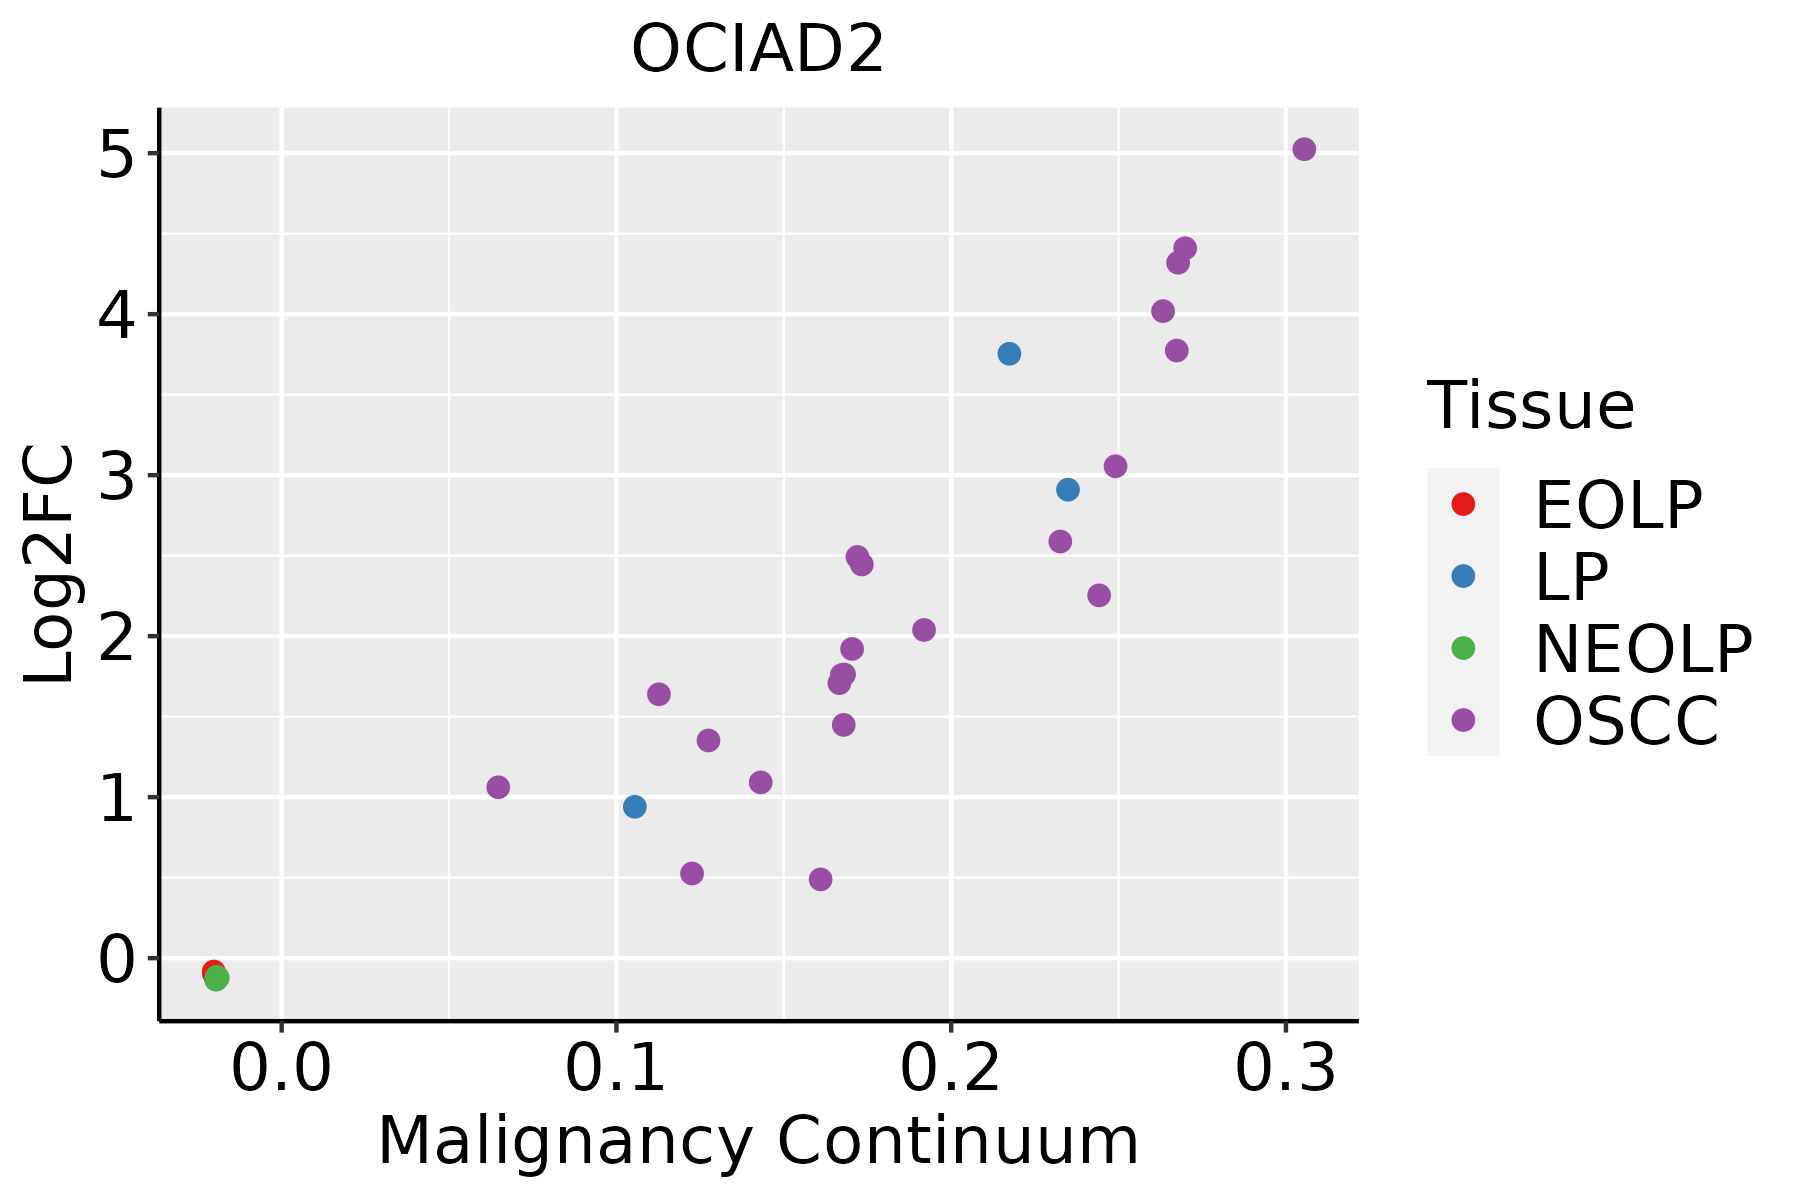 | EOLP: Erosive Oral lichen planus |
| LP: leukoplakia |
| NEOLP: Non-erosive oral lichen planus |
| OSCC: Oral squamous cell carcinoma |
| Prostate | 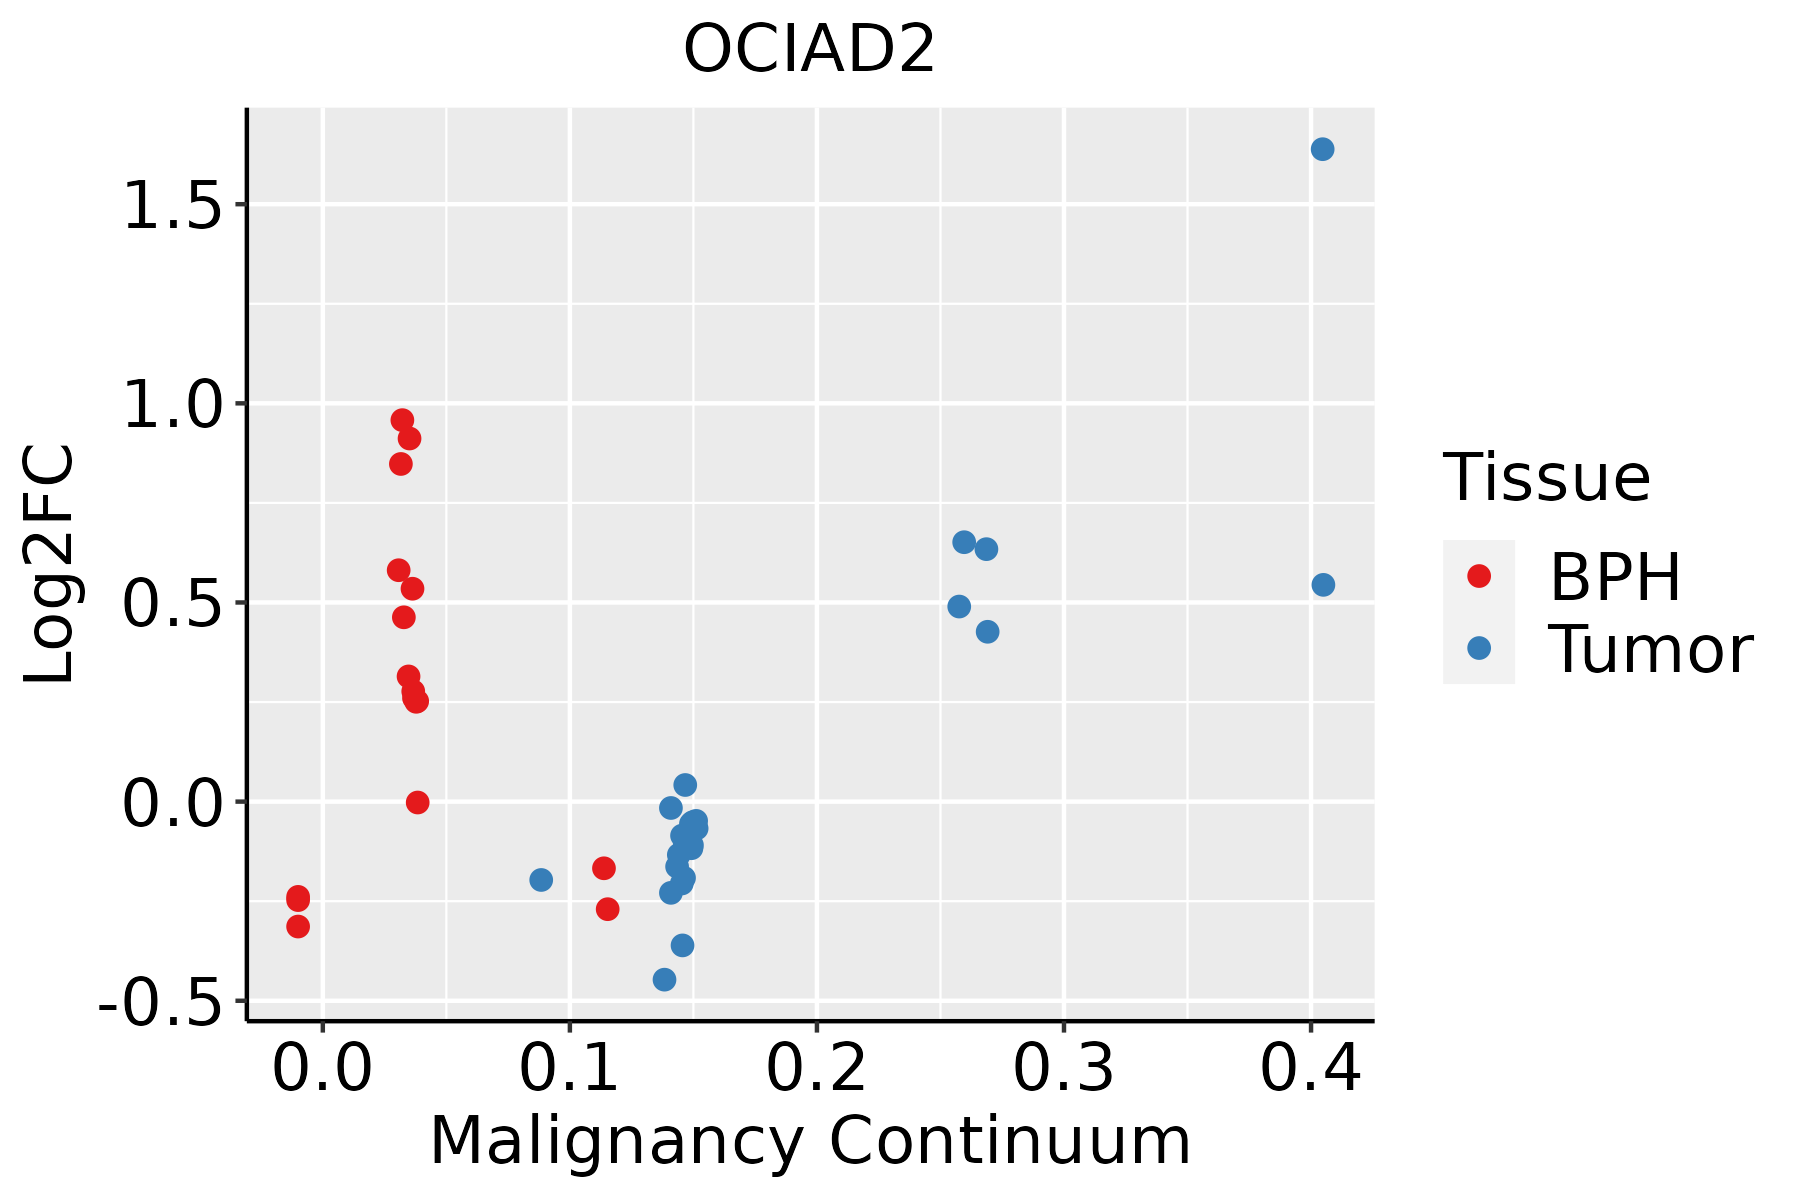 | BPH: Benign Prostatic Hyperplasia |
| Skin |  | AK: Actinic keratosis |
| cSCC: Cutaneous squamous cell carcinoma |
| SCCIS:squamous cell carcinoma in situ |
| Thyroid | 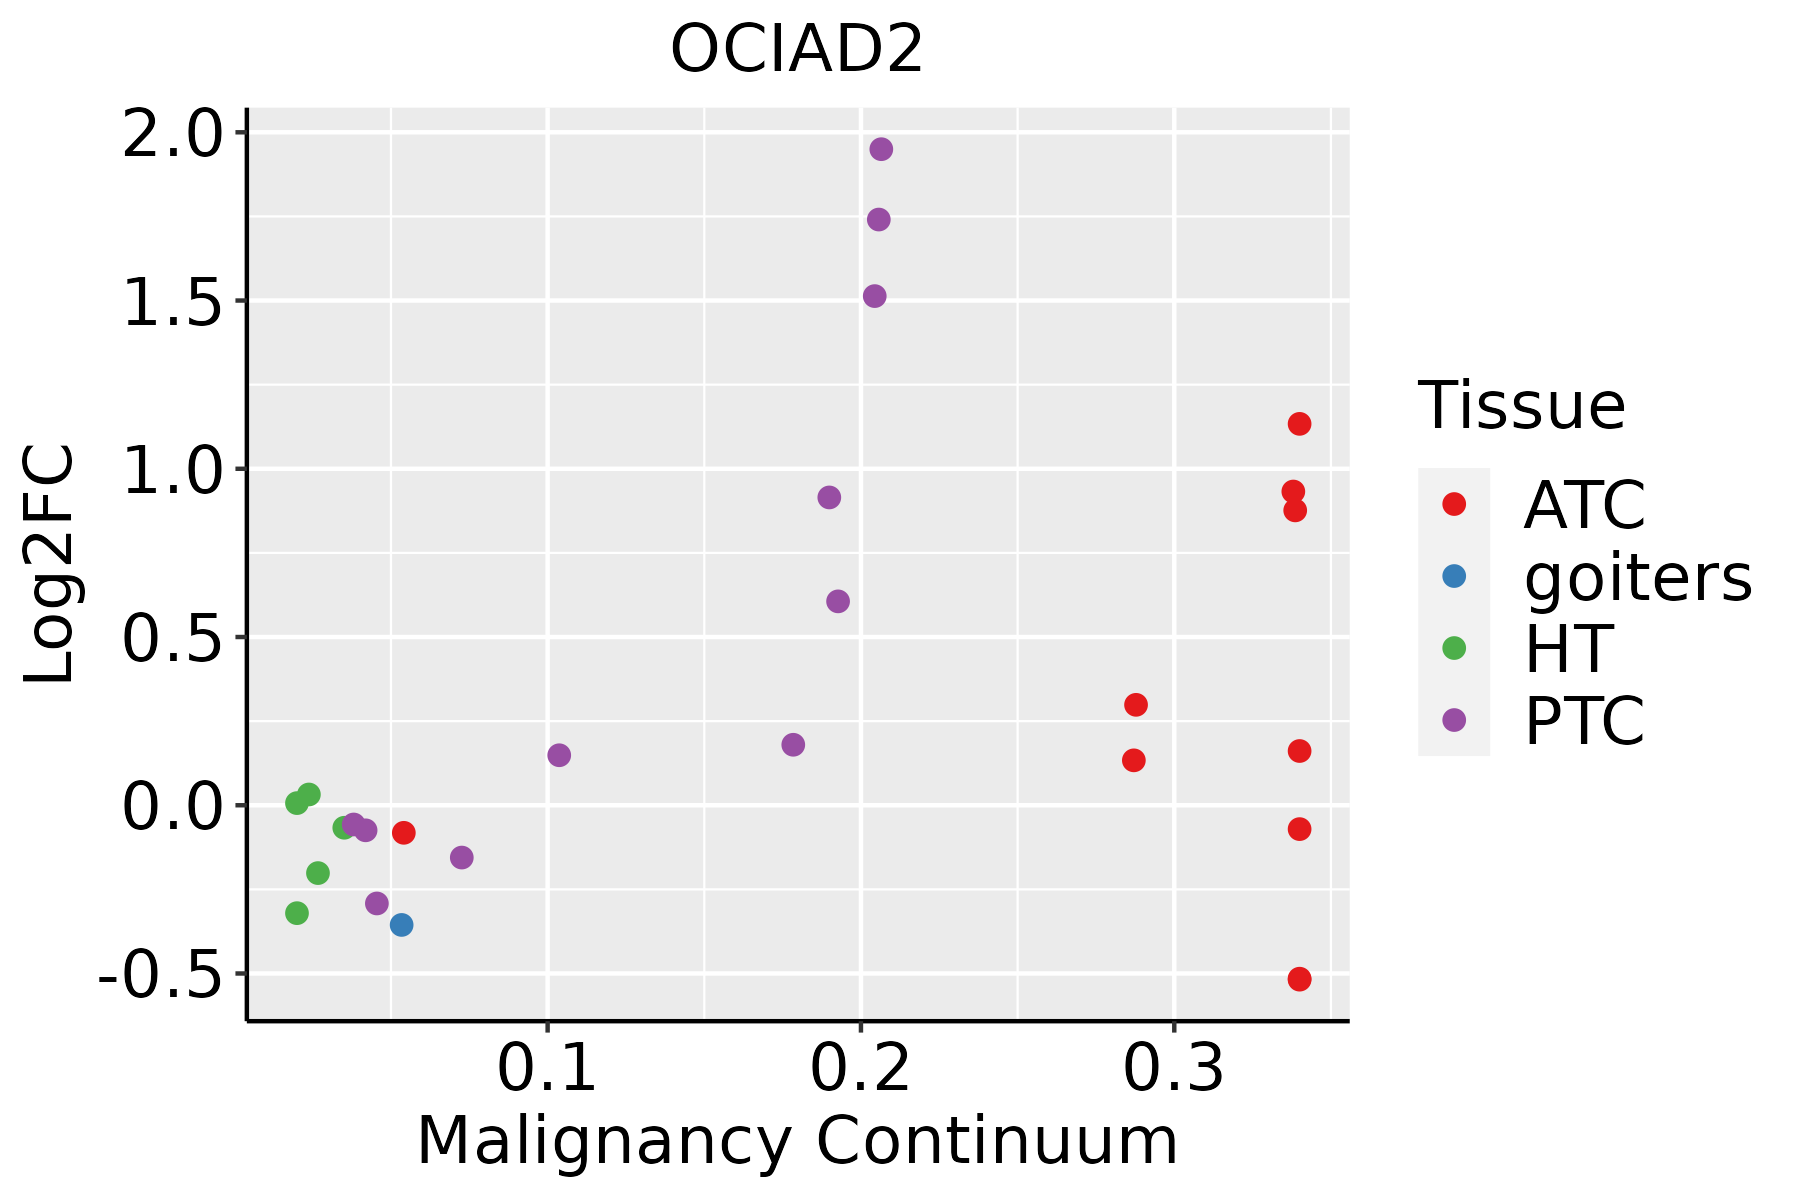 | ATC: Anaplastic thyroid cancer |
| HT: Hashimoto's thyroiditis |
| PTC: Papillary thyroid cancer |
| GO ID | Tissue | Disease Stage | Description | Gene Ratio | Bg Ratio | pvalue | p.adjust | Count |
| GO:0048872 | Colorectum | AD | homeostasis of number of cells | 87/3918 | 272/18723 | 1.16e-05 | 2.61e-04 | 87 |
| GO:00488721 | Colorectum | SER | homeostasis of number of cells | 65/2897 | 272/18723 | 1.70e-04 | 3.19e-03 | 65 |
| GO:00488722 | Colorectum | MSS | homeostasis of number of cells | 82/3467 | 272/18723 | 2.02e-06 | 6.28e-05 | 82 |
| GO:004887216 | Endometrium | AEH | homeostasis of number of cells | 53/2100 | 272/18723 | 4.10e-05 | 6.99e-04 | 53 |
| GO:004887217 | Endometrium | EEC | homeostasis of number of cells | 53/2168 | 272/18723 | 9.52e-05 | 1.34e-03 | 53 |
| GO:0048872111 | Esophagus | ESCC | homeostasis of number of cells | 163/8552 | 272/18723 | 1.40e-06 | 1.69e-05 | 163 |
| GO:004887212 | Liver | Cirrhotic | homeostasis of number of cells | 89/4634 | 272/18723 | 1.76e-03 | 1.12e-02 | 89 |
| GO:004887222 | Liver | HCC | homeostasis of number of cells | 147/7958 | 272/18723 | 7.48e-05 | 6.70e-04 | 147 |
| GO:004887232 | Liver | Cyst | homeostasis of number of cells | 16/496 | 272/18723 | 2.55e-03 | 4.87e-02 | 16 |
| GO:00488728 | Lung | IAC | homeostasis of number of cells | 54/2061 | 272/18723 | 1.20e-05 | 3.64e-04 | 54 |
| GO:004887213 | Lung | AIS | homeostasis of number of cells | 47/1849 | 272/18723 | 1.03e-04 | 2.50e-03 | 47 |
| GO:004887220 | Oral cavity | OSCC | homeostasis of number of cells | 152/7305 | 272/18723 | 1.08e-08 | 2.23e-07 | 152 |
| GO:0048872110 | Oral cavity | LP | homeostasis of number of cells | 87/4623 | 272/18723 | 3.75e-03 | 2.47e-02 | 87 |
| GO:004887218 | Prostate | BPH | homeostasis of number of cells | 79/3107 | 272/18723 | 1.79e-07 | 3.99e-06 | 79 |
| GO:004887219 | Prostate | Tumor | homeostasis of number of cells | 86/3246 | 272/18723 | 5.29e-09 | 2.11e-07 | 86 |
| GO:004887228 | Skin | AK | homeostasis of number of cells | 56/1910 | 272/18723 | 2.33e-07 | 9.18e-06 | 56 |
| GO:004887229 | Skin | cSCC | homeostasis of number of cells | 104/4864 | 272/18723 | 5.34e-06 | 7.71e-05 | 104 |
| GO:00488726 | Stomach | GC | homeostasis of number of cells | 28/1159 | 272/18723 | 5.78e-03 | 4.42e-02 | 28 |
| GO:004887211 | Stomach | CAG with IM | homeostasis of number of cells | 28/1050 | 272/18723 | 1.45e-03 | 1.65e-02 | 28 |
| GO:004887221 | Stomach | CSG | homeostasis of number of cells | 28/1034 | 272/18723 | 1.15e-03 | 1.42e-02 | 28 |
| Hugo Symbol | Variant Class | Variant Classification | dbSNP RS | HGVSc | HGVSp | HGVSp Short | SWISSPROT | BIOTYPE | SIFT | PolyPhen | Tumor Sample Barcode | Tissue | Histology | Sex | Age | Stage | Therapy Types | Drugs | Outcome |
| OCIAD2 | SNV | Missense_Mutation | | c.89N>T | p.Ser30Leu | p.S30L | Q56VL3 | protein_coding | deleterious(0) | probably_damaging(0.987) | TCGA-XX-A89A-01 | Breast | breast invasive carcinoma | Female | >=65 | I/II | Unknown | Unknown | SD |
| OCIAD2 | insertion | Frame_Shift_Ins | novel | c.344_345insGG | p.Asp115GlufsTer26 | p.D115Efs*26 | Q56VL3 | protein_coding | | | TCGA-A8-A09E-01 | Breast | breast invasive carcinoma | Female | >=65 | III/IV | Hormone Therapy | anastrozole | SD |
| OCIAD2 | insertion | In_Frame_Ins | novel | c.342_343insAGGCAGAGAACAAGCTGGAAGTCCAGGCAGGTA | p.Glu114_Asp115insArgGlnArgThrSerTrpLysSerArgGlnVal | p.E114_D115insRQRTSWKSRQV | Q56VL3 | protein_coding | | | TCGA-A8-A09E-01 | Breast | breast invasive carcinoma | Female | >=65 | III/IV | Hormone Therapy | anastrozole | SD |
| OCIAD2 | insertion | Frame_Shift_Ins | novel | c.397_398insA | p.Thr133AsnfsTer3 | p.T133Nfs*3 | Q56VL3 | protein_coding | | | TCGA-UU-A93S-01 | Breast | breast invasive carcinoma | Female | <65 | III/IV | Unknown | Unknown | PD |
| OCIAD2 | SNV | Missense_Mutation | novel | c.366T>A | p.Phe122Leu | p.F122L | Q56VL3 | protein_coding | tolerated(0.1) | probably_damaging(0.931) | TCGA-AA-A02R-01 | Colorectum | colon adenocarcinoma | Female | >=65 | I/II | Unknown | Unknown | PD |
| OCIAD2 | SNV | Missense_Mutation | | c.268N>A | p.Ala90Thr | p.A90T | Q56VL3 | protein_coding | deleterious(0.04) | probably_damaging(0.996) | TCGA-D5-6928-01 | Colorectum | colon adenocarcinoma | Male | >=65 | I/II | Unknown | Unknown | SD |
| OCIAD2 | SNV | Missense_Mutation | | c.115A>T | p.Ile39Phe | p.I39F | Q56VL3 | protein_coding | tolerated(0.08) | possibly_damaging(0.564) | TCGA-CI-6622-01 | Colorectum | rectum adenocarcinoma | Male | >=65 | I/II | Chemotherapy | 5-fluorouracil | SD |
| OCIAD2 | SNV | Missense_Mutation | novel | c.370C>A | p.Pro124Thr | p.P124T | Q56VL3 | protein_coding | deleterious(0) | probably_damaging(0.994) | TCGA-A5-A0G1-01 | Endometrium | uterine corpus endometrioid carcinoma | Female | >=65 | I/II | Unknown | Unknown | SD |
| OCIAD2 | SNV | Missense_Mutation | rs764161793 | c.353G>A | p.Arg118His | p.R118H | Q56VL3 | protein_coding | tolerated(0.57) | probably_damaging(0.997) | TCGA-A5-A0G2-01 | Endometrium | uterine corpus endometrioid carcinoma | Female | <65 | III/IV | Unknown | Unknown | SD |
| OCIAD2 | SNV | Missense_Mutation | rs749812067 | c.123N>T | p.Lys41Asn | p.K41N | Q56VL3 | protein_coding | deleterious(0.04) | probably_damaging(0.995) | TCGA-A5-A2K5-01 | Endometrium | uterine corpus endometrioid carcinoma | Female | >=65 | I/II | Unknown | Unknown | SD |


