
|
|||||
|
 | |
| |
| |
| |
| |
| |
|
Gene: OCIAD1 |
Gene summary for OCIAD1 |
| Gene information | Species | Human | Gene symbol | OCIAD1 | Gene ID | 54940 |
| Gene name | OCIA domain containing 1 | |
| Gene Alias | ASRIJ | |
| Cytomap | 4p11 | |
| Gene Type | protein-coding | GO ID | GO:0006810 | UniProtAcc | A0A024R9U3 |
Top |
Malignant transformation analysis |
| Identification of the aberrant gene expression in precancerous and cancerous lesions by comparing the gene expression of stem-like cells in diseased tissues with normal stem cells |
| Entrez ID | Symbol | Replicates | Species | Organ | Tissue | Adj P-value | Log2FC | Malignancy |
| 54940 | OCIAD1 | AEH-subject1 | Human | Endometrium | AEH | 3.05e-15 | -3.66e-01 | -0.3059 |
| 54940 | OCIAD1 | AEH-subject2 | Human | Endometrium | AEH | 5.71e-13 | -3.35e-01 | -0.2525 |
| 54940 | OCIAD1 | AEH-subject3 | Human | Endometrium | AEH | 1.22e-16 | -3.16e-01 | -0.2576 |
| 54940 | OCIAD1 | AEH-subject4 | Human | Endometrium | AEH | 1.80e-03 | -2.15e-01 | -0.2657 |
| 54940 | OCIAD1 | AEH-subject5 | Human | Endometrium | AEH | 1.57e-06 | -2.75e-01 | -0.2953 |
| 54940 | OCIAD1 | EEC-subject1 | Human | Endometrium | EEC | 1.70e-14 | -3.07e-01 | -0.2682 |
| 54940 | OCIAD1 | EEC-subject2 | Human | Endometrium | EEC | 4.65e-20 | -4.42e-01 | -0.2607 |
| 54940 | OCIAD1 | EEC-subject3 | Human | Endometrium | EEC | 1.59e-45 | -4.98e-01 | -0.2525 |
| 54940 | OCIAD1 | EEC-subject4 | Human | Endometrium | EEC | 2.10e-07 | -2.30e-01 | -0.2571 |
| 54940 | OCIAD1 | EEC-subject5 | Human | Endometrium | EEC | 1.01e-04 | -1.74e-01 | -0.249 |
| 54940 | OCIAD1 | GSM5276934 | Human | Endometrium | EEC | 7.72e-03 | -1.62e-02 | -0.0913 |
| 54940 | OCIAD1 | GSM6177620_NYU_UCEC1_lib1_lib1 | Human | Endometrium | EEC | 5.29e-37 | -4.55e-01 | -0.1869 |
| 54940 | OCIAD1 | GSM6177620_NYU_UCEC1_lib2_lib2 | Human | Endometrium | EEC | 4.32e-39 | -3.04e-01 | -0.1875 |
| 54940 | OCIAD1 | GSM6177620_NYU_UCEC1_lib3_lib3 | Human | Endometrium | EEC | 1.60e-38 | -4.30e-01 | -0.1883 |
| 54940 | OCIAD1 | GSM6177621_NYU_UCEC2_lib1_lib1 | Human | Endometrium | EEC | 4.45e-36 | -2.57e-01 | -0.1934 |
| 54940 | OCIAD1 | GSM6177622_NYU_UCEC3_lib1_lib1 | Human | Endometrium | EEC | 1.90e-58 | -3.43e-01 | -0.1917 |
| 54940 | OCIAD1 | GSM6177622_NYU_UCEC3_lib2_lib2 | Human | Endometrium | EEC | 9.44e-55 | -4.56e-01 | -0.1916 |
| 54940 | OCIAD1 | GSM6177623_NYU_UCEC3_Vis | Human | Endometrium | EEC | 3.53e-07 | -8.86e-02 | -0.1269 |
| 54940 | OCIAD1 | LZE4T | Human | Esophagus | ESCC | 2.20e-15 | 6.46e-01 | 0.0811 |
| 54940 | OCIAD1 | LZE5T | Human | Esophagus | ESCC | 4.29e-07 | 6.97e-02 | 0.0514 |
| Page: 1 2 3 4 5 6 7 8 9 |
| Tissue | Expression Dynamics | Abbreviation |
| Endometrium |  | AEH: Atypical endometrial hyperplasia |
| EEC: Endometrioid Cancer | ||
| Esophagus |  | ESCC: Esophageal squamous cell carcinoma |
| HGIN: High-grade intraepithelial neoplasias | ||
| LGIN: Low-grade intraepithelial neoplasias | ||
| Liver | 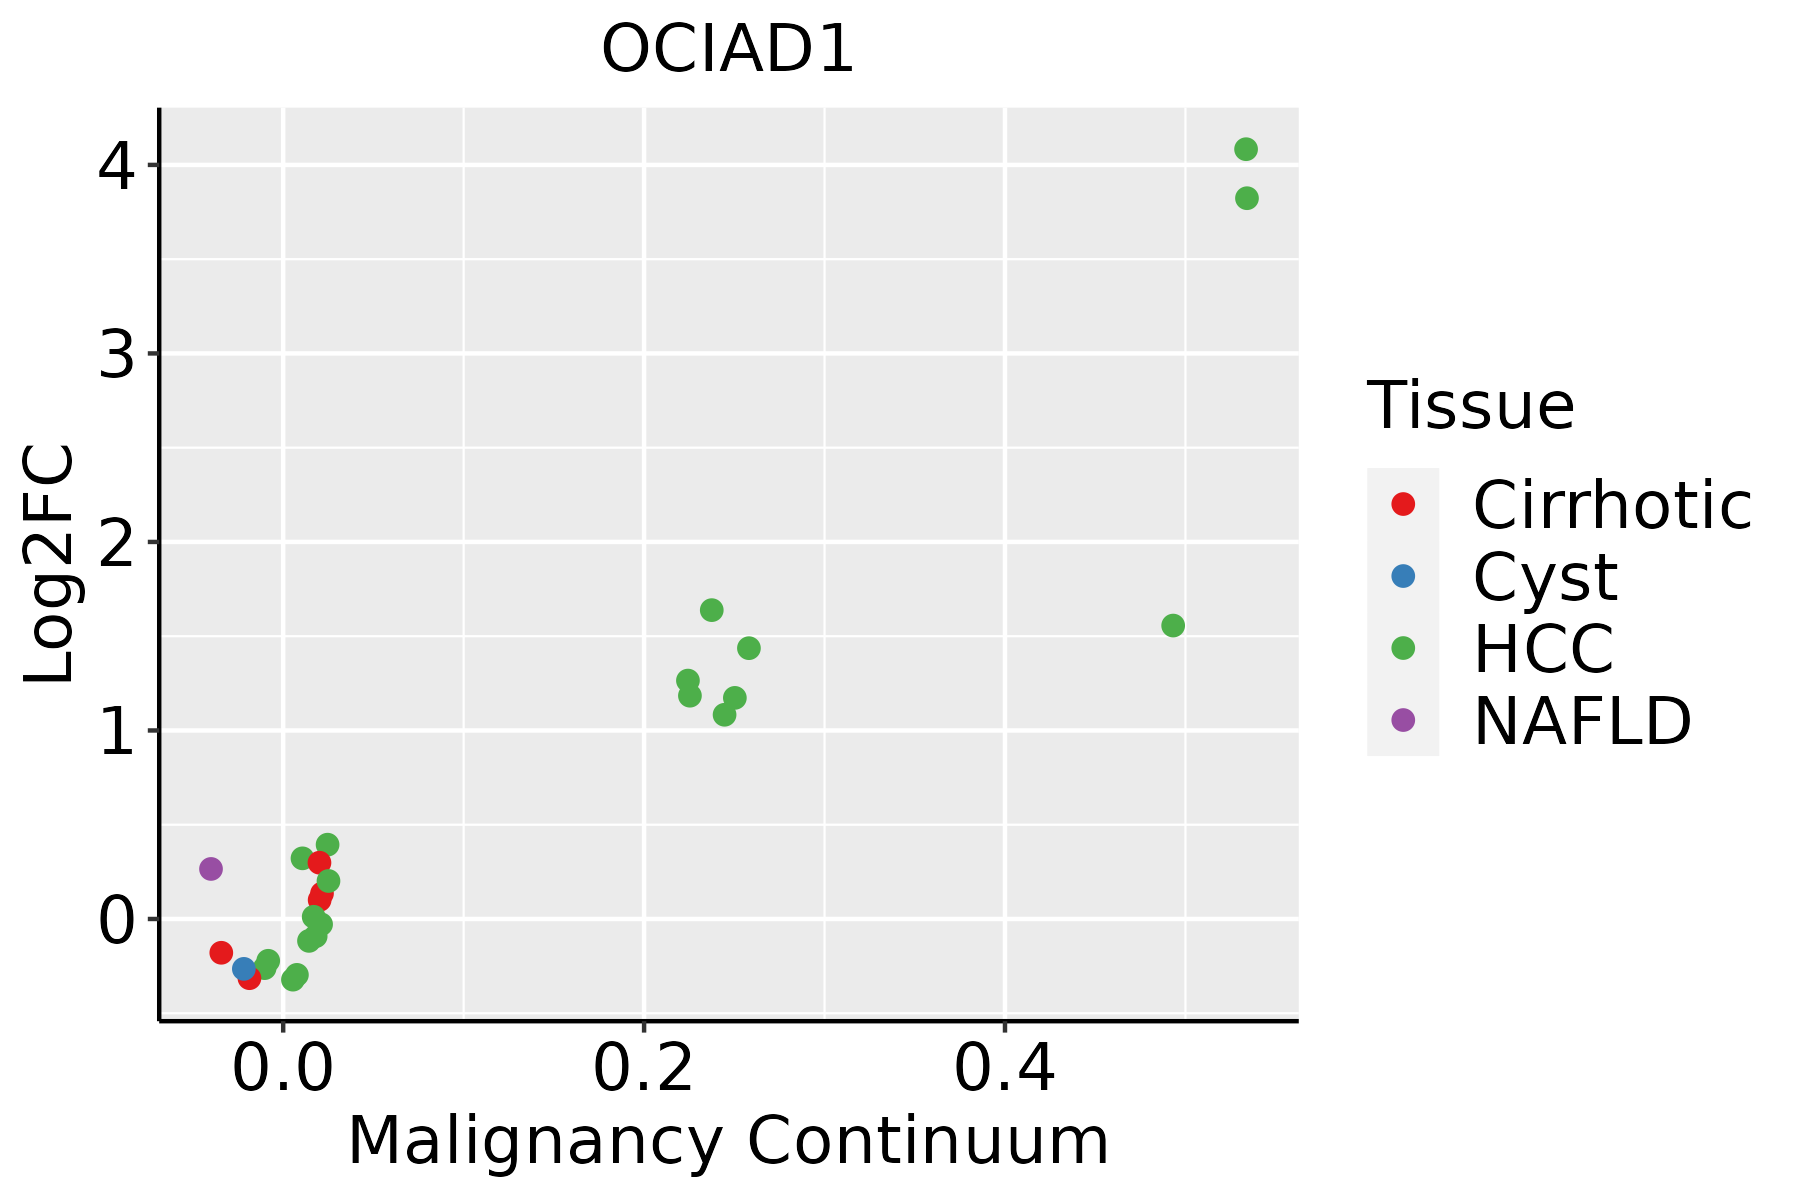 | HCC: Hepatocellular carcinoma |
| NAFLD: Non-alcoholic fatty liver disease | ||
| Oral Cavity | 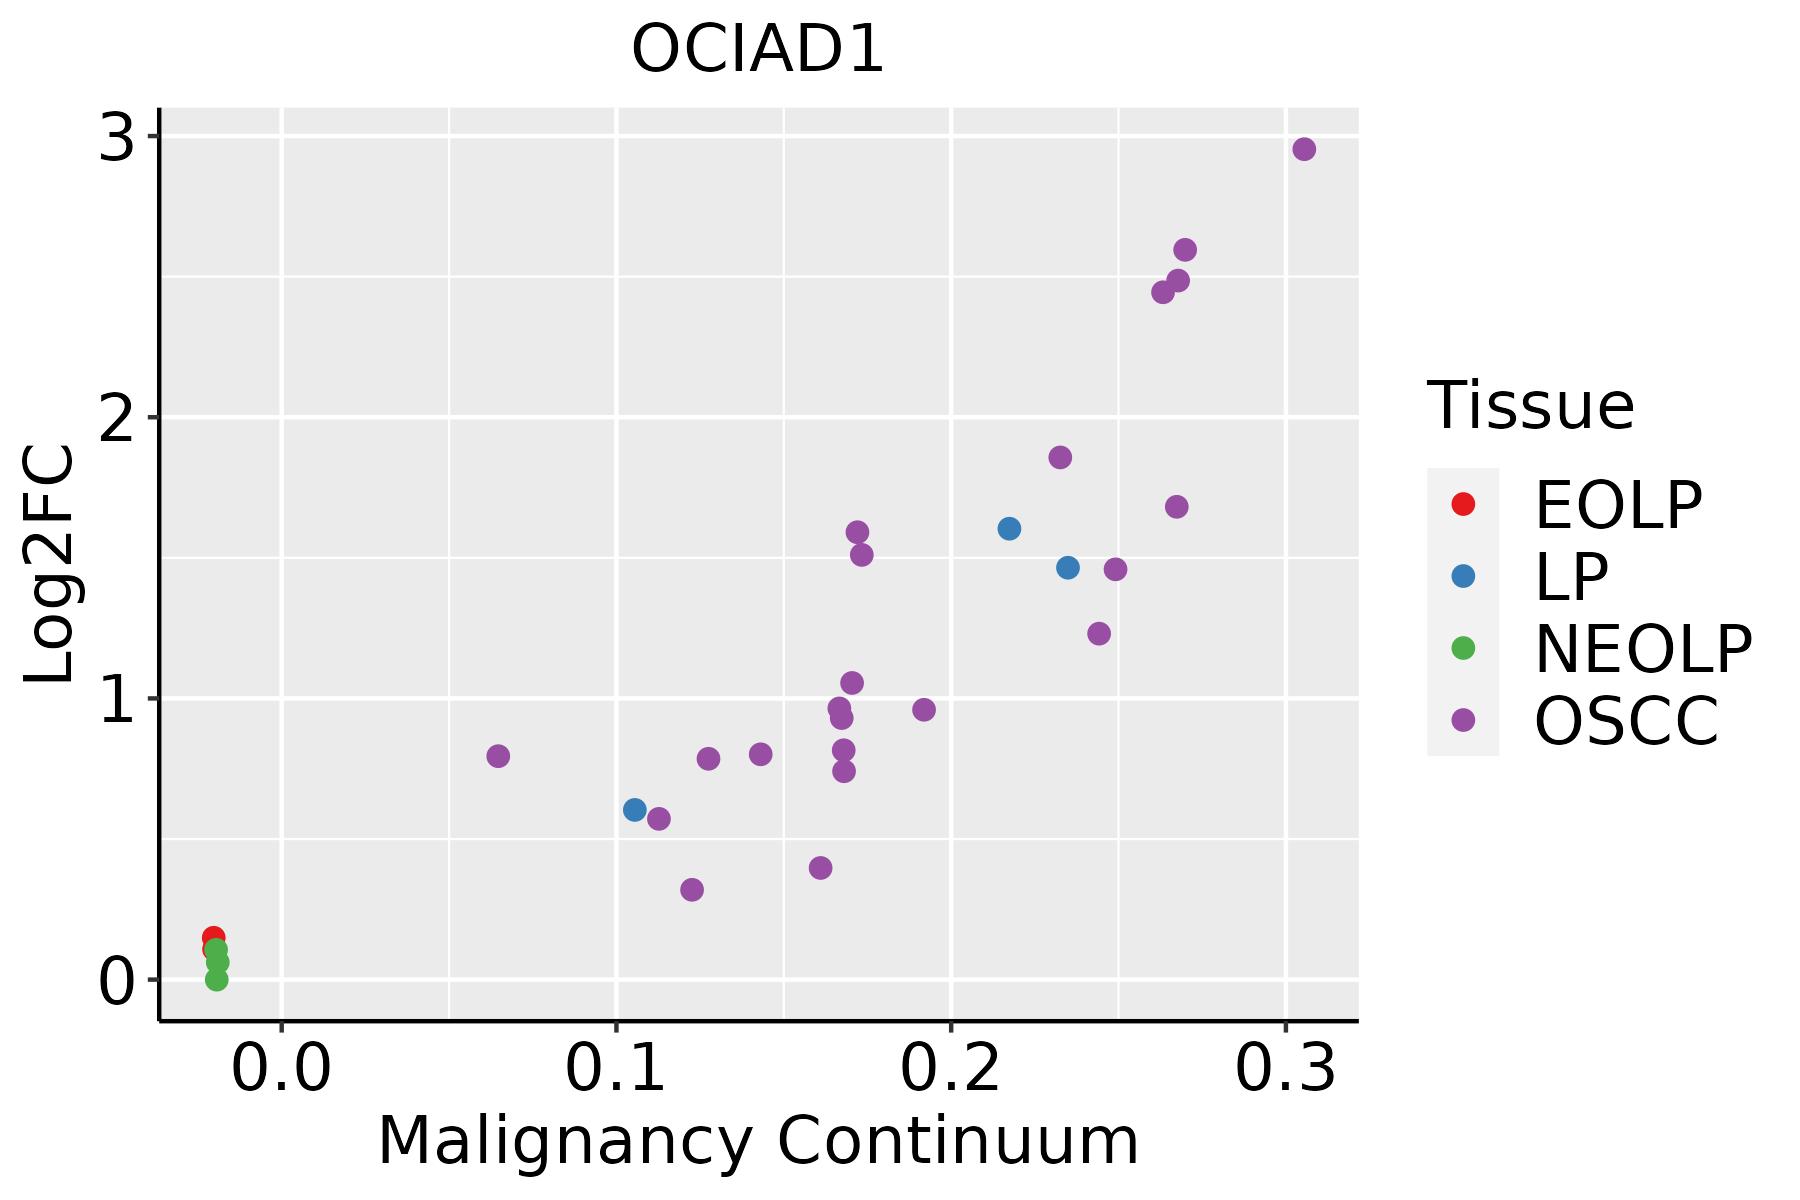 | EOLP: Erosive Oral lichen planus |
| LP: leukoplakia | ||
| NEOLP: Non-erosive oral lichen planus | ||
| OSCC: Oral squamous cell carcinoma | ||
| Prostate |  | BPH: Benign Prostatic Hyperplasia |
| Skin |  | AK: Actinic keratosis |
| cSCC: Cutaneous squamous cell carcinoma | ||
| SCCIS:squamous cell carcinoma in situ | ||
| Thyroid | 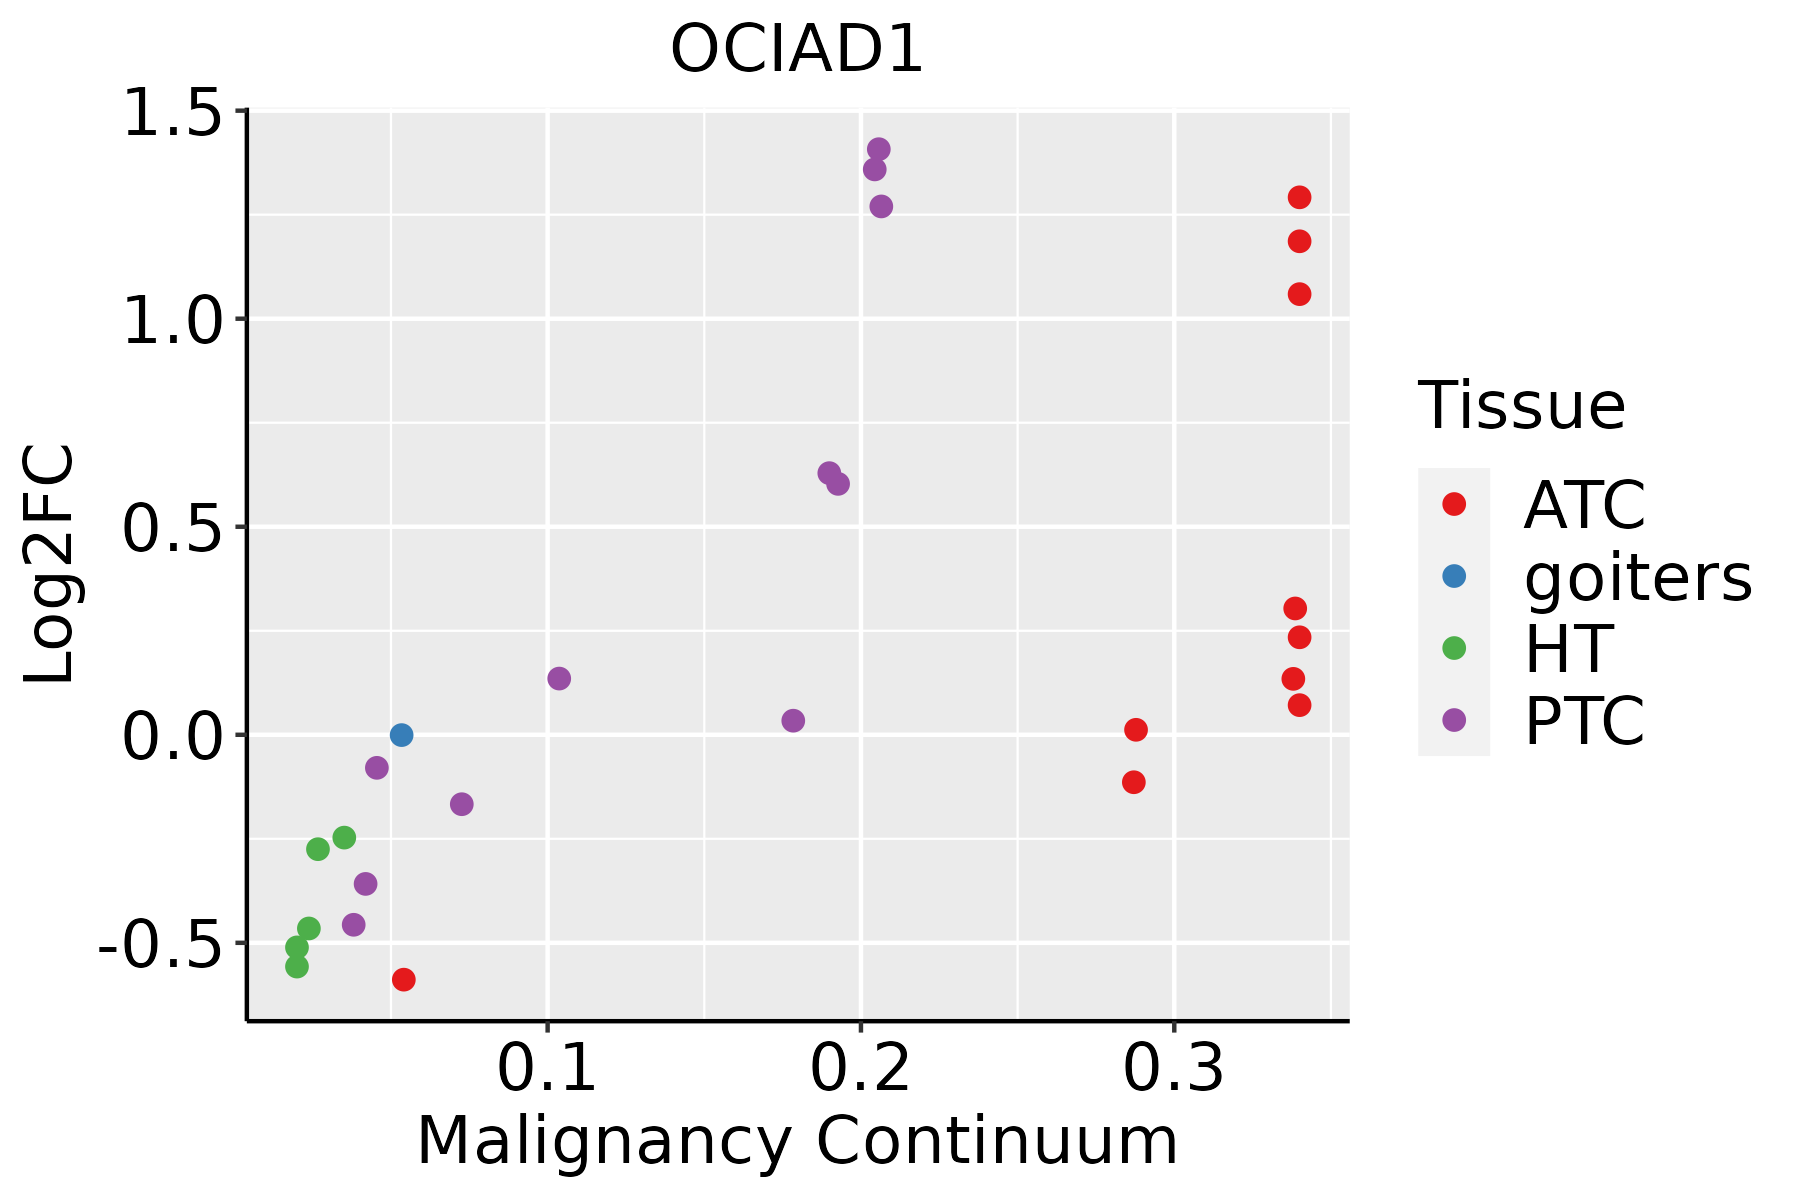 | ATC: Anaplastic thyroid cancer |
| HT: Hashimoto's thyroiditis | ||
| PTC: Papillary thyroid cancer |
| ∗log2FC in expression of this searched gene in stem-like cells from each diseased tissue sample relative to stem-like cells in normal samples in each tissue plotted against the malignancy continuum. Samples are colored based on if they are from different disease stage. |
Top |
Malignant transformation related pathway analysis |
| Find out the enriched GO biological processes and KEGG pathways involved in transition from healthy to precancer to cancer |
| Tissue | Disease Stage | Enriched GO biological Processes |
| Colorectum | AD |  |
| Colorectum | SER |  |
| Colorectum | MSS |  |
| Colorectum | MSI-H |  |
| Colorectum | FAP |  |
| ∗Top 15 enriched GO BP terms are showed in the bar plot of each disease state in each tissue. Each row represents a significant GO biological process which is colored according to the -log10(p.adjust). |
| Page: 1 2 3 4 5 6 7 8 9 |
| GO ID | Tissue | Disease Stage | Description | Gene Ratio | Bg Ratio | pvalue | p.adjust | Count |
| GO:004887216 | Endometrium | AEH | homeostasis of number of cells | 53/2100 | 272/18723 | 4.10e-05 | 6.99e-04 | 53 |
| GO:00488635 | Endometrium | AEH | stem cell differentiation | 40/2100 | 206/18723 | 3.67e-04 | 3.99e-03 | 40 |
| GO:004886314 | Endometrium | EEC | stem cell differentiation | 43/2168 | 206/18723 | 8.48e-05 | 1.21e-03 | 43 |
| GO:004887217 | Endometrium | EEC | homeostasis of number of cells | 53/2168 | 272/18723 | 9.52e-05 | 1.34e-03 | 53 |
| GO:20007365 | Esophagus | HGIN | regulation of stem cell differentiation | 20/2587 | 58/18723 | 5.65e-05 | 1.33e-03 | 20 |
| GO:004887227 | Esophagus | HGIN | homeostasis of number of cells | 54/2587 | 272/18723 | 3.50e-03 | 3.23e-02 | 54 |
| GO:0048872111 | Esophagus | ESCC | homeostasis of number of cells | 163/8552 | 272/18723 | 1.40e-06 | 1.69e-05 | 163 |
| GO:00488638 | Esophagus | ESCC | stem cell differentiation | 122/8552 | 206/18723 | 5.95e-05 | 4.59e-04 | 122 |
| GO:200073614 | Esophagus | ESCC | regulation of stem cell differentiation | 39/8552 | 58/18723 | 7.43e-04 | 3.86e-03 | 39 |
| GO:2000736 | Liver | NAFLD | regulation of stem cell differentiation | 14/1882 | 58/18723 | 1.48e-03 | 1.64e-02 | 14 |
| GO:00488727 | Liver | NAFLD | homeostasis of number of cells | 43/1882 | 272/18723 | 1.86e-03 | 1.91e-02 | 43 |
| GO:00488632 | Liver | NAFLD | stem cell differentiation | 33/1882 | 206/18723 | 4.81e-03 | 3.81e-02 | 33 |
| GO:20007361 | Liver | Cirrhotic | regulation of stem cell differentiation | 26/4634 | 58/18723 | 6.65e-04 | 5.04e-03 | 26 |
| GO:004887212 | Liver | Cirrhotic | homeostasis of number of cells | 89/4634 | 272/18723 | 1.76e-03 | 1.12e-02 | 89 |
| GO:004886311 | Liver | Cirrhotic | stem cell differentiation | 66/4634 | 206/18723 | 1.06e-02 | 4.68e-02 | 66 |
| GO:004887222 | Liver | HCC | homeostasis of number of cells | 147/7958 | 272/18723 | 7.48e-05 | 6.70e-04 | 147 |
| GO:004887220 | Oral cavity | OSCC | homeostasis of number of cells | 152/7305 | 272/18723 | 1.08e-08 | 2.23e-07 | 152 |
| GO:20007364 | Oral cavity | OSCC | regulation of stem cell differentiation | 33/7305 | 58/18723 | 4.32e-03 | 1.75e-02 | 33 |
| GO:00488637 | Oral cavity | OSCC | stem cell differentiation | 96/7305 | 206/18723 | 1.55e-02 | 4.99e-02 | 96 |
| GO:0048872110 | Oral cavity | LP | homeostasis of number of cells | 87/4623 | 272/18723 | 3.75e-03 | 2.47e-02 | 87 |
| Page: 1 2 3 |
| Pathway ID | Tissue | Disease Stage | Description | Gene Ratio | Bg Ratio | pvalue | p.adjust | qvalue | Count |
| Page: 1 |
Top |
Cell-cell communication analysis |
| Identification of potential cell-cell interactions between two cell types and their ligand-receptor pairs for different disease states |
| Ligand | Receptor | LRpair | Pathway | Tissue | Disease Stage |
| Page: 1 |
Top |
Single-cell gene regulatory network inference analysis |
| Find out the significant the regulons (TFs) and the target genes of each regulon across cell types for different disease states |
| TF | Cell Type | Tissue | Disease Stage | Target Gene | RSS | Regulon Activity |
| ∗The dot plots of a searched regulon are shown for all cell subpopulations in each disease state of each tissue based on the regulon specific score inferred using pySCENIC and by calculating the average expression. |
| Page: 1 |
Top |
Somatic mutation of malignant transformation related genes |
| Annotation of somatic variants for genes involved in malignant transformation |
| Hugo Symbol | Variant Class | Variant Classification | dbSNP RS | HGVSc | HGVSp | HGVSp Short | SWISSPROT | BIOTYPE | SIFT | PolyPhen | Tumor Sample Barcode | Tissue | Histology | Sex | Age | Stage | Therapy Types | Drugs | Outcome |
| OCIAD1 | SNV | Missense_Mutation | c.683N>C | p.Arg228Thr | p.R228T | Q9NX40 | protein_coding | tolerated(0.07) | benign(0.001) | TCGA-A2-A0CX-01 | Breast | breast invasive carcinoma | Female | <65 | I/II | Chemotherapy | adriamycin | SD | |
| OCIAD1 | SNV | Missense_Mutation | c.565G>C | p.Glu189Gln | p.E189Q | Q9NX40 | protein_coding | deleterious(0.02) | probably_damaging(0.941) | TCGA-GM-A2DH-01 | Breast | breast invasive carcinoma | Female | <65 | I/II | Chemotherapy | taxol | CR | |
| OCIAD1 | SNV | Missense_Mutation | c.622N>C | p.Glu208Gln | p.E208Q | Q9NX40 | protein_coding | tolerated(0.07) | benign(0.074) | TCGA-C5-A1BQ-01 | Cervix | cervical & endocervical cancer | Female | >=65 | III/IV | Chemotherapy | cisplatin | CR | |
| OCIAD1 | SNV | Missense_Mutation | novel | c.465N>A | p.Met155Ile | p.M155I | Q9NX40 | protein_coding | tolerated(0.18) | benign(0.005) | TCGA-EA-A3HS-01 | Cervix | cervical & endocervical cancer | Female | <65 | I/II | Unknown | Unknown | SD |
| OCIAD1 | SNV | Missense_Mutation | c.494N>A | p.Ser165Asn | p.S165N | Q9NX40 | protein_coding | tolerated(0.06) | probably_damaging(0.997) | TCGA-A6-6780-01 | Colorectum | colon adenocarcinoma | Male | >=65 | I/II | Unknown | Unknown | SD | |
| OCIAD1 | SNV | Missense_Mutation | c.61A>G | p.Ile21Val | p.I21V | Q9NX40 | protein_coding | tolerated(0.46) | benign(0.191) | TCGA-AD-6890-01 | Colorectum | colon adenocarcinoma | Male | >=65 | I/II | Unknown | Unknown | SD | |
| OCIAD1 | SNV | Missense_Mutation | novel | c.535N>G | p.His179Asp | p.H179D | Q9NX40 | protein_coding | tolerated(0.46) | benign(0.003) | TCGA-AZ-4315-01 | Colorectum | colon adenocarcinoma | Male | <65 | I/II | Unknown | Unknown | SD |
| OCIAD1 | SNV | Missense_Mutation | novel | c.310N>C | p.Lys104Gln | p.K104Q | Q9NX40 | protein_coding | tolerated(0.15) | benign(0.196) | TCGA-CA-6717-01 | Colorectum | colon adenocarcinoma | Male | <65 | I/II | Chemotherapy | oxaliplatin | CR |
| OCIAD1 | deletion | Frame_Shift_Del | c.690delN | p.Glu233LysfsTer4 | p.E233Kfs*4 | Q9NX40 | protein_coding | TCGA-A6-A565-01 | Colorectum | colon adenocarcinoma | Female | <65 | III/IV | Unspecific | 5FU | PD | |||
| OCIAD1 | deletion | Frame_Shift_Del | c.696delA | p.Glu233LysfsTer4 | p.E233Kfs*4 | Q9NX40 | protein_coding | TCGA-AA-3811-01 | Colorectum | colon adenocarcinoma | Female | >=65 | III/IV | Unknown | Unknown | PD |
| Page: 1 2 3 4 |
Top |
Related drugs of malignant transformation related genes |
| Identification of chemicals and drugs interact with genes involved in malignant transfromation |
| (DGIdb 4.0) |
| Entrez ID | Symbol | Category | Interaction Types | Drug Claim Name | Drug Name | PMIDs |
| Page: 1 |

Copyright 2023-Present -The University of Texas Health Science Center at Houston |