Schematic overview of the cellular and molecular mechanisms involved in the cancer progression, including the proposed cellular and molecular mechanisms in cancer cells trajectory. AT1: alveolar type 1 cells; AT2: alveolar type 2 cells; AAH: atypical adenomatous hyperplasia; AIS: adenocarcinoma in situ; MIA: minimally invasive adenocarcinoma; IA: invasive adenocarcinoma; EMT: epithelial-mesenchymal transition

Home

Download

Statistics

Help

Contact

Center for Computational Systems Medicine
leaf

Gene summary

leaf

Malignant transformation analysis

leaf

Malignant transformation related pathway analysis

leaf

Cell-cell communication analysis

leaf

Single-cell gene regulatory network inference analysis

leaf

Somatic mutation of malignant transformation related genes

leaf

Related drugs of malignant transformation related genes

Gene: OBSL1

Gene summary for OBSL1

check button Gene summary.

Gene informationSpeciesHuman
Gene symbol

OBSL1

Gene ID

23363

Gene nameobscurin like cytoskeletal adaptor 1
Gene AliasOBSL1
Cytomap2q35
Gene Typeprotein-coding
GO ID

GO:0000226

UniProtAcc

O75147


Top

Malignant transformation analysis

check button Identification of the aberrant gene expression in precancerous and cancerous lesions by comparing the gene expression of stem-like cells in diseased tissues with normal stem cells
check button Malignant transformation involving gene list.
Entrez IDSymbolReplicatesSpeciesOrganTissueAdj P-valueLog2FCMalignancy
23363OBSL1LZE8THumanEsophagusESCC9.25e-054.48e-020.067
23363OBSL1P2T-EHumanEsophagusESCC2.55e-151.74e-010.1177
23363OBSL1P4T-EHumanEsophagusESCC2.02e-068.24e-020.1323
23363OBSL1P5T-EHumanEsophagusESCC3.55e-095.74e-020.1327
23363OBSL1P8T-EHumanEsophagusESCC1.10e-172.64e-010.0889
23363OBSL1P9T-EHumanEsophagusESCC2.73e-121.63e-010.1131
23363OBSL1P10T-EHumanEsophagusESCC5.78e-269.04e-020.116
23363OBSL1P11T-EHumanEsophagusESCC9.15e-032.82e-010.1426
23363OBSL1P12T-EHumanEsophagusESCC1.15e-201.42e-010.1122
23363OBSL1P15T-EHumanEsophagusESCC9.69e-161.08e-010.1149
23363OBSL1P16T-EHumanEsophagusESCC1.06e-152.18e-010.1153
23363OBSL1P17T-EHumanEsophagusESCC4.24e-027.30e-020.1278
23363OBSL1P20T-EHumanEsophagusESCC6.30e-091.52e-010.1124
23363OBSL1P21T-EHumanEsophagusESCC1.71e-202.23e-010.1617
23363OBSL1P22T-EHumanEsophagusESCC5.94e-221.08e-010.1236
23363OBSL1P23T-EHumanEsophagusESCC9.25e-03-6.90e-020.108
23363OBSL1P24T-EHumanEsophagusESCC1.23e-131.59e-020.1287
23363OBSL1P26T-EHumanEsophagusESCC8.48e-156.04e-020.1276
23363OBSL1P27T-EHumanEsophagusESCC4.27e-138.10e-020.1055
23363OBSL1P28T-EHumanEsophagusESCC1.30e-098.27e-020.1149
Page: 1 2 3 4 5 

check button Transcriptomic changes along malignancy continuum.
TissueExpression DynamicsAbbreviation
EsophagusThe image shows the transcriptomic changes along malignancy continuum.log2FC in expression of this searched gene in stem-like cells from each diseased tissue sample relative to stem-like cells in normal samples in each tissue plotted against the malignancy continuum. Samples are colored based on if they are from different disease stage.
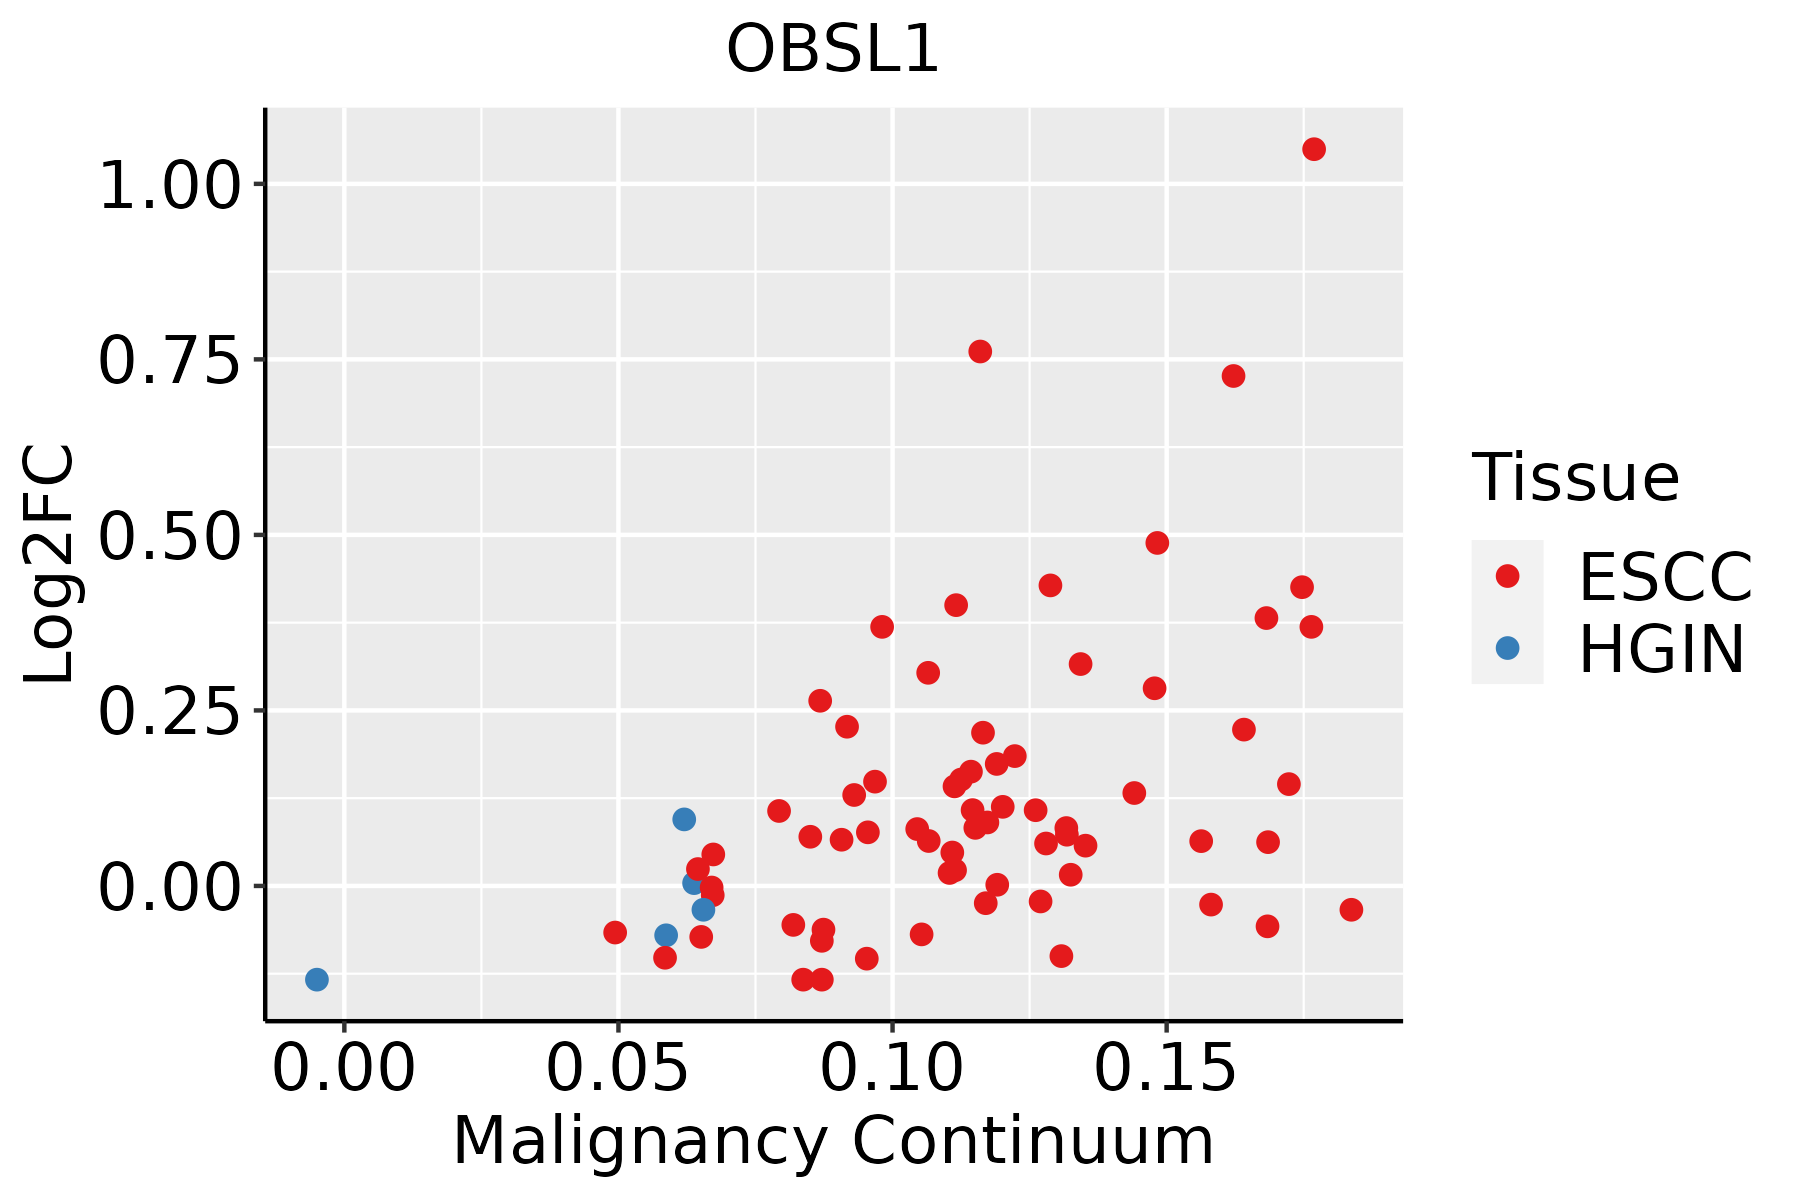
ESCC: Esophageal squamous cell carcinoma
HGIN: High-grade intraepithelial neoplasias
LGIN: Low-grade intraepithelial neoplasias
LiverThe image shows the transcriptomic changes along malignancy continuum.log2FC in expression of this searched gene in stem-like cells from each diseased tissue sample relative to stem-like cells in normal samples in each tissue plotted against the malignancy continuum. Samples are colored based on if they are from different disease stage.HCC: Hepatocellular carcinoma
NAFLD: Non-alcoholic fatty liver disease
Oral CavityThe image shows the transcriptomic changes along malignancy continuum.log2FC in expression of this searched gene in stem-like cells from each diseased tissue sample relative to stem-like cells in normal samples in each tissue plotted against the malignancy continuum. Samples are colored based on if they are from different disease stage.EOLP: Erosive Oral lichen planus
LP: leukoplakia
NEOLP: Non-erosive oral lichen planus
OSCC: Oral squamous cell carcinoma
ProstateThe image shows the transcriptomic changes along malignancy continuum.log2FC in expression of this searched gene in stem-like cells from each diseased tissue sample relative to stem-like cells in normal samples in each tissue plotted against the malignancy continuum. Samples are colored based on if they are from different disease stage.BPH: Benign Prostatic Hyperplasia
ThyroidThe image shows the transcriptomic changes along malignancy continuum.log2FC in expression of this searched gene in stem-like cells from each diseased tissue sample relative to stem-like cells in normal samples in each tissue plotted against the malignancy continuum. Samples are colored based on if they are from different disease stage.
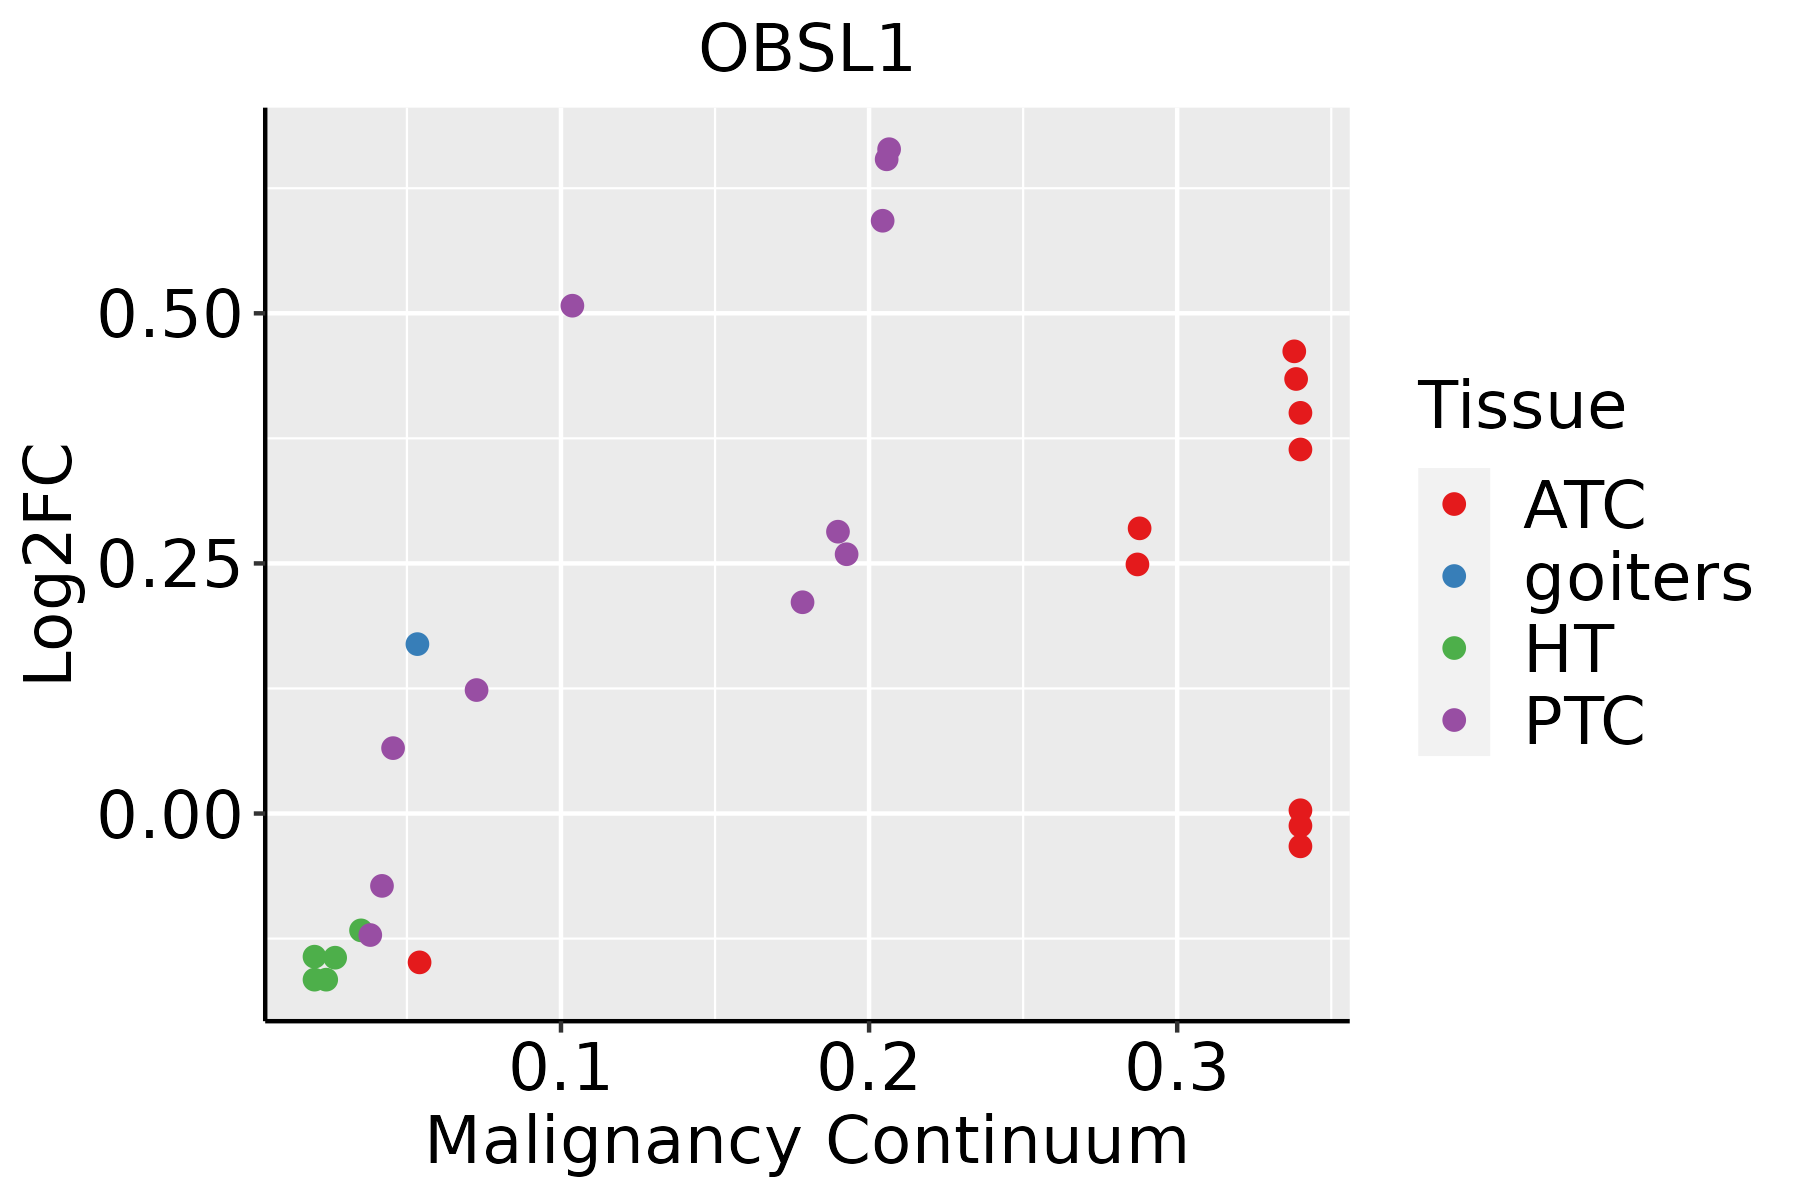
ATC: Anaplastic thyroid cancer
HT: Hashimoto's thyroiditis
PTC: Papillary thyroid cancer
∗log2FC in expression of this searched gene in stem-like cells from each diseased tissue sample relative to stem-like cells in normal samples in each tissue plotted against the malignancy continuum. Samples are colored based on if they are from different disease stage.

Top

Malignant transformation related pathway analysis

check buttonFind out the enriched GO biological processes and KEGG pathways involved in transition from healthy to precancer to cancer
check button Figure of enriched GO biological processes.
TissueDisease StageEnriched GO biological Processes
ColorectumADGO analysis - Figure of enriched GO biological processes: Top 15 enriched GO BP terms are showed in the bar plot of each disease state in each tissue. Each row represents a significant GO biological process which is colored according to the -log10(p.adjust).
ColorectumSERGO analysis - Figure of enriched GO biological processes: Top 15 enriched GO BP terms are showed in the bar plot of each disease state in each tissue. Each row represents a significant GO biological process which is colored according to the -log10(p.adjust).
ColorectumMSSGO analysis - Figure of enriched GO biological processes: Top 15 enriched GO BP terms are showed in the bar plot of each disease state in each tissue. Each row represents a significant GO biological process which is colored according to the -log10(p.adjust).
ColorectumMSI-HGO analysis - Figure of enriched GO biological processes: Top 15 enriched GO BP terms are showed in the bar plot of each disease state in each tissue. Each row represents a significant GO biological process which is colored according to the -log10(p.adjust).
ColorectumFAPGO analysis - Figure of enriched GO biological processes: Top 15 enriched GO BP terms are showed in the bar plot of each disease state in each tissue. Each row represents a significant GO biological process which is colored according to the -log10(p.adjust).
∗Top 15 enriched GO BP terms are showed in the bar plot of each disease state in each tissue. Each row represents a significant GO biological process which is colored according to the -log10(p.adjust).
Page: 1 2 3 4 5 6 7 8 9 

check button Enriched GO biological processes.
GO IDTissueDisease StageDescriptionGene RatioBg Ratiopvaluep.adjustCount
GO:014001414EsophagusESCCmitotic nuclear division218/8552287/187236.17e-261.78e-23218
GO:000734615EsophagusESCCregulation of mitotic cell cycle293/8552457/187238.00e-165.64e-14293
GO:00482853EsophagusESCCorganelle fission301/8552488/187234.64e-132.12e-11301
GO:00002802EsophagusESCCnuclear division270/8552439/187231.17e-114.24e-10270
GO:00070883EsophagusESCCregulation of mitotic nuclear division78/8552110/187236.96e-081.21e-0678
GO:00070308EsophagusESCCGolgi organization101/8552157/187231.78e-062.10e-05101
GO:00517831EsophagusESCCregulation of nuclear division90/8552139/187234.30e-064.60e-0590
GO:002260420EsophagusESCCregulation of cell morphogenesis180/8552309/187235.19e-065.45e-05180
GO:003134616EsophagusESCCpositive regulation of cell projection organization201/8552353/187231.19e-051.11e-04201
GO:001072010EsophagusESCCpositive regulation of cell development172/8552298/187231.74e-051.55e-04172
GO:005076710EsophagusESCCregulation of neurogenesis203/8552364/187236.10e-054.68e-04203
GO:00507697EsophagusESCCpositive regulation of neurogenesis131/8552225/187239.71e-056.90e-04131
GO:00340676EsophagusESCCprotein localization to Golgi apparatus23/855229/187232.25e-041.40e-0323
GO:001097516EsophagusESCCregulation of neuron projection development240/8552445/187232.48e-041.53e-03240
GO:003432918EsophagusESCCcell junction assembly227/8552420/187233.06e-041.83e-03227
GO:001076920EsophagusESCCregulation of cell morphogenesis involved in differentiation61/855296/187233.12e-041.85e-0361
GO:00519606EsophagusESCCregulation of nervous system development237/8552443/187235.02e-042.78e-03237
GO:001077018EsophagusESCCpositive regulation of cell morphogenesis involved in differentiation51/855279/187235.48e-043.00e-0351
GO:00519625EsophagusESCCpositive regulation of nervous system development149/8552272/187231.50e-037.06e-03149
GO:006053716EsophagusESCCmuscle tissue development211/8552403/187233.84e-031.56e-02211
Page: 1 2 3 4 5 6 7 8 9 10 

check button Enriched KEGG pathways.
Pathway IDTissueDisease StageDescriptionGene RatioBg Ratiopvaluep.adjustqvalueCount
Page: 1 

Top

Cell-cell communication analysis

check buttonIdentification of potential cell-cell interactions between two cell types and their ligand-receptor pairs for different disease states
LigandReceptorLRpairPathwayTissueDisease Stage
Page: 1 

Top

Single-cell gene regulatory network inference analysis

check buttonFind out the significant the regulons (TFs) and the target genes of each regulon across cell types for different disease states
TFCell TypeTissueDisease StageTarget GeneRSSRegulon Activity
∗The dot plots of a searched regulon are shown for all cell subpopulations in each disease state of each tissue based on the regulon specific score inferred using pySCENIC and by calculating the average expression.
Page: 1 

Top

Somatic mutation of malignant transformation related genes

check buttonAnnotation of somatic variants for genes involved in malignant transformation
Hugo SymbolVariant ClassVariant ClassificationdbSNP RSHGVScHGVSpHGVSp ShortSWISSPROTBIOTYPESIFTPolyPhenTumor Sample BarcodeTissueHistologySexAgeStageTherapy TypesDrugsOutcome
OBSL1SNVMissense_Mutationc.2265G>Tp.Lys755Asnp.K755NO75147protein_codingtolerated(0.28)benign(0.142)TCGA-A1-A0SI-01Breastbreast invasive carcinomaFemale<65I/IIUnknownUnknownSD
OBSL1SNVMissense_Mutationnovelc.1249N>Gp.Arg417Glyp.R417GO75147protein_codingdeleterious(0)probably_damaging(0.999)TCGA-A2-A3Y0-01Breastbreast invasive carcinomaFemale<65I/IIChemotherapyadriamycinCR
OBSL1SNVMissense_Mutationrs768834976c.2161N>Ap.Gln721Lysp.Q721KO75147protein_codingdeleterious(0.02)benign(0.007)TCGA-A7-A0DB-01Breastbreast invasive carcinomaFemale<65I/IIHormone TherapyarimidexSD
OBSL1SNVMissense_Mutationc.2407N>Ap.Asp803Asnp.D803NO75147protein_codingdeleterious(0)possibly_damaging(0.9)TCGA-AC-A23H-01Breastbreast invasive carcinomaFemale>=65I/IIUnknownUnknownPD
OBSL1SNVMissense_Mutationrs757910265c.3254N>Ap.Ala1085Glup.A1085EO75147protein_codingtolerated(0.99)possibly_damaging(0.741)TCGA-AC-A2QJ-01Breastbreast invasive carcinomaFemale<65III/IVChemotherapycytoxanPD
OBSL1SNVMissense_Mutationrs757910265c.3254N>Ap.Ala1085Glup.A1085EO75147protein_codingtolerated(0.99)possibly_damaging(0.741)TCGA-AC-A3QP-01Breastbreast invasive carcinomaFemale>=65I/IIHormone TherapyfemaraSD
OBSL1SNVMissense_Mutationrs765704645c.4766C>Tp.Ser1589Leup.S1589LO75147protein_codingtolerated(0.05)benign(0.021)TCGA-AC-A6IV-01Breastbreast invasive carcinomaFemale<65I/IIUnknownUnknownSD
OBSL1SNVMissense_Mutationc.4189N>Ap.Ala1397Thrp.A1397TO75147protein_codingtolerated(0.51)benign(0.01)TCGA-AN-A0AK-01Breastbreast invasive carcinomaFemale>=65I/IIUnknownUnknownSD
OBSL1SNVMissense_Mutationnovelc.2329G>Cp.Glu777Glnp.E777QO75147protein_codingtolerated(0.11)benign(0.328)TCGA-BH-A0H5-01Breastbreast invasive carcinomaFemale<65I/IIChemotherapycytoxanCR
OBSL1SNVMissense_Mutationrs757910265c.3254N>Ap.Ala1085Glup.A1085EO75147protein_codingtolerated(0.99)possibly_damaging(0.741)TCGA-BH-A5J0-01Breastbreast invasive carcinomaFemale<65I/IIUnknownUnknownSD
Page: 1 2 3 4 5 6 7 8 9 10 11 12 13 14 15 16 17 18 19 

Top

Related drugs of malignant transformation related genes

check buttonIdentification of chemicals and drugs interact with genes involved in malignant transfromation
(DGIdb 4.0)
Entrez IDSymbolCategoryInteraction TypesDrug Claim NameDrug NamePMIDs
Page: 1