
|
|||||
|
 | |
| |
| |
| |
| |
| |
|
Gene: OAT |
Gene summary for OAT |
| Gene information | Species | Human | Gene symbol | OAT | Gene ID | 4942 |
| Gene name | ornithine aminotransferase | |
| Gene Alias | GACR | |
| Cytomap | 10q26.13 | |
| Gene Type | protein-coding | GO ID | GO:0003008 | UniProtAcc | A0A140VJQ4 |
Top |
Malignant transformation analysis |
| Identification of the aberrant gene expression in precancerous and cancerous lesions by comparing the gene expression of stem-like cells in diseased tissues with normal stem cells |
| Entrez ID | Symbol | Replicates | Species | Organ | Tissue | Adj P-value | Log2FC | Malignancy |
| 4942 | OAT | GSM4909281 | Human | Breast | IDC | 1.47e-10 | 4.64e-01 | 0.21 |
| 4942 | OAT | GSM4909285 | Human | Breast | IDC | 1.02e-02 | 1.93e-01 | 0.21 |
| 4942 | OAT | GSM4909286 | Human | Breast | IDC | 3.59e-06 | -2.34e-01 | 0.1081 |
| 4942 | OAT | GSM4909293 | Human | Breast | IDC | 3.75e-02 | 1.29e-01 | 0.1581 |
| 4942 | OAT | GSM4909296 | Human | Breast | IDC | 1.20e-11 | -3.46e-01 | 0.1524 |
| 4942 | OAT | GSM4909297 | Human | Breast | IDC | 6.92e-13 | -1.28e-01 | 0.1517 |
| 4942 | OAT | GSM4909301 | Human | Breast | IDC | 3.92e-06 | -3.32e-01 | 0.1577 |
| 4942 | OAT | GSM4909304 | Human | Breast | IDC | 1.60e-03 | -2.78e-01 | 0.1636 |
| 4942 | OAT | GSM4909307 | Human | Breast | IDC | 3.05e-02 | -2.60e-01 | 0.1569 |
| 4942 | OAT | GSM4909311 | Human | Breast | IDC | 1.03e-30 | -4.27e-01 | 0.1534 |
| 4942 | OAT | GSM4909312 | Human | Breast | IDC | 1.01e-10 | -5.33e-02 | 0.1552 |
| 4942 | OAT | GSM4909315 | Human | Breast | IDC | 1.56e-06 | -3.51e-01 | 0.21 |
| 4942 | OAT | GSM4909319 | Human | Breast | IDC | 4.08e-38 | -2.95e-01 | 0.1563 |
| 4942 | OAT | GSM4909320 | Human | Breast | IDC | 8.27e-03 | -4.42e-01 | 0.1575 |
| 4942 | OAT | GSM4909321 | Human | Breast | IDC | 1.21e-17 | -2.75e-01 | 0.1559 |
| 4942 | OAT | brca10 | Human | Breast | Precancer | 3.00e-11 | -4.93e-01 | -0.0029 |
| 4942 | OAT | NCCBC14 | Human | Breast | DCIS | 1.34e-02 | -9.08e-03 | 0.2021 |
| 4942 | OAT | NCCBC5 | Human | Breast | DCIS | 3.50e-06 | -3.44e-01 | 0.2046 |
| 4942 | OAT | P1 | Human | Breast | IDC | 2.52e-14 | -2.15e-01 | 0.1527 |
| 4942 | OAT | DCIS2 | Human | Breast | DCIS | 9.37e-68 | 1.72e-01 | 0.0085 |
| Page: 1 2 3 4 5 6 7 8 9 |
| Tissue | Expression Dynamics | Abbreviation |
| Breast | 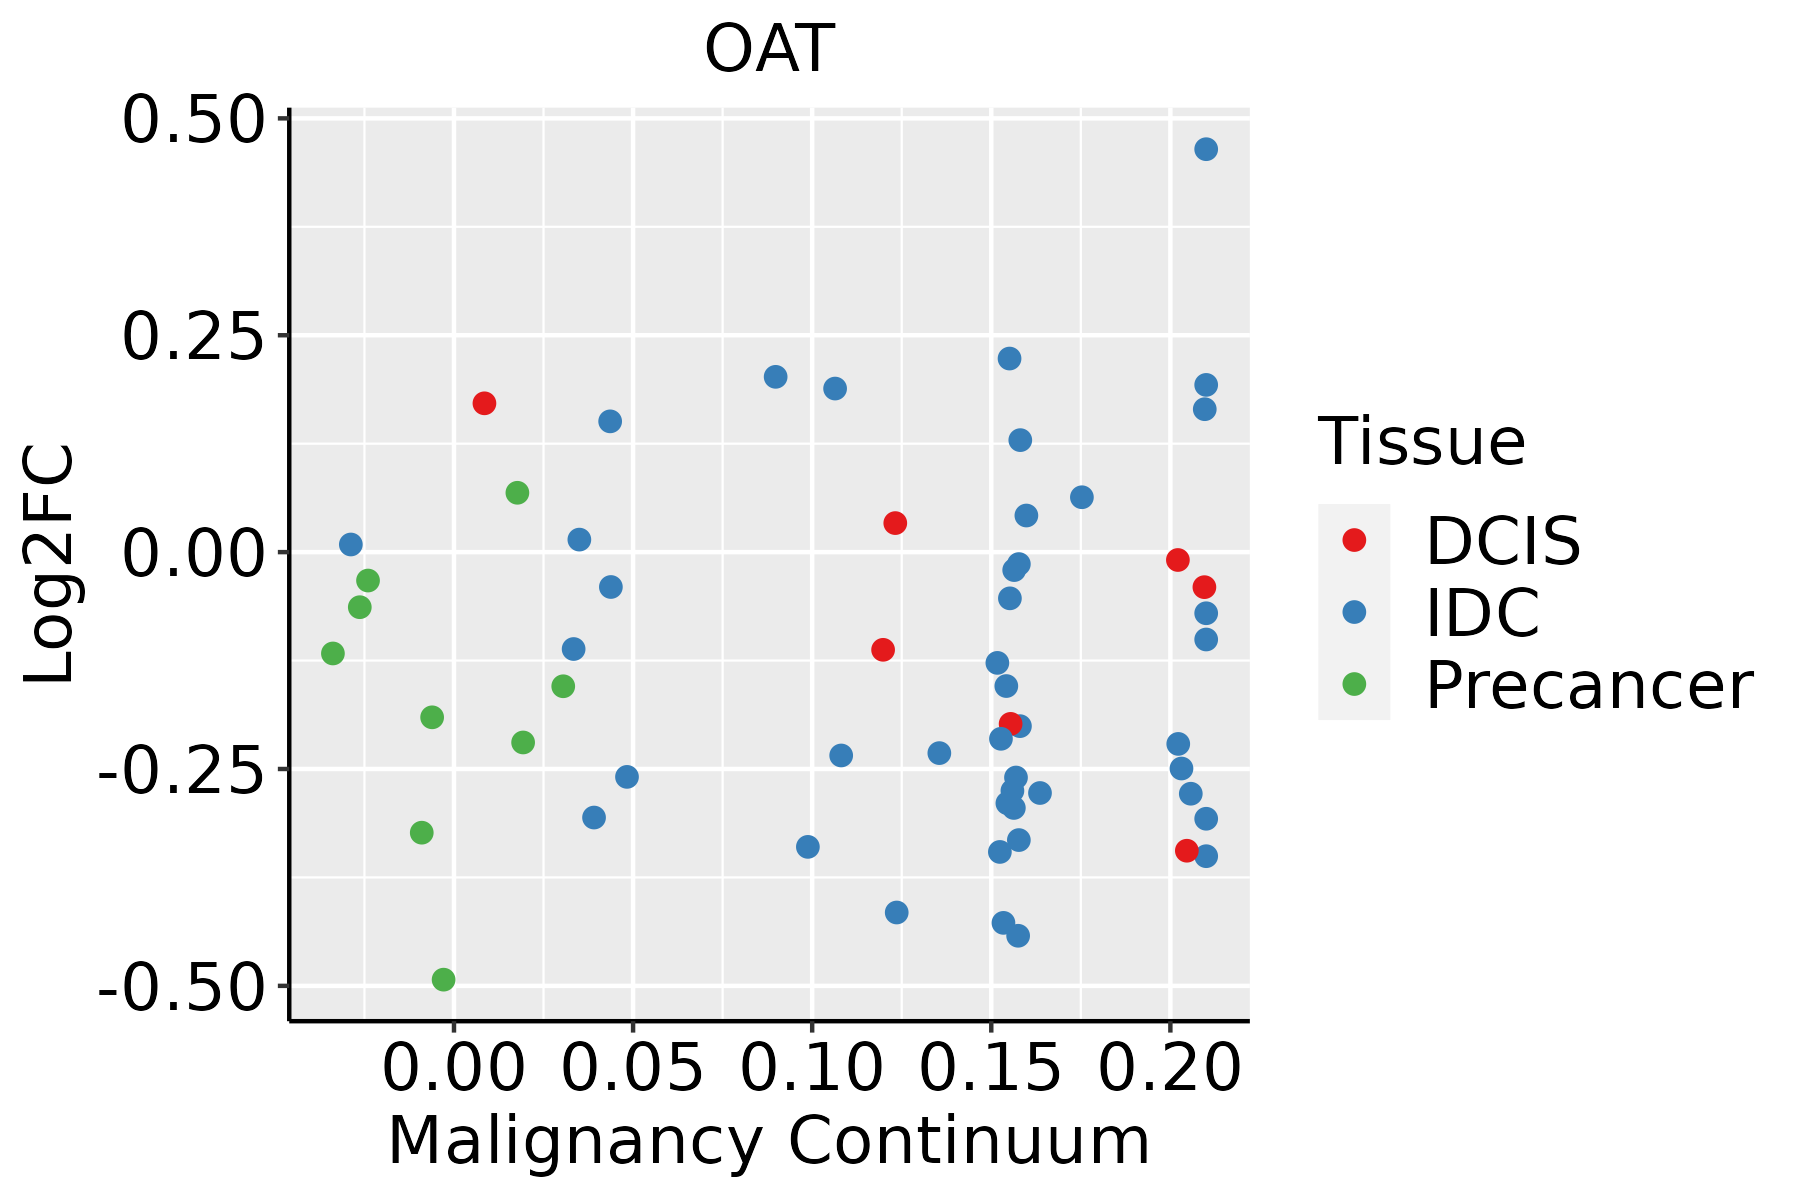 | IDC: Invasive ductal carcinoma |
| DCIS: Ductal carcinoma in situ | ||
| Precancer(BRCA1-mut): Precancerous lesion from BRCA1 mutation carriers | ||
| Colorectum (GSE201348) |  | FAP: Familial adenomatous polyposis |
| CRC: Colorectal cancer | ||
| Colorectum (HTA11) | 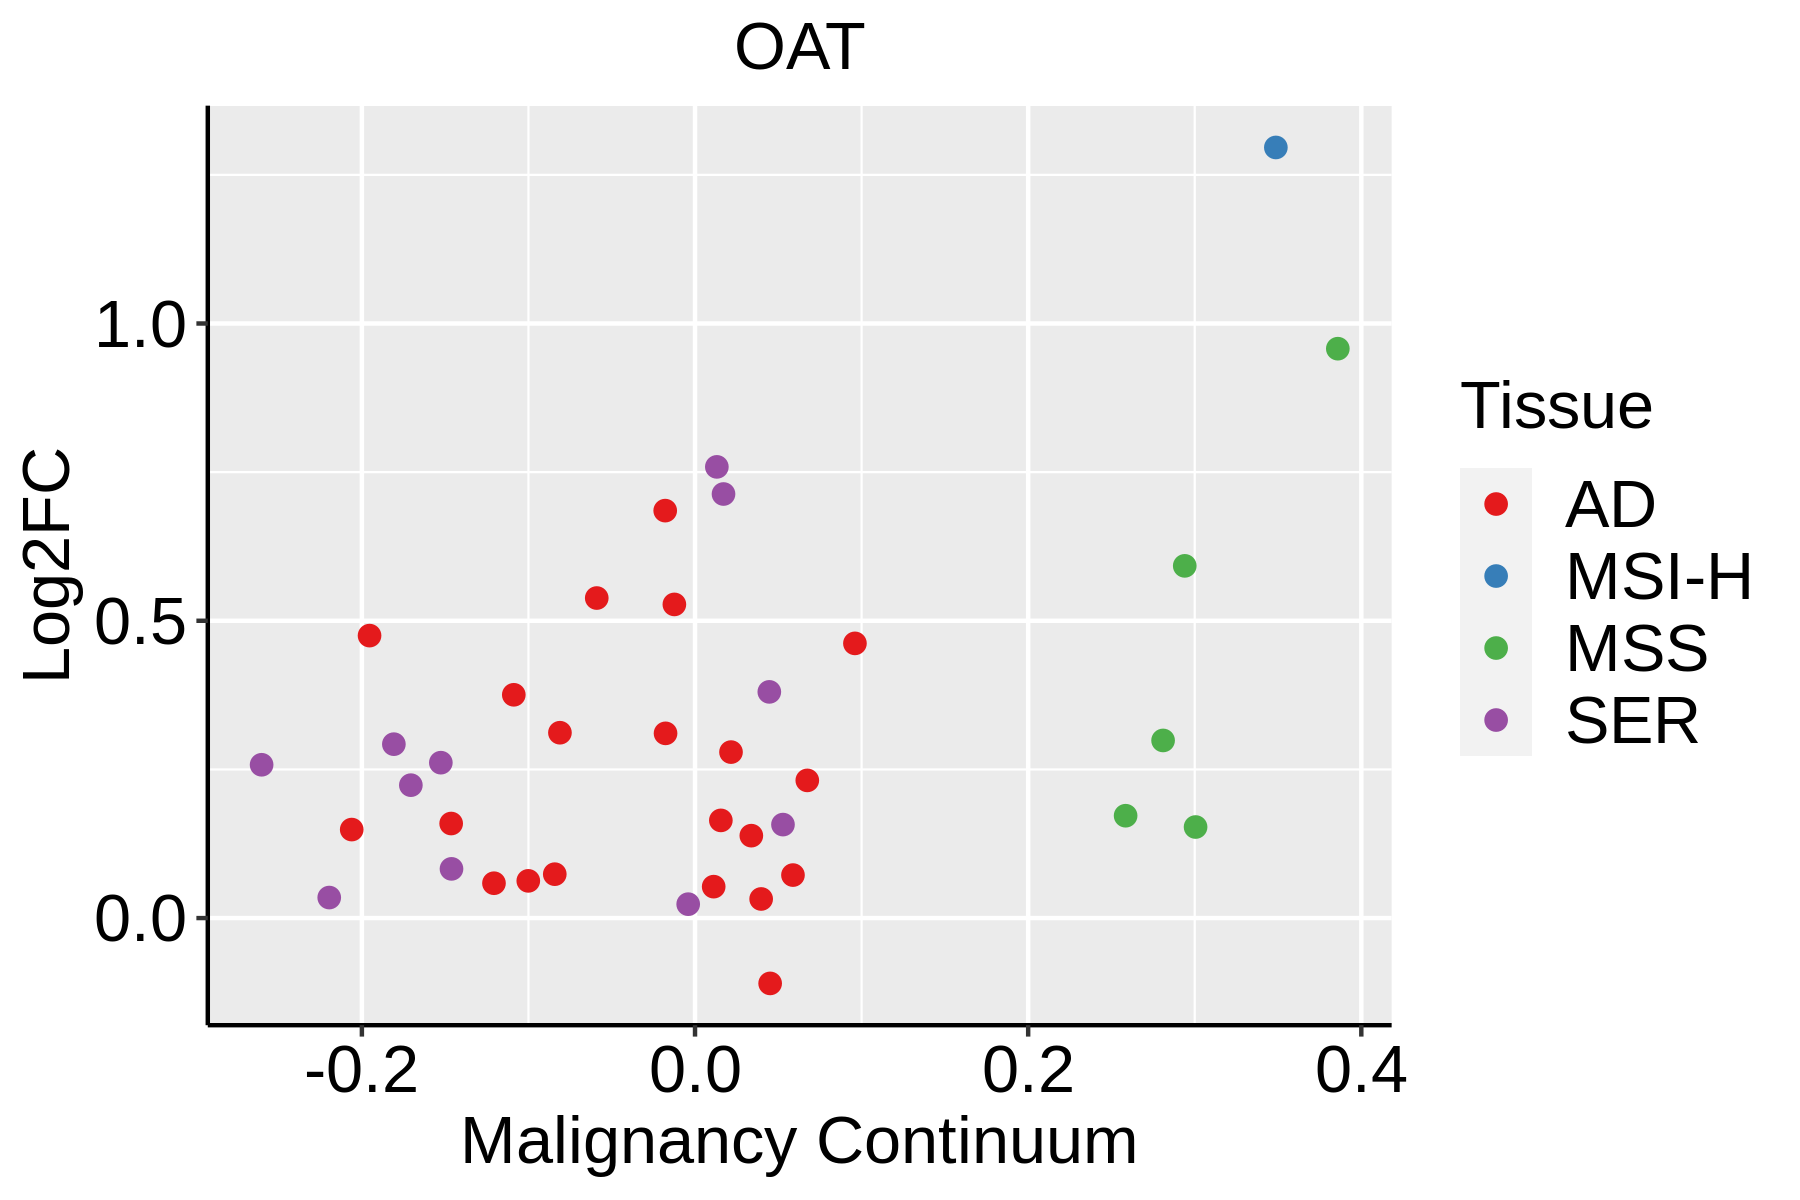 | AD: Adenomas |
| SER: Sessile serrated lesions | ||
| MSI-H: Microsatellite-high colorectal cancer | ||
| MSS: Microsatellite stable colorectal cancer | ||
| Esophagus | 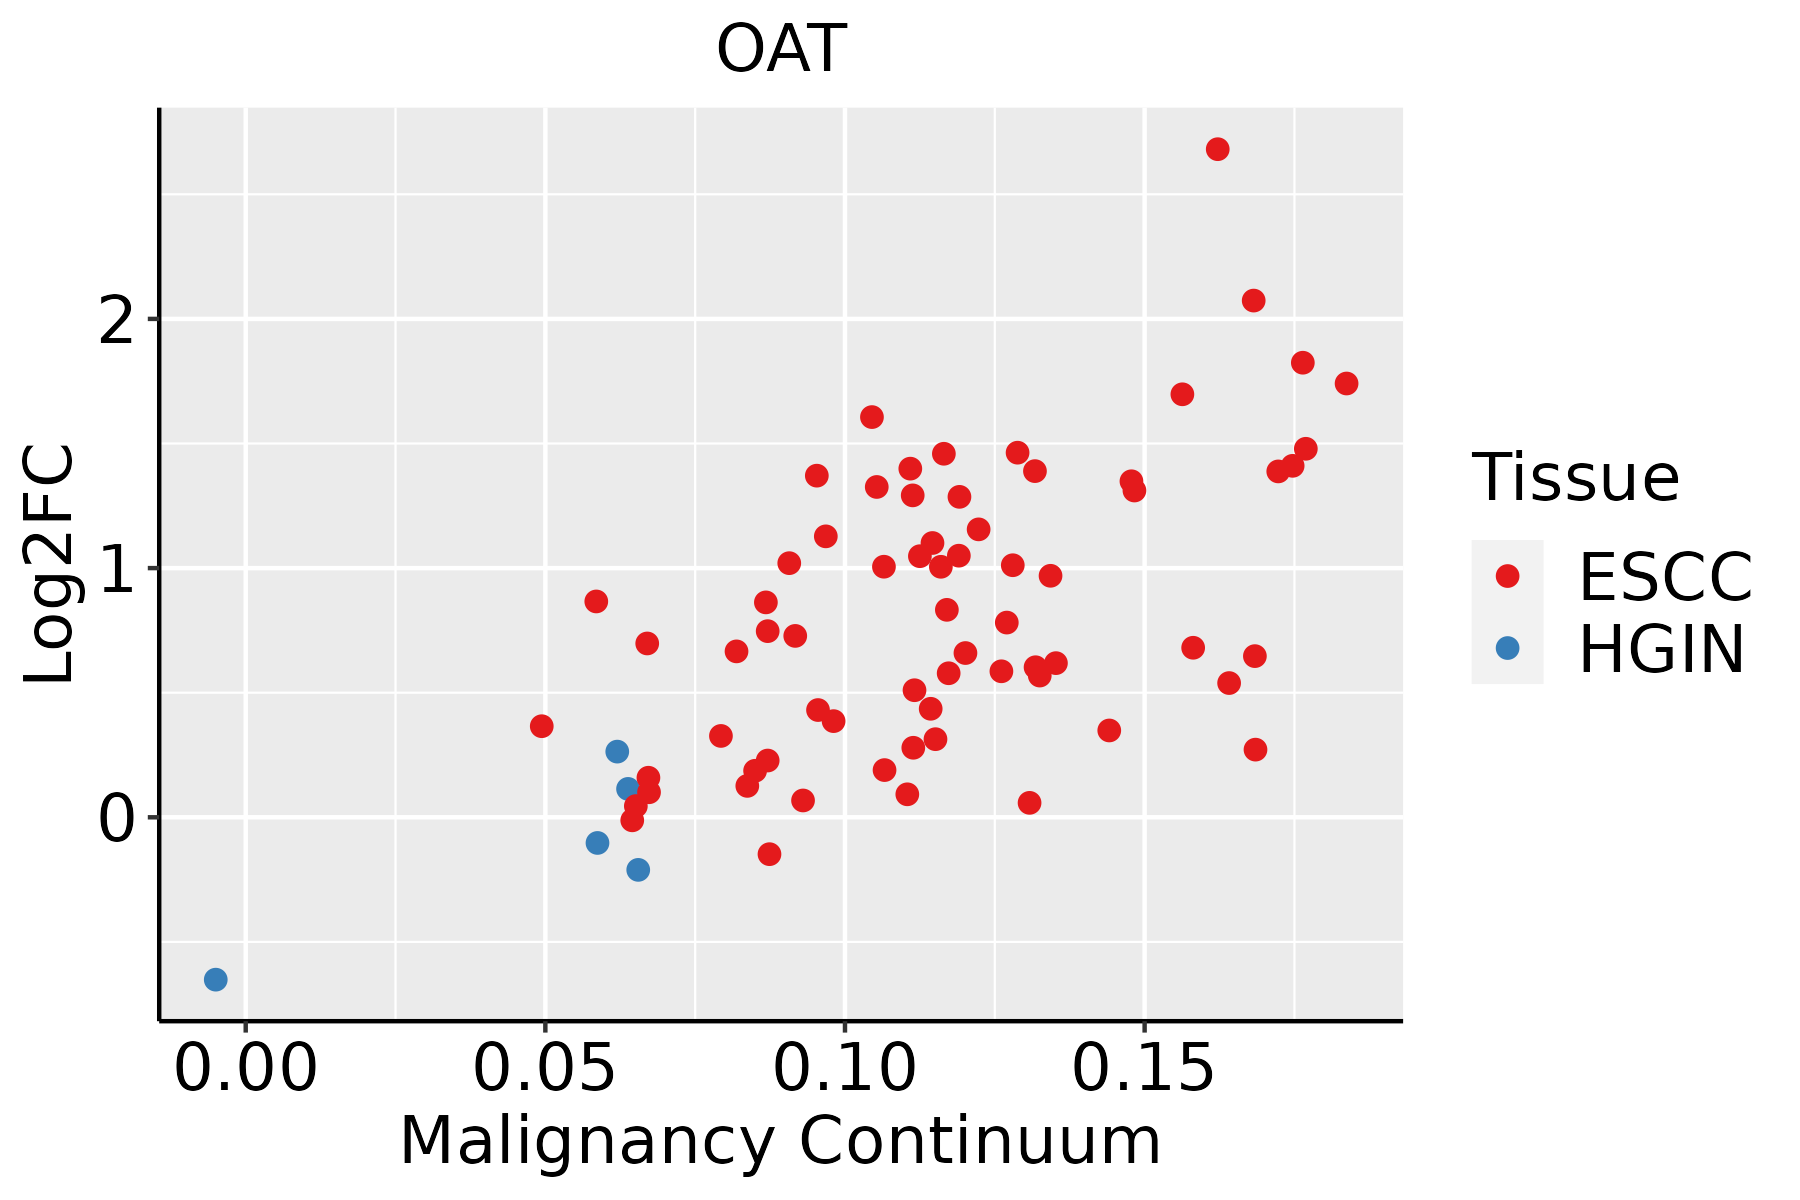 | ESCC: Esophageal squamous cell carcinoma |
| HGIN: High-grade intraepithelial neoplasias | ||
| LGIN: Low-grade intraepithelial neoplasias | ||
| GC |  | CAG: Chronic atrophic gastritis |
| CAG with IM: Chronic atrophic gastritis with intestinal metaplasia | ||
| CSG: Chronic superficial gastritis | ||
| GC: Gastric cancer | ||
| SIM: Severe intestinal metaplasia | ||
| WIM: Wild intestinal metaplasia | ||
| Liver |  | HCC: Hepatocellular carcinoma |
| NAFLD: Non-alcoholic fatty liver disease | ||
| Oral Cavity | 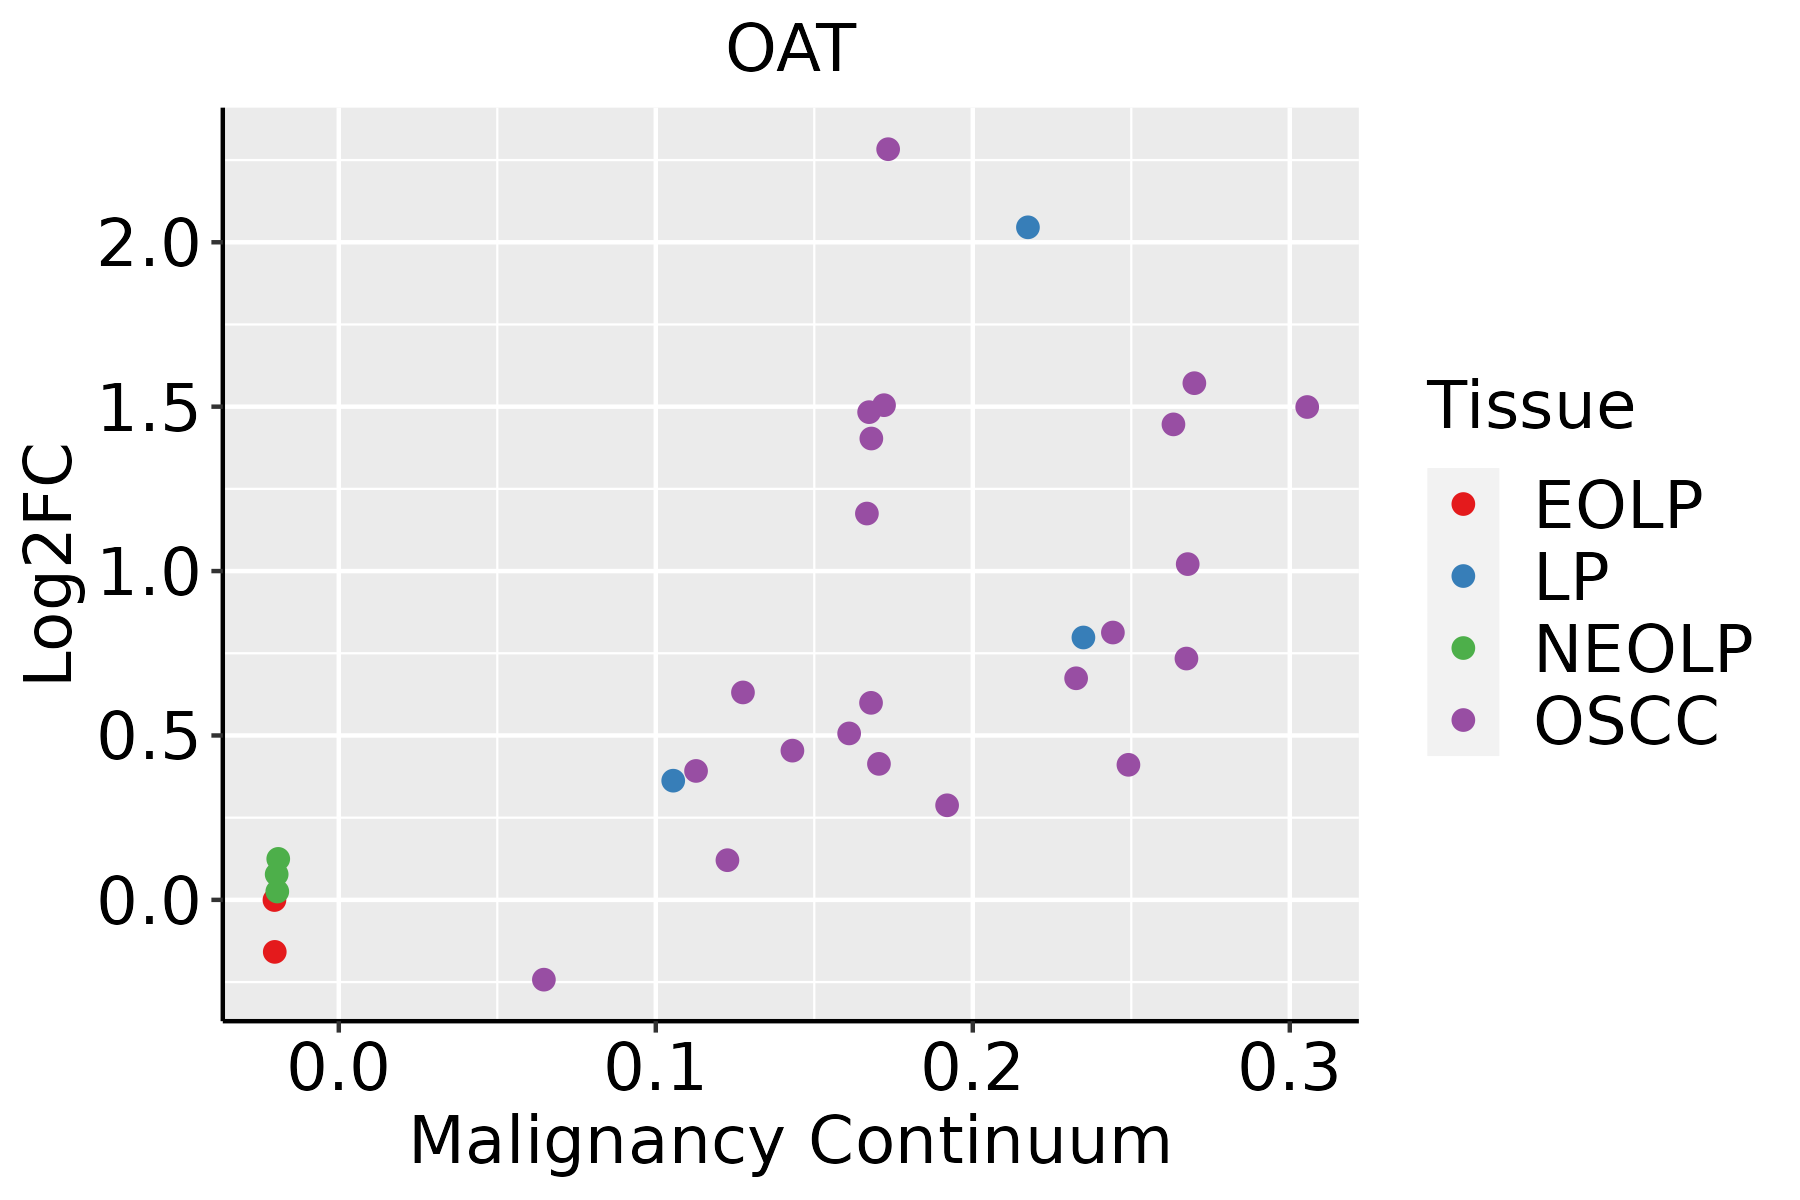 | EOLP: Erosive Oral lichen planus |
| LP: leukoplakia | ||
| NEOLP: Non-erosive oral lichen planus | ||
| OSCC: Oral squamous cell carcinoma | ||
| Prostate | 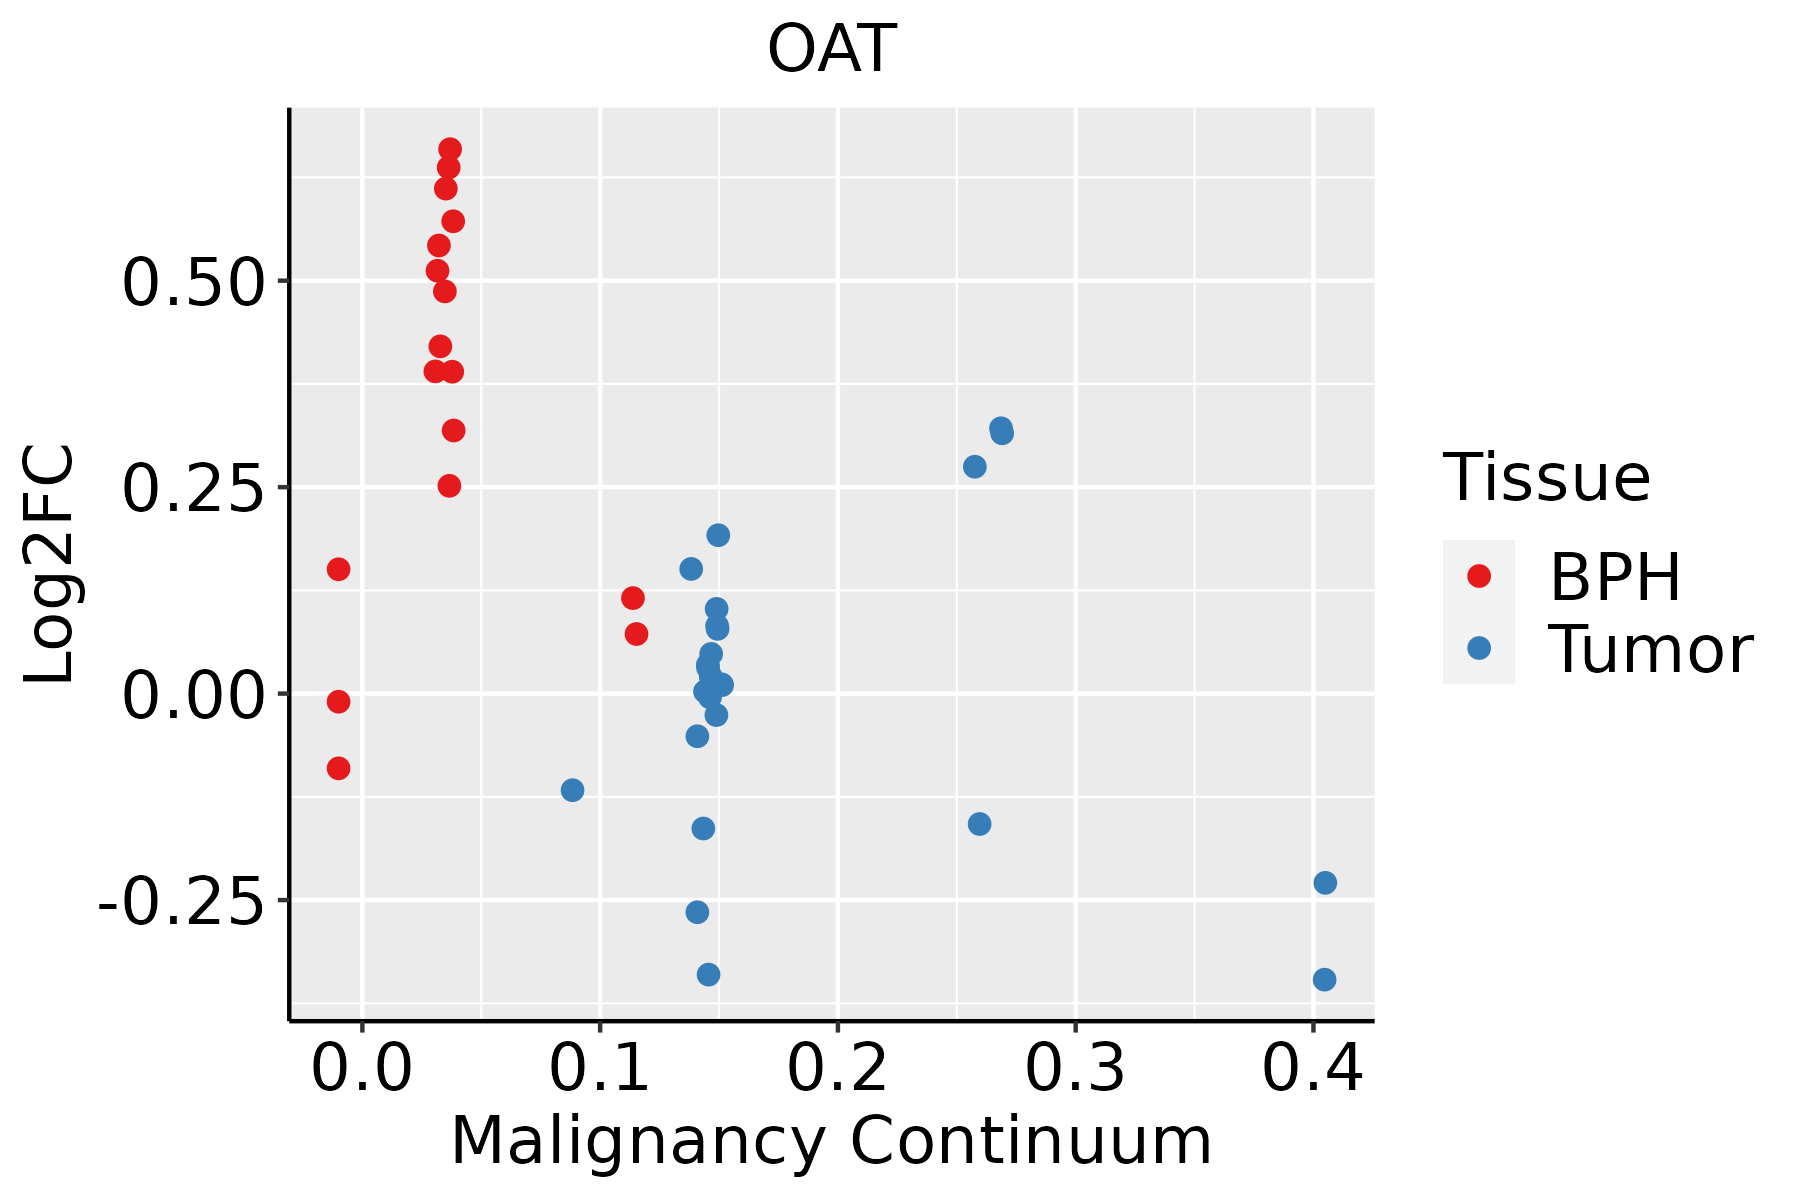 | BPH: Benign Prostatic Hyperplasia |
| Skin |  | AK: Actinic keratosis |
| cSCC: Cutaneous squamous cell carcinoma | ||
| SCCIS:squamous cell carcinoma in situ | ||
| Thyroid | 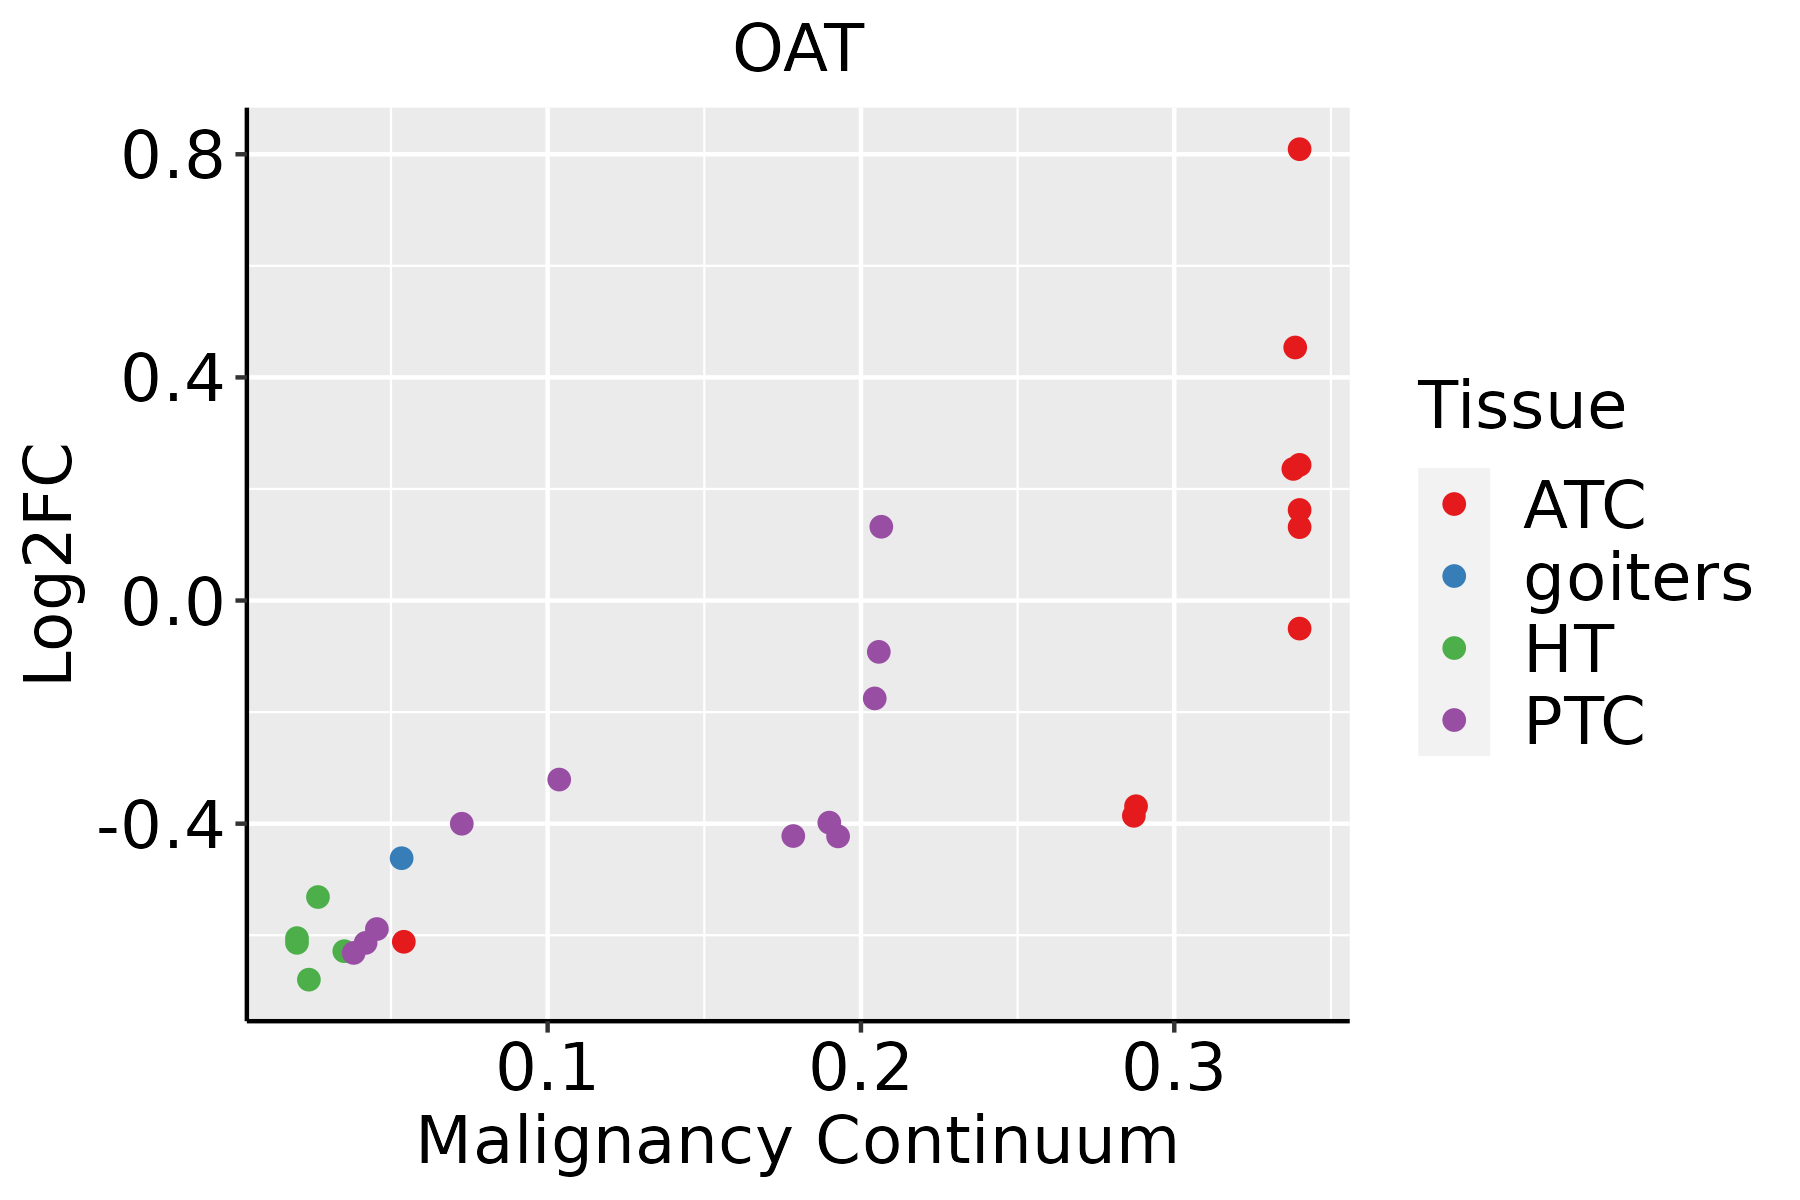 | ATC: Anaplastic thyroid cancer |
| HT: Hashimoto's thyroiditis | ||
| PTC: Papillary thyroid cancer |
| ∗log2FC in expression of this searched gene in stem-like cells from each diseased tissue sample relative to stem-like cells in normal samples in each tissue plotted against the malignancy continuum. Samples are colored based on if they are from different disease stage. |
Top |
Malignant transformation related pathway analysis |
| Find out the enriched GO biological processes and KEGG pathways involved in transition from healthy to precancer to cancer |
| Tissue | Disease Stage | Enriched GO biological Processes |
| Colorectum | AD |  |
| Colorectum | SER |  |
| Colorectum | MSS |  |
| Colorectum | MSI-H |  |
| Colorectum | FAP |  |
| ∗Top 15 enriched GO BP terms are showed in the bar plot of each disease state in each tissue. Each row represents a significant GO biological process which is colored according to the -log10(p.adjust). |
| Page: 1 2 3 4 5 6 7 8 9 |
| GO ID | Tissue | Disease Stage | Description | Gene Ratio | Bg Ratio | pvalue | p.adjust | Count |
| GO:00463946 | Breast | Precancer | carboxylic acid biosynthetic process | 32/1080 | 314/18723 | 1.30e-03 | 1.38e-02 | 32 |
| GO:00160536 | Breast | Precancer | organic acid biosynthetic process | 32/1080 | 316/18723 | 1.44e-03 | 1.50e-02 | 32 |
| GO:001605313 | Breast | IDC | organic acid biosynthetic process | 39/1434 | 316/18723 | 2.13e-03 | 1.99e-02 | 39 |
| GO:004639413 | Breast | IDC | carboxylic acid biosynthetic process | 38/1434 | 314/18723 | 3.39e-03 | 2.83e-02 | 38 |
| GO:001605322 | Breast | DCIS | organic acid biosynthetic process | 38/1390 | 316/18723 | 2.22e-03 | 2.04e-02 | 38 |
| GO:004639422 | Breast | DCIS | carboxylic acid biosynthetic process | 37/1390 | 314/18723 | 3.56e-03 | 2.92e-02 | 37 |
| GO:00065755 | Cervix | HSIL_HPV | cellular modified amino acid metabolic process | 16/737 | 188/18723 | 3.18e-03 | 2.89e-02 | 16 |
| GO:0044282 | Colorectum | AD | small molecule catabolic process | 118/3918 | 376/18723 | 1.05e-06 | 3.55e-05 | 118 |
| GO:0030258 | Colorectum | AD | lipid modification | 67/3918 | 212/18723 | 1.66e-04 | 2.27e-03 | 67 |
| GO:0016054 | Colorectum | AD | organic acid catabolic process | 73/3918 | 240/18723 | 3.20e-04 | 3.81e-03 | 73 |
| GO:0006575 | Colorectum | AD | cellular modified amino acid metabolic process | 59/3918 | 188/18723 | 4.80e-04 | 5.27e-03 | 59 |
| GO:0043648 | Colorectum | AD | dicarboxylic acid metabolic process | 34/3918 | 96/18723 | 7.22e-04 | 7.28e-03 | 34 |
| GO:0046395 | Colorectum | AD | carboxylic acid catabolic process | 70/3918 | 236/18723 | 9.06e-04 | 8.71e-03 | 70 |
| GO:0006520 | Colorectum | AD | cellular amino acid metabolic process | 81/3918 | 284/18723 | 1.37e-03 | 1.19e-02 | 81 |
| GO:0006650 | Colorectum | AD | glycerophospholipid metabolic process | 83/3918 | 306/18723 | 5.40e-03 | 3.55e-02 | 83 |
| GO:0006644 | Colorectum | AD | phospholipid metabolic process | 101/3918 | 383/18723 | 5.80e-03 | 3.67e-02 | 101 |
| GO:0045017 | Colorectum | AD | glycerolipid biosynthetic process | 69/3918 | 252/18723 | 8.33e-03 | 4.88e-02 | 69 |
| GO:00442821 | Colorectum | SER | small molecule catabolic process | 87/2897 | 376/18723 | 5.31e-05 | 1.27e-03 | 87 |
| GO:0046486 | Colorectum | SER | glycerolipid metabolic process | 82/2897 | 392/18723 | 2.26e-03 | 2.17e-02 | 82 |
| GO:00066441 | Colorectum | SER | phospholipid metabolic process | 79/2897 | 383/18723 | 3.94e-03 | 3.24e-02 | 79 |
| Page: 1 2 3 4 5 6 7 8 9 10 11 12 13 |
| Pathway ID | Tissue | Disease Stage | Description | Gene Ratio | Bg Ratio | pvalue | p.adjust | qvalue | Count |
| hsa00330 | Colorectum | AD | Arginine and proline metabolism | 23/2092 | 50/8465 | 8.27e-04 | 5.90e-03 | 3.76e-03 | 23 |
| hsa003301 | Colorectum | AD | Arginine and proline metabolism | 23/2092 | 50/8465 | 8.27e-04 | 5.90e-03 | 3.76e-03 | 23 |
| hsa003302 | Colorectum | SER | Arginine and proline metabolism | 17/1580 | 50/8465 | 7.12e-03 | 3.77e-02 | 2.74e-02 | 17 |
| hsa003303 | Colorectum | SER | Arginine and proline metabolism | 17/1580 | 50/8465 | 7.12e-03 | 3.77e-02 | 2.74e-02 | 17 |
| hsa003304 | Colorectum | MSS | Arginine and proline metabolism | 23/1875 | 50/8465 | 1.52e-04 | 1.24e-03 | 7.61e-04 | 23 |
| hsa003305 | Colorectum | MSS | Arginine and proline metabolism | 23/1875 | 50/8465 | 1.52e-04 | 1.24e-03 | 7.61e-04 | 23 |
| hsa0033021 | Liver | HCC | Arginine and proline metabolism | 33/4020 | 50/8465 | 6.28e-03 | 1.77e-02 | 9.83e-03 | 33 |
| hsa0033031 | Liver | HCC | Arginine and proline metabolism | 33/4020 | 50/8465 | 6.28e-03 | 1.77e-02 | 9.83e-03 | 33 |
| hsa0033010 | Oral cavity | OSCC | Arginine and proline metabolism | 30/3704 | 50/8465 | 1.50e-02 | 3.26e-02 | 1.66e-02 | 30 |
| hsa0033013 | Oral cavity | OSCC | Arginine and proline metabolism | 30/3704 | 50/8465 | 1.50e-02 | 3.26e-02 | 1.66e-02 | 30 |
| hsa0033023 | Oral cavity | LP | Arginine and proline metabolism | 26/2418 | 50/8465 | 3.94e-04 | 2.08e-03 | 1.34e-03 | 26 |
| hsa0033033 | Oral cavity | LP | Arginine and proline metabolism | 26/2418 | 50/8465 | 3.94e-04 | 2.08e-03 | 1.34e-03 | 26 |
| hsa003309 | Prostate | BPH | Arginine and proline metabolism | 18/1718 | 50/8465 | 7.17e-03 | 2.32e-02 | 1.43e-02 | 18 |
| hsa0033012 | Prostate | BPH | Arginine and proline metabolism | 18/1718 | 50/8465 | 7.17e-03 | 2.32e-02 | 1.43e-02 | 18 |
| hsa0033022 | Prostate | Tumor | Arginine and proline metabolism | 19/1791 | 50/8465 | 4.73e-03 | 1.67e-02 | 1.03e-02 | 19 |
| hsa0033032 | Prostate | Tumor | Arginine and proline metabolism | 19/1791 | 50/8465 | 4.73e-03 | 1.67e-02 | 1.03e-02 | 19 |
| Page: 1 |
Top |
Cell-cell communication analysis |
| Identification of potential cell-cell interactions between two cell types and their ligand-receptor pairs for different disease states |
| Ligand | Receptor | LRpair | Pathway | Tissue | Disease Stage |
| Page: 1 |
Top |
Single-cell gene regulatory network inference analysis |
| Find out the significant the regulons (TFs) and the target genes of each regulon across cell types for different disease states |
| TF | Cell Type | Tissue | Disease Stage | Target Gene | RSS | Regulon Activity |
| ∗The dot plots of a searched regulon are shown for all cell subpopulations in each disease state of each tissue based on the regulon specific score inferred using pySCENIC and by calculating the average expression. |
| Page: 1 |
Top |
Somatic mutation of malignant transformation related genes |
| Annotation of somatic variants for genes involved in malignant transformation |
| Hugo Symbol | Variant Class | Variant Classification | dbSNP RS | HGVSc | HGVSp | HGVSp Short | SWISSPROT | BIOTYPE | SIFT | PolyPhen | Tumor Sample Barcode | Tissue | Histology | Sex | Age | Stage | Therapy Types | Drugs | Outcome |
| OAT | SNV | Missense_Mutation | novel | c.310C>G | p.Gln104Glu | p.Q104E | P04181 | protein_coding | deleterious(0) | probably_damaging(1) | TCGA-E9-A3QA-01 | Breast | breast invasive carcinoma | Female | <65 | I/II | Unknown | Unknown | SD |
| OAT | SNV | Missense_Mutation | novel | c.989N>A | p.Cys330Tyr | p.C330Y | P04181 | protein_coding | deleterious(0) | probably_damaging(0.954) | TCGA-PE-A5DC-01 | Breast | breast invasive carcinoma | Female | >=65 | III/IV | Unknown | Unknown | SD |
| OAT | insertion | In_Frame_Ins | novel | c.842_843insTTGTTT | p.Glu281delinsAspCysLeu | p.E281delinsDCL | P04181 | protein_coding | TCGA-A8-A09C-01 | Breast | breast invasive carcinoma | Female | >=65 | I/II | Unknown | Unknown | SD | ||
| OAT | deletion | Frame_Shift_Del | novel | c.841delN | p.Glu281LysfsTer7 | p.E281Kfs*7 | P04181 | protein_coding | TCGA-A8-A09C-01 | Breast | breast invasive carcinoma | Female | >=65 | I/II | Unknown | Unknown | SD | ||
| OAT | SNV | Missense_Mutation | rs763064048 | c.1111G>A | p.Val371Ile | p.V371I | P04181 | protein_coding | tolerated(0.11) | benign(0.101) | TCGA-2W-A8YY-01 | Cervix | cervical & endocervical cancer | Female | <65 | I/II | Chemotherapy | cisplatin | CR |
| OAT | SNV | Missense_Mutation | rs121965054 | c.1180T>C | p.Cys394Arg | p.C394R | P04181 | protein_coding | tolerated(0.06) | benign(0.291) | TCGA-AD-6964-01 | Colorectum | colon adenocarcinoma | Male | <65 | III/IV | Chemotherapy | folfox | PD |
| OAT | SNV | Missense_Mutation | rs121965044 | c.1250N>T | p.Pro417Leu | p.P417L | P04181 | protein_coding | deleterious(0) | probably_damaging(1) | TCGA-AZ-4615-01 | Colorectum | colon adenocarcinoma | Male | >=65 | III/IV | Chemotherapy | xeloda | PD |
| OAT | SNV | Missense_Mutation | c.1022N>G | p.Glu341Gly | p.E341G | P04181 | protein_coding | tolerated(0.13) | benign(0.38) | TCGA-AG-A002-01 | Colorectum | rectum adenocarcinoma | Male | <65 | I/II | Unknown | Unknown | SD | |
| OAT | SNV | Missense_Mutation | novel | c.965N>T | p.Thr322Ile | p.T322I | P04181 | protein_coding | deleterious(0) | probably_damaging(0.978) | TCGA-A5-A0G1-01 | Endometrium | uterine corpus endometrioid carcinoma | Female | >=65 | I/II | Unknown | Unknown | SD |
| OAT | SNV | Missense_Mutation | rs1804030 | c.460N>T | p.Arg154Cys | p.R154C | P04181 | protein_coding | deleterious(0) | probably_damaging(0.999) | TCGA-A5-A0G2-01 | Endometrium | uterine corpus endometrioid carcinoma | Female | <65 | III/IV | Unknown | Unknown | SD |
| Page: 1 2 3 4 |
Top |
Related drugs of malignant transformation related genes |
| Identification of chemicals and drugs interact with genes involved in malignant transfromation |
| (DGIdb 4.0) |
| Entrez ID | Symbol | Category | Interaction Types | Drug Claim Name | Drug Name | PMIDs |
| 4942 | OAT | ENZYME, DRUGGABLE GENOME | GABACULINE | GABACULINE | 26288681 |
| Page: 1 |

Copyright 2023-Present -The University of Texas Health Science Center at Houston |