
|
|||||
|
 | |
| |
| |
| |
| |
| |
|
Gene: OASL |
Gene summary for OASL |
| Gene information | Species | Human | Gene symbol | OASL | Gene ID | 8638 |
| Gene name | 2'-5'-oligoadenylate synthetase like | |
| Gene Alias | OASL1 | |
| Cytomap | 12q24.31 | |
| Gene Type | protein-coding | GO ID | GO:0002221 | UniProtAcc | Q15646 |
Top |
Malignant transformation analysis |
| Identification of the aberrant gene expression in precancerous and cancerous lesions by comparing the gene expression of stem-like cells in diseased tissues with normal stem cells |
| Entrez ID | Symbol | Replicates | Species | Organ | Tissue | Adj P-value | Log2FC | Malignancy |
| 8638 | OASL | LZE24T | Human | Esophagus | ESCC | 3.51e-12 | 1.17e+00 | 0.0596 |
| 8638 | OASL | LZE6T | Human | Esophagus | ESCC | 1.45e-13 | 5.32e-01 | 0.0845 |
| 8638 | OASL | P1T-E | Human | Esophagus | ESCC | 1.82e-03 | 6.32e-01 | 0.0875 |
| 8638 | OASL | P2T-E | Human | Esophagus | ESCC | 7.22e-17 | 1.13e+00 | 0.1177 |
| 8638 | OASL | P5T-E | Human | Esophagus | ESCC | 2.46e-09 | 6.68e-01 | 0.1327 |
| 8638 | OASL | P11T-E | Human | Esophagus | ESCC | 5.36e-11 | 7.47e-01 | 0.1426 |
| 8638 | OASL | P20T-E | Human | Esophagus | ESCC | 1.41e-12 | 2.70e+00 | 0.1124 |
| 8638 | OASL | P21T-E | Human | Esophagus | ESCC | 5.64e-10 | 1.05e+00 | 0.1617 |
| 8638 | OASL | P23T-E | Human | Esophagus | ESCC | 9.08e-11 | 5.22e-01 | 0.108 |
| 8638 | OASL | P24T-E | Human | Esophagus | ESCC | 7.39e-23 | 1.10e+00 | 0.1287 |
| 8638 | OASL | P31T-E | Human | Esophagus | ESCC | 1.12e-26 | 1.64e+00 | 0.1251 |
| 8638 | OASL | P36T-E | Human | Esophagus | ESCC | 5.40e-12 | 5.71e-01 | 0.1187 |
| 8638 | OASL | P37T-E | Human | Esophagus | ESCC | 1.48e-05 | 3.33e-01 | 0.1371 |
| 8638 | OASL | P40T-E | Human | Esophagus | ESCC | 3.05e-12 | 8.58e-01 | 0.109 |
| 8638 | OASL | P42T-E | Human | Esophagus | ESCC | 1.32e-07 | 7.21e-01 | 0.1175 |
| 8638 | OASL | P47T-E | Human | Esophagus | ESCC | 2.17e-02 | 1.37e-01 | 0.1067 |
| 8638 | OASL | P52T-E | Human | Esophagus | ESCC | 2.54e-49 | 2.53e+00 | 0.1555 |
| 8638 | OASL | P54T-E | Human | Esophagus | ESCC | 1.01e-06 | 4.24e-01 | 0.0975 |
| 8638 | OASL | P61T-E | Human | Esophagus | ESCC | 1.61e-06 | 3.42e-01 | 0.099 |
| 8638 | OASL | P62T-E | Human | Esophagus | ESCC | 5.58e-28 | 1.19e+00 | 0.1302 |
| Page: 1 2 3 |
| Tissue | Expression Dynamics | Abbreviation |
| Esophagus | 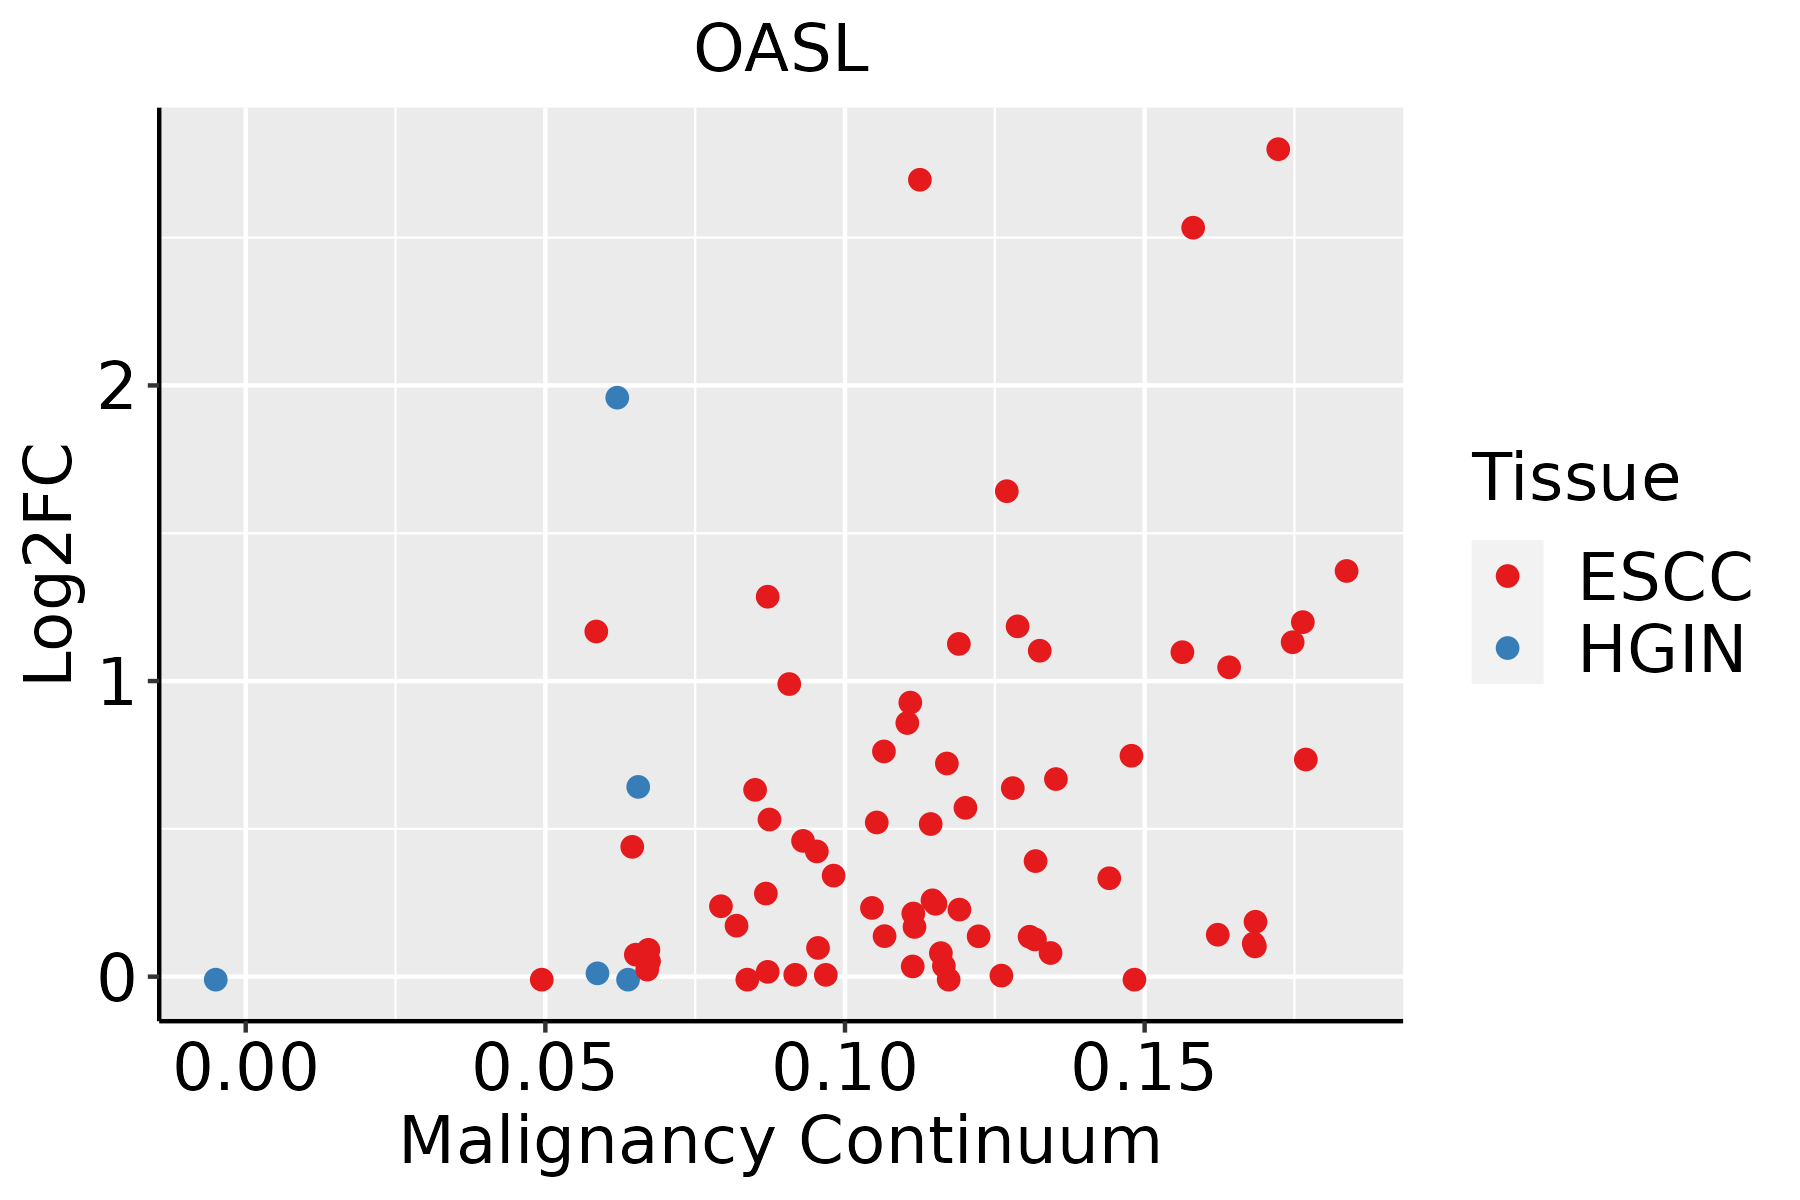 | ESCC: Esophageal squamous cell carcinoma |
| HGIN: High-grade intraepithelial neoplasias | ||
| LGIN: Low-grade intraepithelial neoplasias | ||
| Liver | 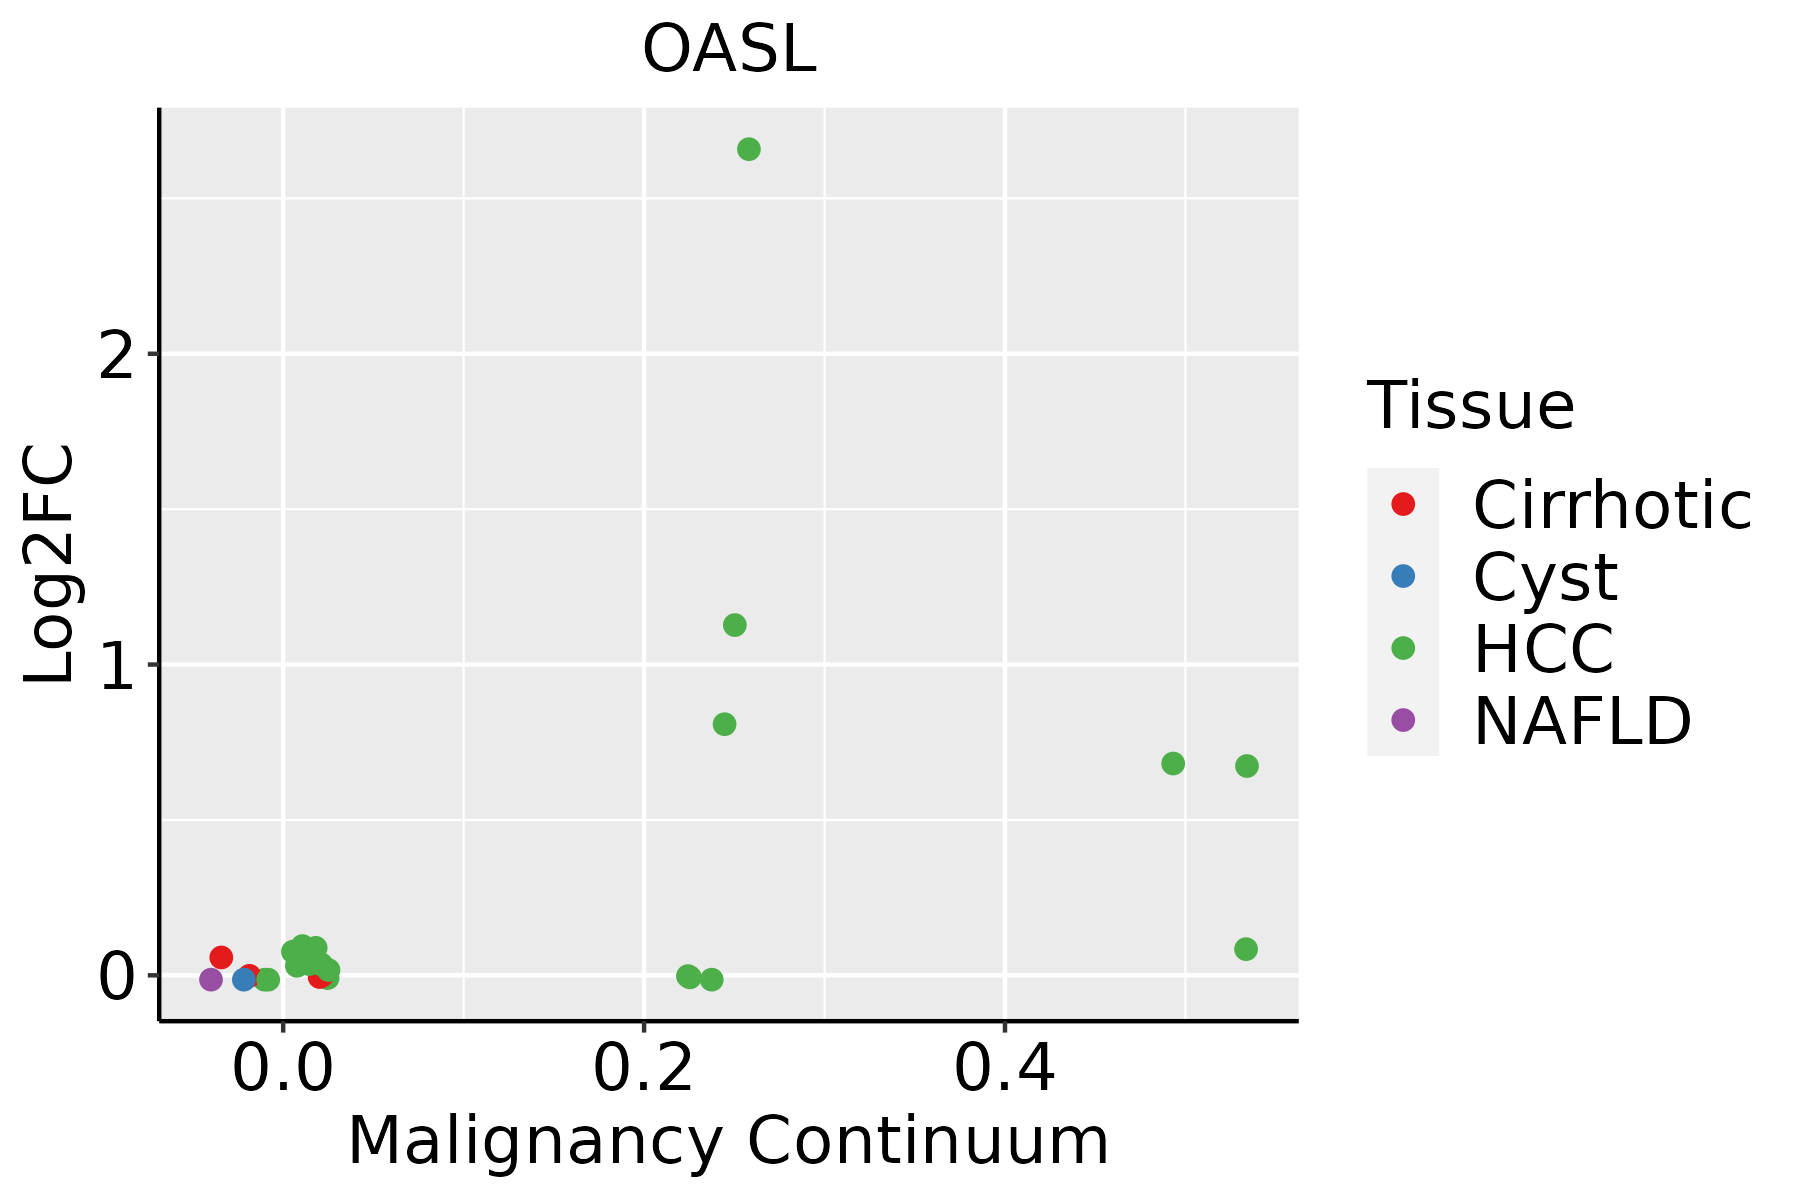 | HCC: Hepatocellular carcinoma |
| NAFLD: Non-alcoholic fatty liver disease | ||
| Oral Cavity | 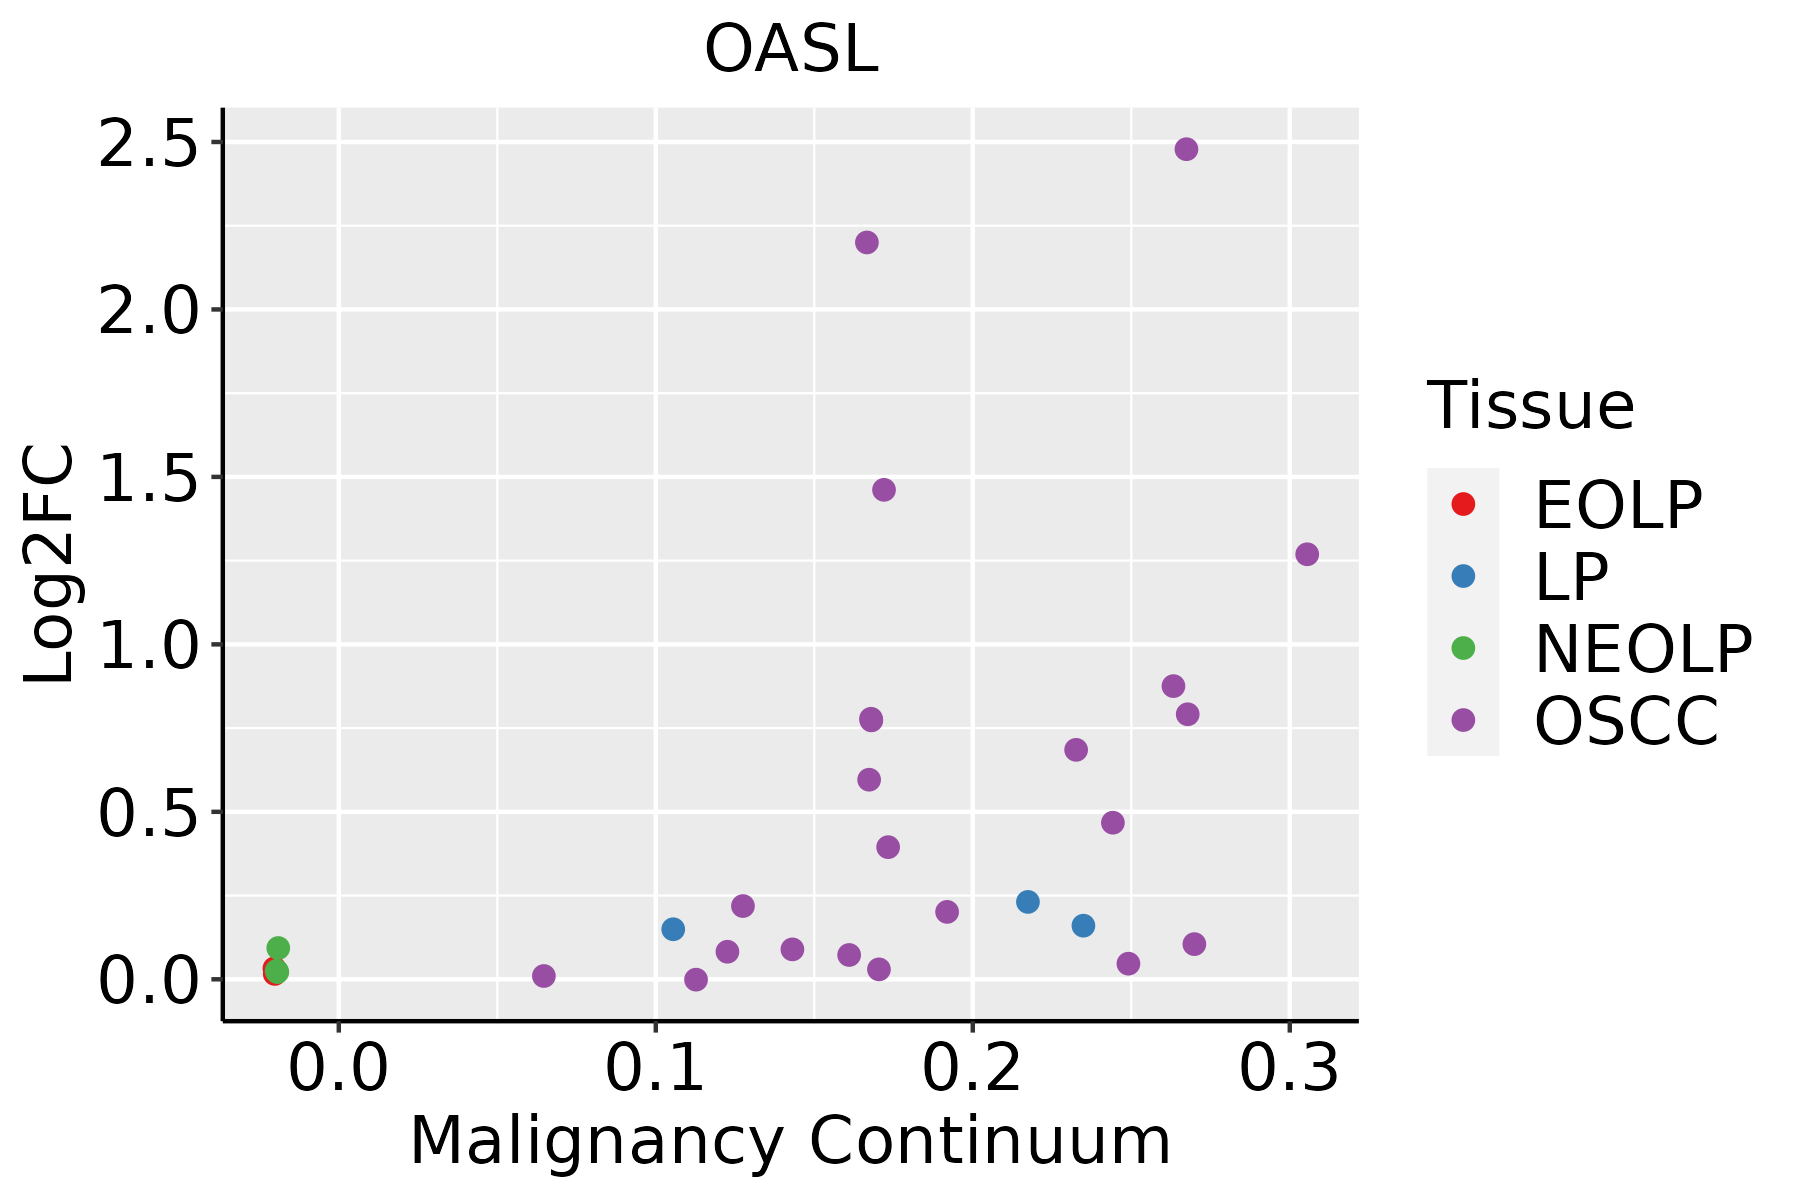 | EOLP: Erosive Oral lichen planus |
| LP: leukoplakia | ||
| NEOLP: Non-erosive oral lichen planus | ||
| OSCC: Oral squamous cell carcinoma |
| ∗log2FC in expression of this searched gene in stem-like cells from each diseased tissue sample relative to stem-like cells in normal samples in each tissue plotted against the malignancy continuum. Samples are colored based on if they are from different disease stage. |
Top |
Malignant transformation related pathway analysis |
| Find out the enriched GO biological processes and KEGG pathways involved in transition from healthy to precancer to cancer |
| Tissue | Disease Stage | Enriched GO biological Processes |
| Colorectum | AD |  |
| Colorectum | SER |  |
| Colorectum | MSS |  |
| Colorectum | MSI-H |  |
| Colorectum | FAP |  |
| ∗Top 15 enriched GO BP terms are showed in the bar plot of each disease state in each tissue. Each row represents a significant GO biological process which is colored according to the -log10(p.adjust). |
| Page: 1 2 3 4 5 6 7 8 9 |
| GO ID | Tissue | Disease Stage | Description | Gene Ratio | Bg Ratio | pvalue | p.adjust | Count |
| GO:0016032111 | Esophagus | ESCC | viral process | 301/8552 | 415/18723 | 3.34e-29 | 1.32e-26 | 301 |
| GO:0019058111 | Esophagus | ESCC | viral life cycle | 226/8552 | 317/18723 | 1.17e-20 | 1.76e-18 | 226 |
| GO:0019079111 | Esophagus | ESCC | viral genome replication | 102/8552 | 131/18723 | 4.31e-14 | 2.19e-12 | 102 |
| GO:000961518 | Esophagus | ESCC | response to virus | 238/8552 | 367/18723 | 6.65e-14 | 3.32e-12 | 238 |
| GO:0050792111 | Esophagus | ESCC | regulation of viral process | 119/8552 | 164/18723 | 2.19e-12 | 9.03e-11 | 119 |
| GO:1903900111 | Esophagus | ESCC | regulation of viral life cycle | 106/8552 | 148/18723 | 1.26e-10 | 3.72e-09 | 106 |
| GO:0045069110 | Esophagus | ESCC | regulation of viral genome replication | 67/8552 | 85/18723 | 3.81e-10 | 1.04e-08 | 67 |
| GO:00516075 | Esophagus | ESCC | defense response to virus | 171/8552 | 265/18723 | 3.91e-10 | 1.05e-08 | 171 |
| GO:01405465 | Esophagus | ESCC | defense response to symbiont | 171/8552 | 265/18723 | 3.91e-10 | 1.05e-08 | 171 |
| GO:0030522110 | Esophagus | ESCC | intracellular receptor signaling pathway | 170/8552 | 265/18723 | 8.58e-10 | 2.09e-08 | 170 |
| GO:004852516 | Esophagus | ESCC | negative regulation of viral process | 66/8552 | 92/18723 | 3.49e-07 | 4.88e-06 | 66 |
| GO:004507114 | Esophagus | ESCC | negative regulation of viral genome replication | 44/8552 | 56/18723 | 4.84e-07 | 6.50e-06 | 44 |
| GO:00028318 | Esophagus | ESCC | regulation of response to biotic stimulus | 191/8552 | 327/18723 | 2.12e-06 | 2.45e-05 | 191 |
| GO:003952813 | Esophagus | ESCC | cytoplasmic pattern recognition receptor signaling pathway in response to virus | 28/8552 | 34/18723 | 1.21e-05 | 1.12e-04 | 28 |
| GO:009858613 | Esophagus | ESCC | cellular response to virus | 56/8552 | 84/18723 | 8.20e-05 | 6.01e-04 | 56 |
| GO:00320698 | Esophagus | ESCC | regulation of nuclease activity | 19/8552 | 22/18723 | 9.52e-05 | 6.78e-04 | 19 |
| GO:003952913 | Esophagus | ESCC | RIG-I signaling pathway | 22/8552 | 27/18723 | 1.49e-04 | 9.92e-04 | 22 |
| GO:000275313 | Esophagus | ESCC | cytoplasmic pattern recognition receptor signaling pathway | 41/8552 | 60/18723 | 3.25e-04 | 1.91e-03 | 41 |
| GO:00395313 | Esophagus | ESCC | regulation of viral-induced cytoplasmic pattern recognition receptor signaling pathway | 18/8552 | 24/18723 | 3.43e-03 | 1.41e-02 | 18 |
| GO:00395355 | Esophagus | ESCC | regulation of RIG-I signaling pathway | 15/8552 | 20/18723 | 7.60e-03 | 2.71e-02 | 15 |
| Page: 1 2 3 4 |
| Pathway ID | Tissue | Disease Stage | Description | Gene Ratio | Bg Ratio | pvalue | p.adjust | qvalue | Count |
| hsa0516510 | Esophagus | ESCC | Human papillomavirus infection | 215/4205 | 331/8465 | 7.86e-09 | 7.12e-08 | 3.65e-08 | 215 |
| hsa0516515 | Esophagus | ESCC | Human papillomavirus infection | 215/4205 | 331/8465 | 7.86e-09 | 7.12e-08 | 3.65e-08 | 215 |
| hsa051652 | Liver | HCC | Human papillomavirus infection | 188/4020 | 331/8465 | 3.34e-04 | 1.49e-03 | 8.29e-04 | 188 |
| hsa051653 | Liver | HCC | Human papillomavirus infection | 188/4020 | 331/8465 | 3.34e-04 | 1.49e-03 | 8.29e-04 | 188 |
| hsa051659 | Oral cavity | OSCC | Human papillomavirus infection | 200/3704 | 331/8465 | 3.83e-10 | 4.93e-09 | 2.51e-09 | 200 |
| hsa0516514 | Oral cavity | OSCC | Human papillomavirus infection | 200/3704 | 331/8465 | 3.83e-10 | 4.93e-09 | 2.51e-09 | 200 |
| Page: 1 |
Top |
Cell-cell communication analysis |
| Identification of potential cell-cell interactions between two cell types and their ligand-receptor pairs for different disease states |
| Ligand | Receptor | LRpair | Pathway | Tissue | Disease Stage |
| Page: 1 |
Top |
Single-cell gene regulatory network inference analysis |
| Find out the significant the regulons (TFs) and the target genes of each regulon across cell types for different disease states |
| TF | Cell Type | Tissue | Disease Stage | Target Gene | RSS | Regulon Activity |
| ∗The dot plots of a searched regulon are shown for all cell subpopulations in each disease state of each tissue based on the regulon specific score inferred using pySCENIC and by calculating the average expression. |
| Page: 1 |
Top |
Somatic mutation of malignant transformation related genes |
| Annotation of somatic variants for genes involved in malignant transformation |
| Hugo Symbol | Variant Class | Variant Classification | dbSNP RS | HGVSc | HGVSp | HGVSp Short | SWISSPROT | BIOTYPE | SIFT | PolyPhen | Tumor Sample Barcode | Tissue | Histology | Sex | Age | Stage | Therapy Types | Drugs | Outcome |
| OASL | SNV | Missense_Mutation | c.929N>G | p.Thr310Ser | p.T310S | Q15646 | protein_coding | deleterious(0) | probably_damaging(1) | TCGA-AC-A23G-01 | Breast | breast invasive carcinoma | Female | >=65 | I/II | Chemotherapy | cytoxan | CR | |
| OASL | SNV | Missense_Mutation | c.239N>C | p.Arg80Thr | p.R80T | Q15646 | protein_coding | tolerated(0.26) | benign(0) | TCGA-AC-A23H-01 | Breast | breast invasive carcinoma | Female | >=65 | I/II | Unknown | Unknown | PD | |
| OASL | SNV | Missense_Mutation | c.121N>C | p.Glu41Gln | p.E41Q | Q15646 | protein_coding | tolerated(0.25) | benign(0.038) | TCGA-AC-A23H-01 | Breast | breast invasive carcinoma | Female | >=65 | I/II | Unknown | Unknown | PD | |
| OASL | SNV | Missense_Mutation | c.1001G>A | p.Cys334Tyr | p.C334Y | Q15646 | protein_coding | deleterious(0) | probably_damaging(1) | TCGA-C8-A12X-01 | Breast | breast invasive carcinoma | Female | <65 | I/II | Unknown | Unknown | SD | |
| OASL | SNV | Missense_Mutation | c.490N>A | p.Leu164Ile | p.L164I | Q15646 | protein_coding | tolerated(0.3) | benign(0.007) | TCGA-C8-A1HM-01 | Breast | breast invasive carcinoma | Female | >=65 | I/II | Chemotherapy | doxorubicin | CR | |
| OASL | insertion | Nonsense_Mutation | novel | c.437_438insCTAAGACATGGATGTGAGGATACGCAGTTTATTTGGG | p.Glu147Ter | p.E147* | Q15646 | protein_coding | TCGA-AR-A0TY-01 | Breast | breast invasive carcinoma | Female | <65 | I/II | Unspecific | Paclitaxel | PD | ||
| OASL | SNV | Missense_Mutation | novel | c.313N>A | p.Leu105Met | p.L105M | Q15646 | protein_coding | deleterious(0.01) | probably_damaging(0.959) | TCGA-EA-A410-01 | Cervix | cervical & endocervical cancer | Female | <65 | I/II | Unknown | Unknown | SD |
| OASL | SNV | Missense_Mutation | novel | c.668N>A | p.Ala223Asp | p.A223D | Q15646 | protein_coding | tolerated(0.49) | benign(0.055) | TCGA-AA-A00N-01 | Colorectum | colon adenocarcinoma | Male | >=65 | I/II | Unknown | Unknown | PD |
| OASL | SNV | Missense_Mutation | c.485N>A | p.Pro162His | p.P162H | Q15646 | protein_coding | tolerated(0.23) | benign(0.017) | TCGA-AA-A010-01 | Colorectum | colon adenocarcinoma | Female | <65 | I/II | Chemotherapy | folinic | CR | |
| OASL | SNV | Missense_Mutation | c.869N>G | p.Asp290Gly | p.D290G | Q15646 | protein_coding | tolerated(0.33) | benign(0.026) | TCGA-G4-6304-01 | Colorectum | colon adenocarcinoma | Female | >=65 | I/II | Chemotherapy | fluorouracil | PD |
| Page: 1 2 3 4 5 6 |
Top |
Related drugs of malignant transformation related genes |
| Identification of chemicals and drugs interact with genes involved in malignant transfromation |
| (DGIdb 4.0) |
| Entrez ID | Symbol | Category | Interaction Types | Drug Claim Name | Drug Name | PMIDs |
| 8638 | OASL | NA | peginterferon alfa-2b | 21993426 | ||
| 8638 | OASL | NA | ribavirin | RIBAVIRIN | 21993426 |
| Page: 1 |

Copyright 2023-Present -The University of Texas Health Science Center at Houston |