
|
|||||
|
 | |
| |
| |
| |
| |
| |
|
Gene: OAS1 |
Gene summary for OAS1 |
| Gene information | Species | Human | Gene symbol | OAS1 | Gene ID | 4938 |
| Gene name | 2'-5'-oligoadenylate synthetase 1 | |
| Gene Alias | E18/E16 | |
| Cytomap | 12q24.13 | |
| Gene Type | protein-coding | GO ID | GO:0001816 | UniProtAcc | P00973 |
Top |
Malignant transformation analysis |
| Identification of the aberrant gene expression in precancerous and cancerous lesions by comparing the gene expression of stem-like cells in diseased tissues with normal stem cells |
| Entrez ID | Symbol | Replicates | Species | Organ | Tissue | Adj P-value | Log2FC | Malignancy |
| 4938 | OAS1 | HTA11_2487_2000001011 | Human | Colorectum | SER | 1.59e-14 | 7.51e-01 | -0.1808 |
| 4938 | OAS1 | HTA11_78_2000001011 | Human | Colorectum | AD | 1.69e-05 | 2.42e-01 | -0.1088 |
| 4938 | OAS1 | HTA11_347_2000001011 | Human | Colorectum | AD | 4.78e-11 | 2.91e-01 | -0.1954 |
| 4938 | OAS1 | HTA11_2112_2000001011 | Human | Colorectum | SER | 1.99e-06 | 7.25e-01 | -0.2196 |
| 4938 | OAS1 | HTA11_3361_2000001011 | Human | Colorectum | AD | 4.34e-02 | 2.49e-01 | -0.1207 |
| 4938 | OAS1 | HTA11_696_2000001011 | Human | Colorectum | AD | 1.21e-08 | 4.11e-01 | -0.1464 |
| 4938 | OAS1 | HTA11_1391_2000001011 | Human | Colorectum | AD | 1.58e-11 | 3.76e-01 | -0.059 |
| 4938 | OAS1 | HTA11_5212_2000001011 | Human | Colorectum | AD | 1.16e-07 | 4.29e-01 | -0.2061 |
| 4938 | OAS1 | HTA11_99999970781_79442 | Human | Colorectum | MSS | 1.82e-08 | 3.26e-01 | 0.294 |
| 4938 | OAS1 | HTA11_99999965062_69753 | Human | Colorectum | MSI-H | 1.28e-10 | 1.27e+00 | 0.3487 |
| 4938 | OAS1 | HTA11_99999971662_82457 | Human | Colorectum | MSS | 4.09e-02 | 1.75e-01 | 0.3859 |
| 4938 | OAS1 | HTA11_99999973899_84307 | Human | Colorectum | MSS | 2.54e-04 | 3.37e-01 | 0.2585 |
| 4938 | OAS1 | HTA11_99999974143_84620 | Human | Colorectum | MSS | 3.52e-12 | 3.50e-01 | 0.3005 |
| 4938 | OAS1 | LZE4T | Human | Esophagus | ESCC | 3.44e-07 | 2.61e-01 | 0.0811 |
| 4938 | OAS1 | LZE5T | Human | Esophagus | ESCC | 1.03e-04 | 4.37e-01 | 0.0514 |
| 4938 | OAS1 | LZE7T | Human | Esophagus | ESCC | 1.79e-04 | 1.85e-01 | 0.0667 |
| 4938 | OAS1 | LZE8T | Human | Esophagus | ESCC | 2.06e-08 | 2.68e-01 | 0.067 |
| 4938 | OAS1 | LZE20T | Human | Esophagus | ESCC | 9.55e-21 | 9.14e-01 | 0.0662 |
| 4938 | OAS1 | LZE22T | Human | Esophagus | ESCC | 5.38e-06 | 4.62e-01 | 0.068 |
| 4938 | OAS1 | LZE24T | Human | Esophagus | ESCC | 3.46e-49 | 2.03e+00 | 0.0596 |
| Page: 1 2 3 4 5 6 |
| Tissue | Expression Dynamics | Abbreviation |
| Colorectum (GSE201348) |  | FAP: Familial adenomatous polyposis |
| CRC: Colorectal cancer | ||
| Colorectum (HTA11) |  | AD: Adenomas |
| SER: Sessile serrated lesions | ||
| MSI-H: Microsatellite-high colorectal cancer | ||
| MSS: Microsatellite stable colorectal cancer | ||
| Esophagus | 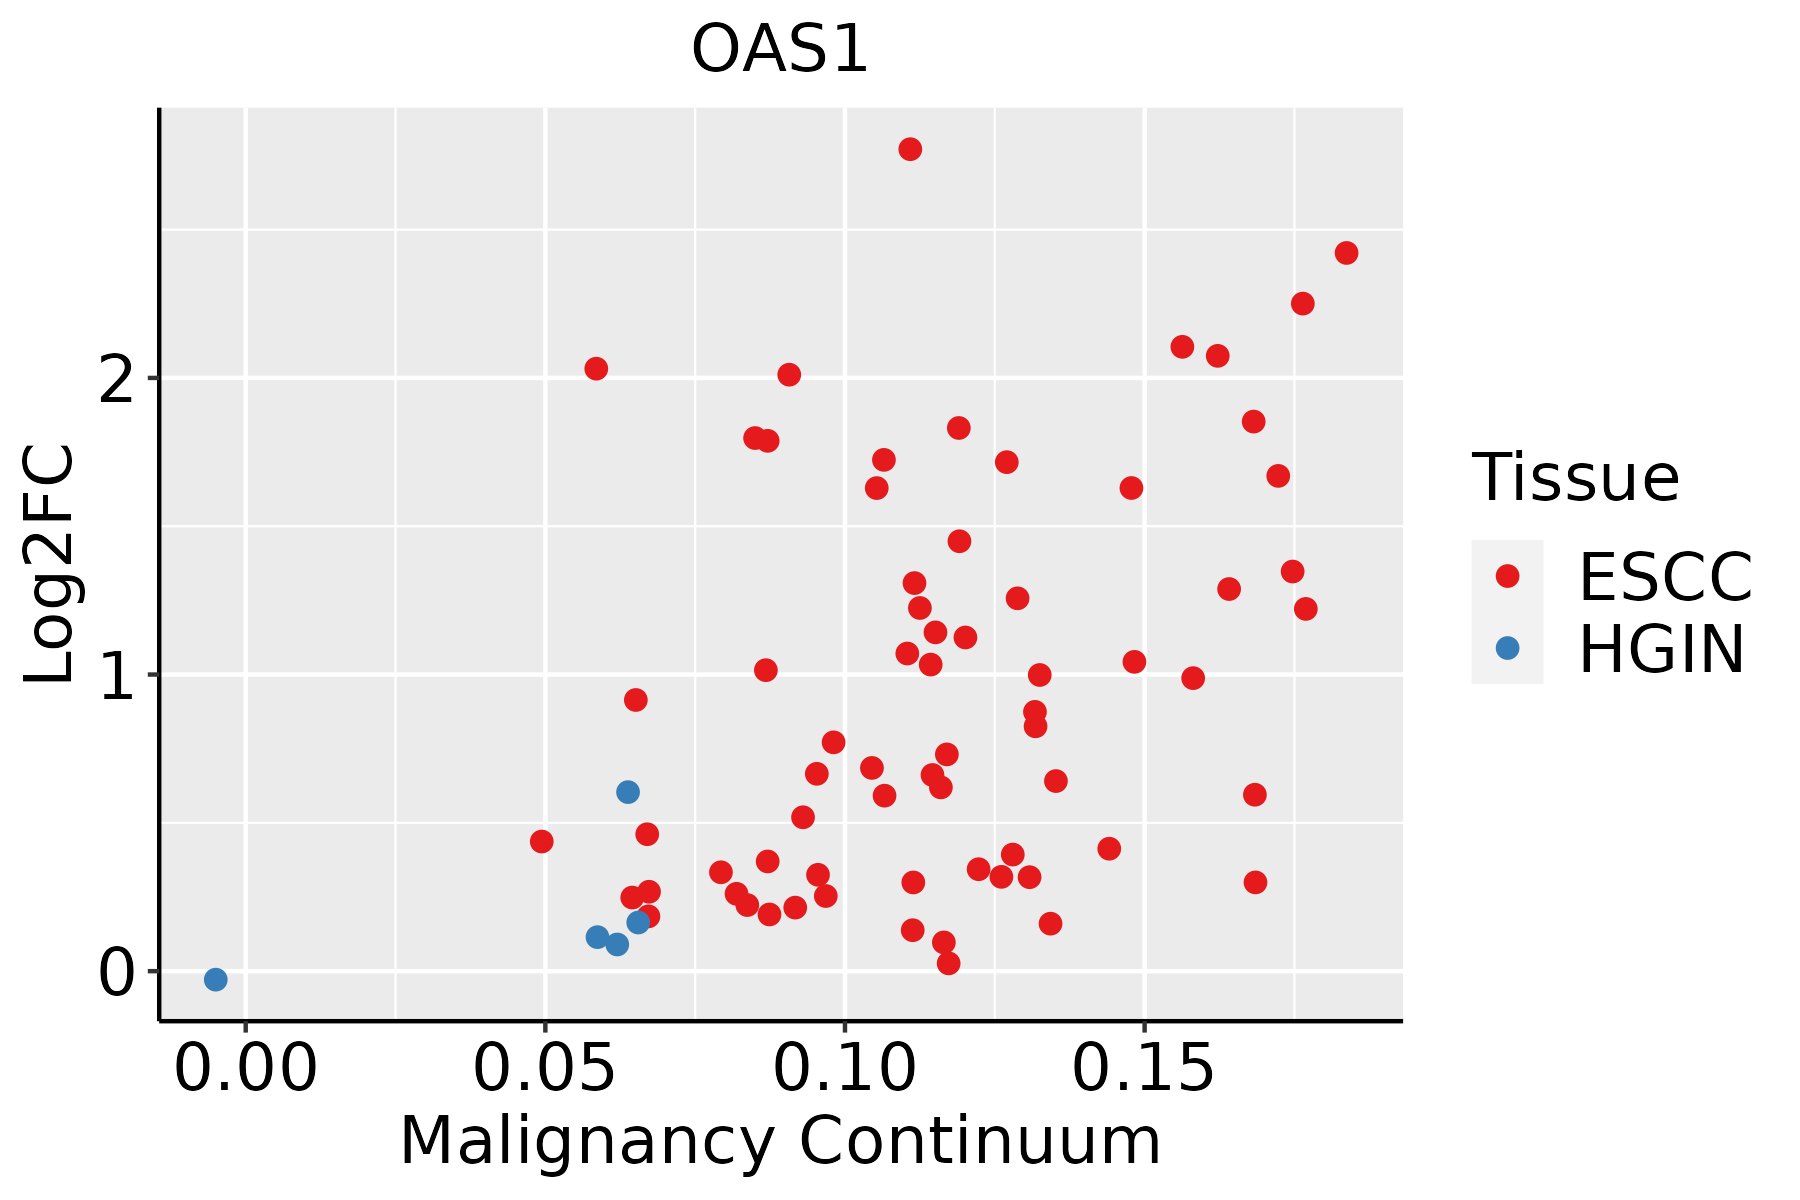 | ESCC: Esophageal squamous cell carcinoma |
| HGIN: High-grade intraepithelial neoplasias | ||
| LGIN: Low-grade intraepithelial neoplasias | ||
| Liver | 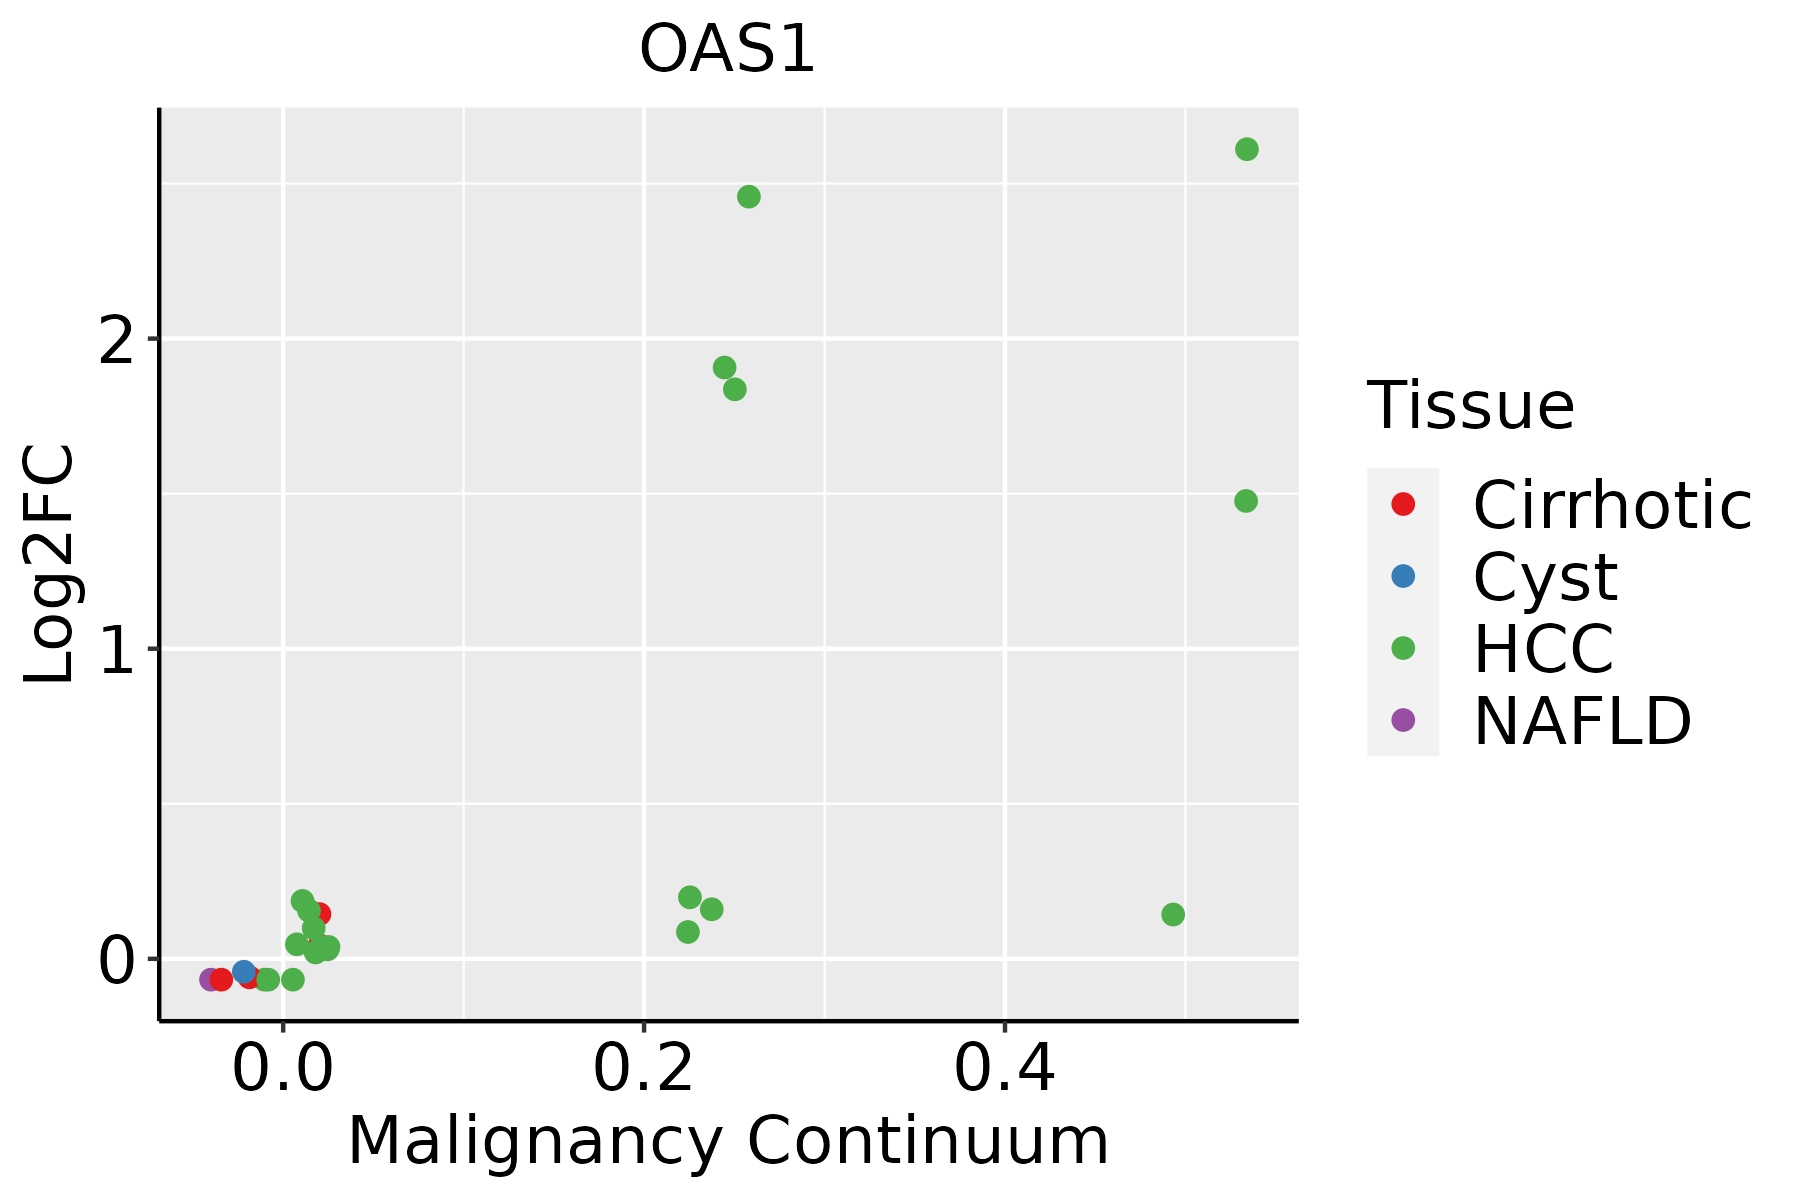 | HCC: Hepatocellular carcinoma |
| NAFLD: Non-alcoholic fatty liver disease | ||
| Oral Cavity |  | EOLP: Erosive Oral lichen planus |
| LP: leukoplakia | ||
| NEOLP: Non-erosive oral lichen planus | ||
| OSCC: Oral squamous cell carcinoma | ||
| Skin | 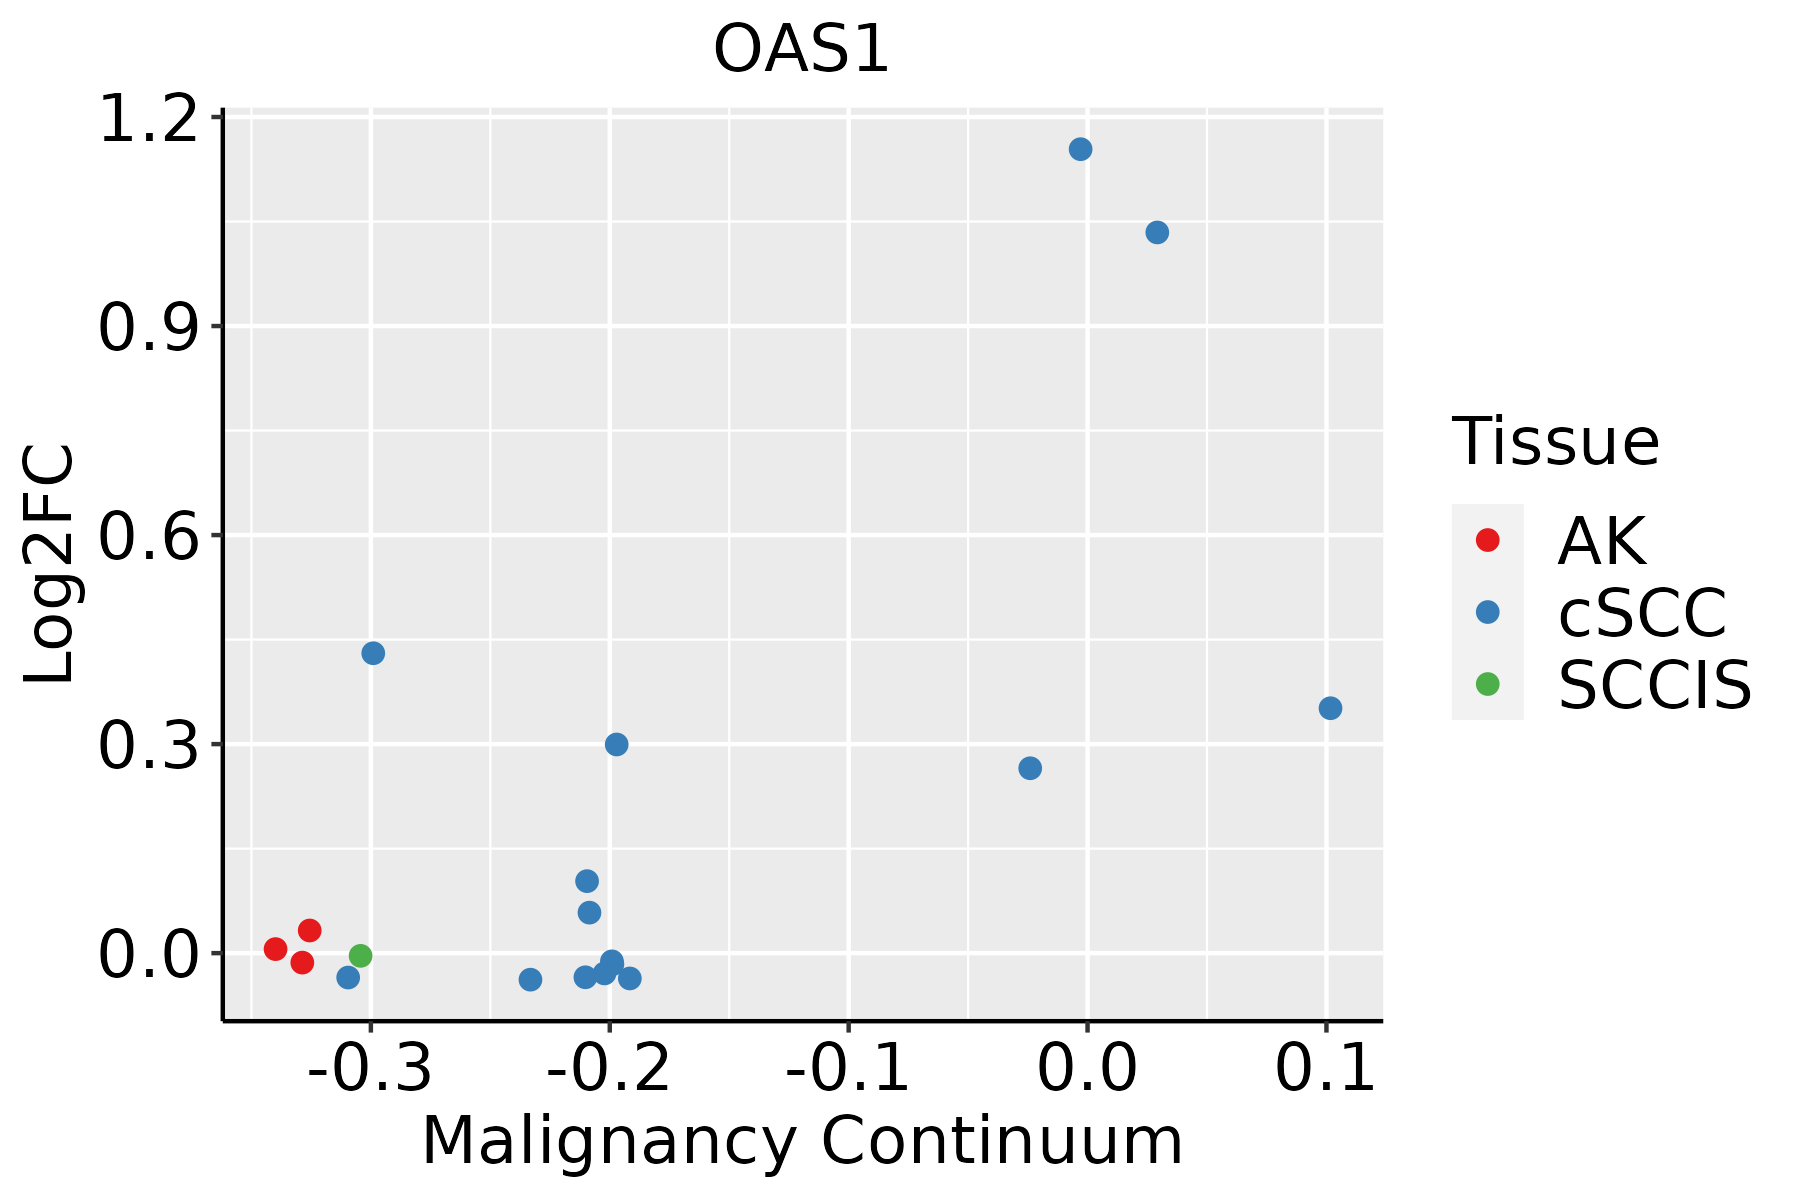 | AK: Actinic keratosis |
| cSCC: Cutaneous squamous cell carcinoma | ||
| SCCIS:squamous cell carcinoma in situ | ||
| Thyroid | 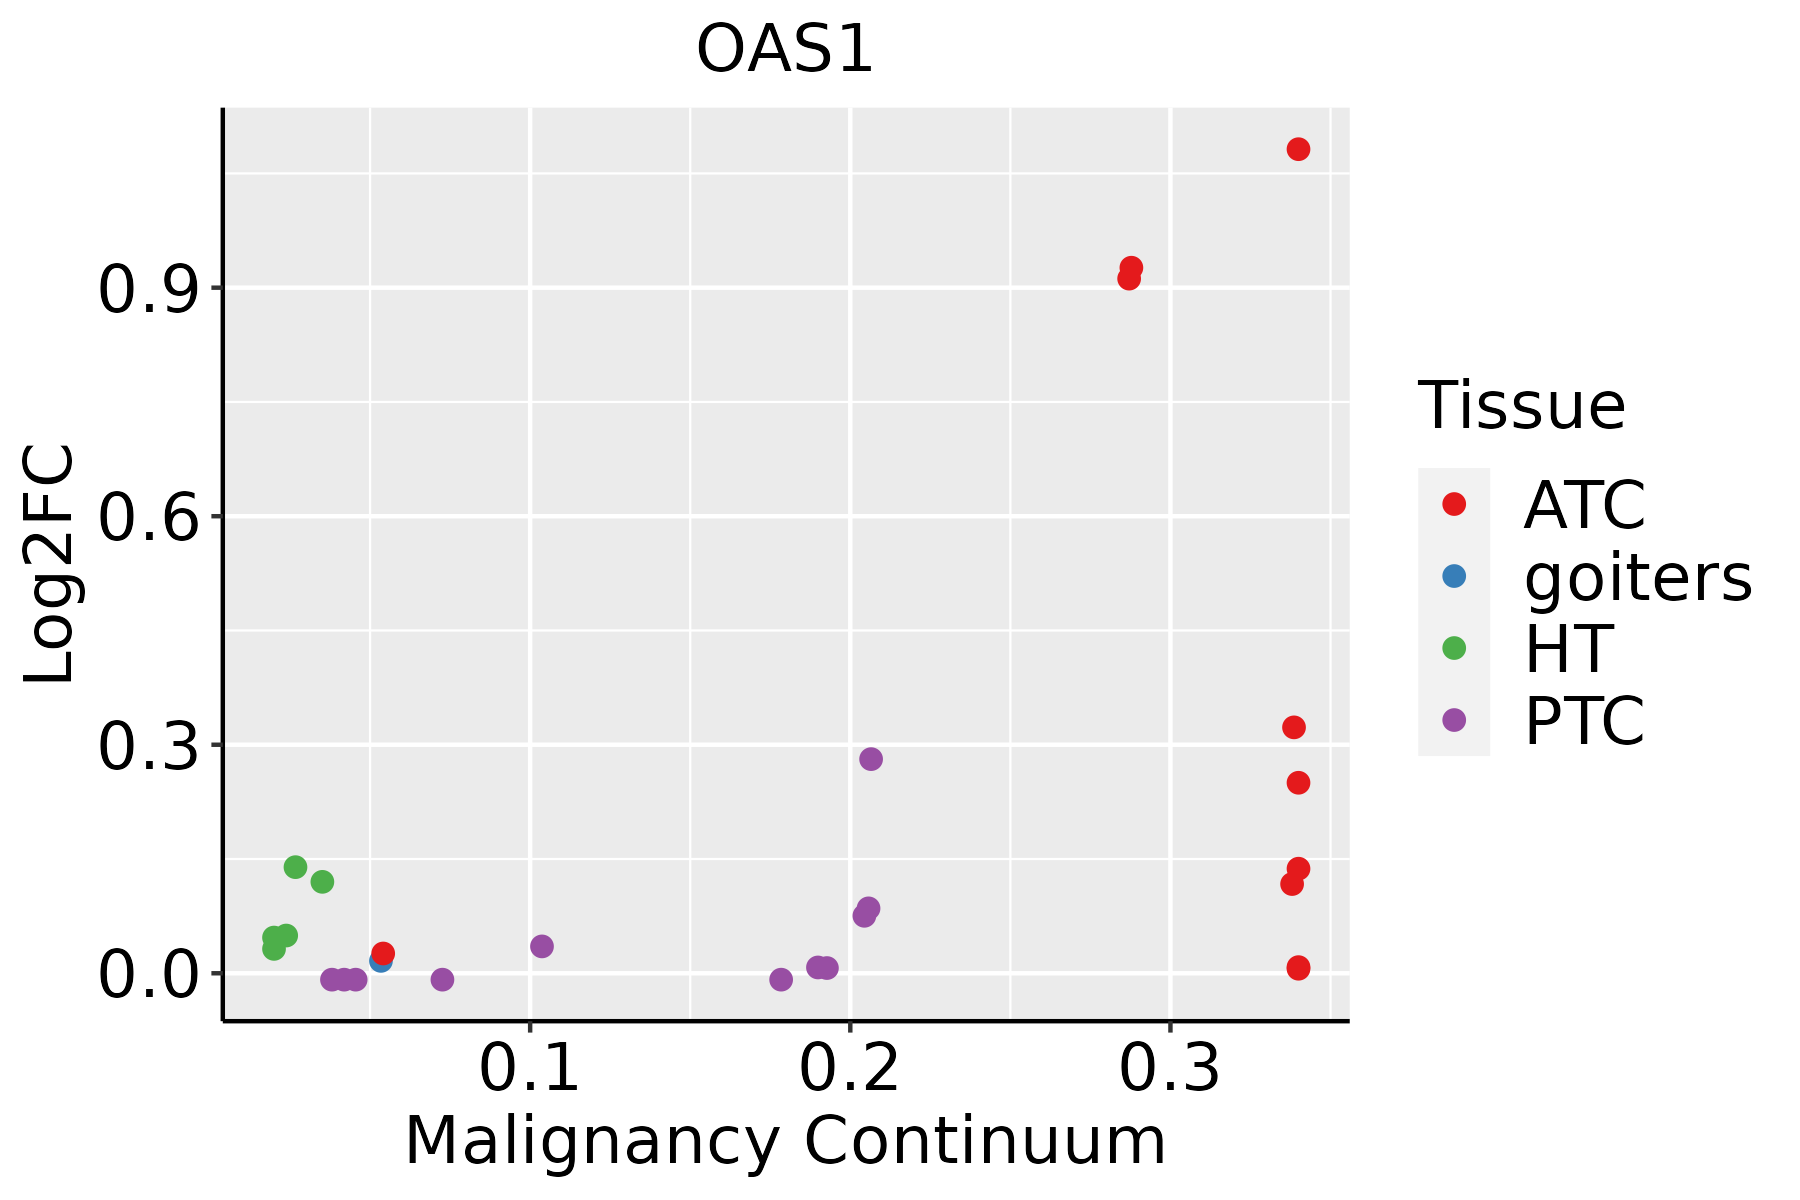 | ATC: Anaplastic thyroid cancer |
| HT: Hashimoto's thyroiditis | ||
| PTC: Papillary thyroid cancer |
| ∗log2FC in expression of this searched gene in stem-like cells from each diseased tissue sample relative to stem-like cells in normal samples in each tissue plotted against the malignancy continuum. Samples are colored based on if they are from different disease stage. |
Top |
Malignant transformation related pathway analysis |
| Find out the enriched GO biological processes and KEGG pathways involved in transition from healthy to precancer to cancer |
| Tissue | Disease Stage | Enriched GO biological Processes |
| Colorectum | AD |  |
| Colorectum | SER |  |
| Colorectum | MSS |  |
| Colorectum | MSI-H |  |
| Colorectum | FAP |  |
| ∗Top 15 enriched GO BP terms are showed in the bar plot of each disease state in each tissue. Each row represents a significant GO biological process which is colored according to the -log10(p.adjust). |
| Page: 1 2 3 4 5 6 7 8 9 |
| GO ID | Tissue | Disease Stage | Description | Gene Ratio | Bg Ratio | pvalue | p.adjust | Count |
| GO:0016032 | Colorectum | AD | viral process | 168/3918 | 415/18723 | 4.67e-20 | 3.66e-17 | 168 |
| GO:0019058 | Colorectum | AD | viral life cycle | 119/3918 | 317/18723 | 6.18e-12 | 8.23e-10 | 119 |
| GO:0019079 | Colorectum | AD | viral genome replication | 51/3918 | 131/18723 | 1.83e-06 | 5.51e-05 | 51 |
| GO:0050792 | Colorectum | AD | regulation of viral process | 59/3918 | 164/18723 | 5.95e-06 | 1.52e-04 | 59 |
| GO:0033500 | Colorectum | AD | carbohydrate homeostasis | 84/3918 | 259/18723 | 9.10e-06 | 2.15e-04 | 84 |
| GO:0042593 | Colorectum | AD | glucose homeostasis | 83/3918 | 258/18723 | 1.44e-05 | 3.11e-04 | 83 |
| GO:0019318 | Colorectum | AD | hexose metabolic process | 77/3918 | 237/18723 | 1.96e-05 | 4.01e-04 | 77 |
| GO:0005996 | Colorectum | AD | monosaccharide metabolic process | 80/3918 | 257/18723 | 7.31e-05 | 1.17e-03 | 80 |
| GO:1903900 | Colorectum | AD | regulation of viral life cycle | 51/3918 | 148/18723 | 9.01e-05 | 1.38e-03 | 51 |
| GO:0060249 | Colorectum | AD | anatomical structure homeostasis | 94/3918 | 314/18723 | 9.37e-05 | 1.42e-03 | 94 |
| GO:0001894 | Colorectum | AD | tissue homeostasis | 81/3918 | 268/18723 | 1.96e-04 | 2.62e-03 | 81 |
| GO:0006006 | Colorectum | AD | glucose metabolic process | 62/3918 | 196/18723 | 2.76e-04 | 3.39e-03 | 62 |
| GO:0045069 | Colorectum | AD | regulation of viral genome replication | 32/3918 | 85/18723 | 2.97e-04 | 3.60e-03 | 32 |
| GO:0072567 | Colorectum | AD | chemokine (C-X-C motif) ligand 2 production | 11/3918 | 20/18723 | 8.39e-04 | 8.21e-03 | 11 |
| GO:2000341 | Colorectum | AD | regulation of chemokine (C-X-C motif) ligand 2 production | 11/3918 | 20/18723 | 8.39e-04 | 8.21e-03 | 11 |
| GO:0032481 | Colorectum | AD | positive regulation of type I interferon production | 23/3918 | 58/18723 | 8.82e-04 | 8.53e-03 | 23 |
| GO:0034340 | Colorectum | AD | response to type I interferon | 22/3918 | 58/18723 | 2.23e-03 | 1.75e-02 | 22 |
| GO:0032069 | Colorectum | AD | regulation of nuclease activity | 11/3918 | 22/18723 | 2.32e-03 | 1.80e-02 | 11 |
| GO:0060337 | Colorectum | AD | type I interferon signaling pathway | 19/3918 | 50/18723 | 4.23e-03 | 2.91e-02 | 19 |
| GO:0071357 | Colorectum | AD | cellular response to type I interferon | 19/3918 | 52/18723 | 6.92e-03 | 4.26e-02 | 19 |
| Page: 1 2 3 4 5 6 7 8 9 10 11 12 13 14 15 16 17 |
| Pathway ID | Tissue | Disease Stage | Description | Gene Ratio | Bg Ratio | pvalue | p.adjust | qvalue | Count |
| hsa05171 | Colorectum | AD | Coronavirus disease - COVID-19 | 113/2092 | 232/8465 | 9.90e-16 | 2.55e-14 | 1.63e-14 | 113 |
| hsa05160 | Colorectum | AD | Hepatitis C | 54/2092 | 157/8465 | 3.87e-03 | 1.96e-02 | 1.25e-02 | 54 |
| hsa051711 | Colorectum | AD | Coronavirus disease - COVID-19 | 113/2092 | 232/8465 | 9.90e-16 | 2.55e-14 | 1.63e-14 | 113 |
| hsa051601 | Colorectum | AD | Hepatitis C | 54/2092 | 157/8465 | 3.87e-03 | 1.96e-02 | 1.25e-02 | 54 |
| hsa051712 | Colorectum | SER | Coronavirus disease - COVID-19 | 98/1580 | 232/8465 | 3.33e-17 | 8.50e-16 | 6.17e-16 | 98 |
| hsa051713 | Colorectum | SER | Coronavirus disease - COVID-19 | 98/1580 | 232/8465 | 3.33e-17 | 8.50e-16 | 6.17e-16 | 98 |
| hsa051714 | Colorectum | MSS | Coronavirus disease - COVID-19 | 108/1875 | 232/8465 | 6.50e-17 | 1.67e-15 | 1.03e-15 | 108 |
| hsa051602 | Colorectum | MSS | Hepatitis C | 52/1875 | 157/8465 | 9.29e-04 | 5.58e-03 | 3.42e-03 | 52 |
| hsa05169 | Colorectum | MSS | Epstein-Barr virus infection | 63/1875 | 202/8465 | 1.63e-03 | 8.98e-03 | 5.50e-03 | 63 |
| hsa051715 | Colorectum | MSS | Coronavirus disease - COVID-19 | 108/1875 | 232/8465 | 6.50e-17 | 1.67e-15 | 1.03e-15 | 108 |
| hsa051603 | Colorectum | MSS | Hepatitis C | 52/1875 | 157/8465 | 9.29e-04 | 5.58e-03 | 3.42e-03 | 52 |
| hsa051691 | Colorectum | MSS | Epstein-Barr virus infection | 63/1875 | 202/8465 | 1.63e-03 | 8.98e-03 | 5.50e-03 | 63 |
| hsa051716 | Colorectum | MSI-H | Coronavirus disease - COVID-19 | 91/797 | 232/8465 | 2.21e-35 | 3.58e-33 | 3.00e-33 | 91 |
| hsa051717 | Colorectum | MSI-H | Coronavirus disease - COVID-19 | 91/797 | 232/8465 | 2.21e-35 | 3.58e-33 | 3.00e-33 | 91 |
| hsa05169210 | Esophagus | ESCC | Epstein-Barr virus infection | 151/4205 | 202/8465 | 1.55e-13 | 3.45e-12 | 1.77e-12 | 151 |
| hsa0516425 | Esophagus | ESCC | Influenza A | 122/4205 | 171/8465 | 5.01e-09 | 4.79e-08 | 2.45e-08 | 122 |
| hsa05171211 | Esophagus | ESCC | Coronavirus disease - COVID-19 | 156/4205 | 232/8465 | 3.18e-08 | 2.68e-07 | 1.37e-07 | 156 |
| hsa051609 | Esophagus | ESCC | Hepatitis C | 107/4205 | 157/8465 | 1.75e-06 | 1.08e-05 | 5.55e-06 | 107 |
| hsa051629 | Esophagus | ESCC | Measles | 90/4205 | 139/8465 | 2.16e-04 | 7.87e-04 | 4.03e-04 | 90 |
| hsa0462122 | Esophagus | ESCC | NOD-like receptor signaling pathway | 116/4205 | 186/8465 | 2.90e-04 | 1.03e-03 | 5.30e-04 | 116 |
| Page: 1 2 3 |
Top |
Cell-cell communication analysis |
| Identification of potential cell-cell interactions between two cell types and their ligand-receptor pairs for different disease states |
| Ligand | Receptor | LRpair | Pathway | Tissue | Disease Stage |
| Page: 1 |
Top |
Single-cell gene regulatory network inference analysis |
| Find out the significant the regulons (TFs) and the target genes of each regulon across cell types for different disease states |
| TF | Cell Type | Tissue | Disease Stage | Target Gene | RSS | Regulon Activity |
| ∗The dot plots of a searched regulon are shown for all cell subpopulations in each disease state of each tissue based on the regulon specific score inferred using pySCENIC and by calculating the average expression. |
| Page: 1 |
Top |
Somatic mutation of malignant transformation related genes |
| Annotation of somatic variants for genes involved in malignant transformation |
| Hugo Symbol | Variant Class | Variant Classification | dbSNP RS | HGVSc | HGVSp | HGVSp Short | SWISSPROT | BIOTYPE | SIFT | PolyPhen | Tumor Sample Barcode | Tissue | Histology | Sex | Age | Stage | Therapy Types | Drugs | Outcome |
| OAS1 | SNV | Missense_Mutation | novel | c.1221C>G | p.Ile407Met | p.I407M | P00973 | protein_coding | possibly_damaging(0.46) | TCGA-5L-AAT1-01 | Breast | breast invasive carcinoma | Female | <65 | III/IV | Hormone Therapy | letrozol | SD | |
| OAS1 | SNV | Missense_Mutation | novel | c.1076N>A | p.Arg359Lys | p.R359K | P00973 | protein_coding | tolerated(0.91) | benign(0.201) | TCGA-2W-A8YY-01 | Cervix | cervical & endocervical cancer | Female | <65 | I/II | Chemotherapy | cisplatin | CR |
| OAS1 | SNV | Missense_Mutation | c.850G>A | p.Glu284Lys | p.E284K | P00973 | protein_coding | tolerated(0.67) | benign(0.001) | TCGA-BI-A0VR-01 | Cervix | cervical & endocervical cancer | Female | <65 | III/IV | Unknown | Unknown | SD | |
| OAS1 | SNV | Missense_Mutation | c.663N>C | p.Lys221Asn | p.K221N | P00973 | protein_coding | deleterious(0.04) | benign(0.113) | TCGA-C5-A1BM-01 | Cervix | cervical & endocervical cancer | Female | >=65 | I/II | Unknown | Unknown | SD | |
| OAS1 | SNV | Missense_Mutation | rs753637535 | c.601N>T | p.Arg201Cys | p.R201C | P00973 | protein_coding | tolerated(0.12) | possibly_damaging(0.797) | TCGA-HM-A4S6-01 | Cervix | cervical & endocervical cancer | Female | <65 | III/IV | Chemotherapy | cisplatin | CR |
| OAS1 | SNV | Missense_Mutation | c.1004N>C | p.Trp335Ser | p.W335S | P00973 | protein_coding | tolerated(0.44) | benign(0.039) | TCGA-IR-A3LA-01 | Cervix | cervical & endocervical cancer | Female | <65 | I/II | Chemotherapy | cisplatin | CR | |
| OAS1 | SNV | Missense_Mutation | novel | c.934N>T | p.Asp312Tyr | p.D312Y | P00973 | protein_coding | deleterious(0.02) | possibly_damaging(0.839) | TCGA-AA-3950-01 | Colorectum | colon adenocarcinoma | Female | >=65 | I/II | Unknown | Unknown | SD |
| OAS1 | SNV | Missense_Mutation | rs148820389 | c.523N>A | p.Glu175Lys | p.E175K | P00973 | protein_coding | tolerated(0.36) | benign(0.003) | TCGA-D5-6534-01 | Colorectum | colon adenocarcinoma | Female | <65 | I/II | Unknown | Unknown | SD |
| OAS1 | SNV | Missense_Mutation | c.1006G>A | p.Asp336Asn | p.D336N | P00973 | protein_coding | tolerated(0.19) | benign(0.308) | TCGA-DY-A1DG-01 | Colorectum | rectum adenocarcinoma | Male | >=65 | I/II | Unknown | Unknown | PD | |
| OAS1 | SNV | Missense_Mutation | novel | c.58C>A | p.Leu20Ile | p.L20I | P00973 | protein_coding | deleterious(0) | probably_damaging(1) | TCGA-EI-6917-01 | Colorectum | rectum adenocarcinoma | Male | <65 | III/IV | Chemotherapy | 5fluorouracil+oxaciplatina+l-folinian | SD |
| Page: 1 2 3 4 5 |
Top |
Related drugs of malignant transformation related genes |
| Identification of chemicals and drugs interact with genes involved in malignant transfromation |
| (DGIdb 4.0) |
| Entrez ID | Symbol | Category | Interaction Types | Drug Claim Name | Drug Name | PMIDs |
| Page: 1 |

Copyright 2023-Present -The University of Texas Health Science Center at Houston |