Schematic overview of the cellular and molecular mechanisms involved in the cancer progression, including the proposed cellular and molecular mechanisms in cancer cells trajectory. AT1: alveolar type 1 cells; AT2: alveolar type 2 cells; AAH: atypical adenomatous hyperplasia; AIS: adenocarcinoma in situ; MIA: minimally invasive adenocarcinoma; IA: invasive adenocarcinoma; EMT: epithelial-mesenchymal transition

Home

Download

Statistics

Help

Contact

Center for Computational Systems Medicine
leaf

Gene summary

leaf

Malignant transformation analysis

leaf

Malignant transformation related pathway analysis

leaf

Cell-cell communication analysis

leaf

Single-cell gene regulatory network inference analysis

leaf

Somatic mutation of malignant transformation related genes

leaf

Related drugs of malignant transformation related genes

Gene: OARD1

Gene summary for OARD1

check button Gene summary.

Gene informationSpeciesHuman
Gene symbol

OARD1

Gene ID

221443

Gene nameO-acyl-ADP-ribose deacylase 1
Gene AliasC6orf130
Cytomap6p21.1
Gene Typeprotein-coding
GO ID

GO:0006139

UniProtAcc

A0A024RCY9


Top

Malignant transformation analysis

check button Identification of the aberrant gene expression in precancerous and cancerous lesions by comparing the gene expression of stem-like cells in diseased tissues with normal stem cells
check button Malignant transformation involving gene list.
Entrez IDSymbolReplicatesSpeciesOrganTissueAdj P-valueLog2FCMalignancy
221443OARD1LZE2THumanEsophagusESCC8.69e-041.18e+000.082
221443OARD1LZE3DHumanEsophagusHGIN1.69e-045.48e-010.0668
221443OARD1LZE4THumanEsophagusESCC6.11e-041.02e-010.0811
221443OARD1LZE7THumanEsophagusESCC1.73e-093.00e-010.0667
221443OARD1LZE8THumanEsophagusESCC4.25e-057.03e-020.067
221443OARD1LZE20THumanEsophagusESCC2.47e-041.41e-010.0662
221443OARD1LZE24THumanEsophagusESCC3.13e-154.63e-010.0596
221443OARD1LZE21THumanEsophagusESCC2.02e-062.78e-010.0655
221443OARD1LZE6THumanEsophagusESCC6.19e-061.95e-010.0845
221443OARD1P1T-EHumanEsophagusESCC7.24e-083.17e-010.0875
221443OARD1P2T-EHumanEsophagusESCC3.71e-254.49e-010.1177
221443OARD1P4T-EHumanEsophagusESCC4.07e-246.77e-010.1323
221443OARD1P5T-EHumanEsophagusESCC8.85e-191.87e-010.1327
221443OARD1P8T-EHumanEsophagusESCC8.26e-183.76e-010.0889
221443OARD1P9T-EHumanEsophagusESCC2.27e-201.96e-010.1131
221443OARD1P10T-EHumanEsophagusESCC1.39e-203.50e-010.116
221443OARD1P11T-EHumanEsophagusESCC1.15e-123.72e-010.1426
221443OARD1P12T-EHumanEsophagusESCC9.51e-295.19e-010.1122
221443OARD1P15T-EHumanEsophagusESCC5.48e-132.80e-010.1149
221443OARD1P16T-EHumanEsophagusESCC5.34e-297.48e-010.1153
Page: 1 2 3 4 5 6 

check button Transcriptomic changes along malignancy continuum.
TissueExpression DynamicsAbbreviation
EsophagusThe image shows the transcriptomic changes along malignancy continuum.log2FC in expression of this searched gene in stem-like cells from each diseased tissue sample relative to stem-like cells in normal samples in each tissue plotted against the malignancy continuum. Samples are colored based on if they are from different disease stage.ESCC: Esophageal squamous cell carcinoma
HGIN: High-grade intraepithelial neoplasias
LGIN: Low-grade intraepithelial neoplasias
LiverThe image shows the transcriptomic changes along malignancy continuum.log2FC in expression of this searched gene in stem-like cells from each diseased tissue sample relative to stem-like cells in normal samples in each tissue plotted against the malignancy continuum. Samples are colored based on if they are from different disease stage.HCC: Hepatocellular carcinoma
NAFLD: Non-alcoholic fatty liver disease
Oral CavityThe image shows the transcriptomic changes along malignancy continuum.log2FC in expression of this searched gene in stem-like cells from each diseased tissue sample relative to stem-like cells in normal samples in each tissue plotted against the malignancy continuum. Samples are colored based on if they are from different disease stage.
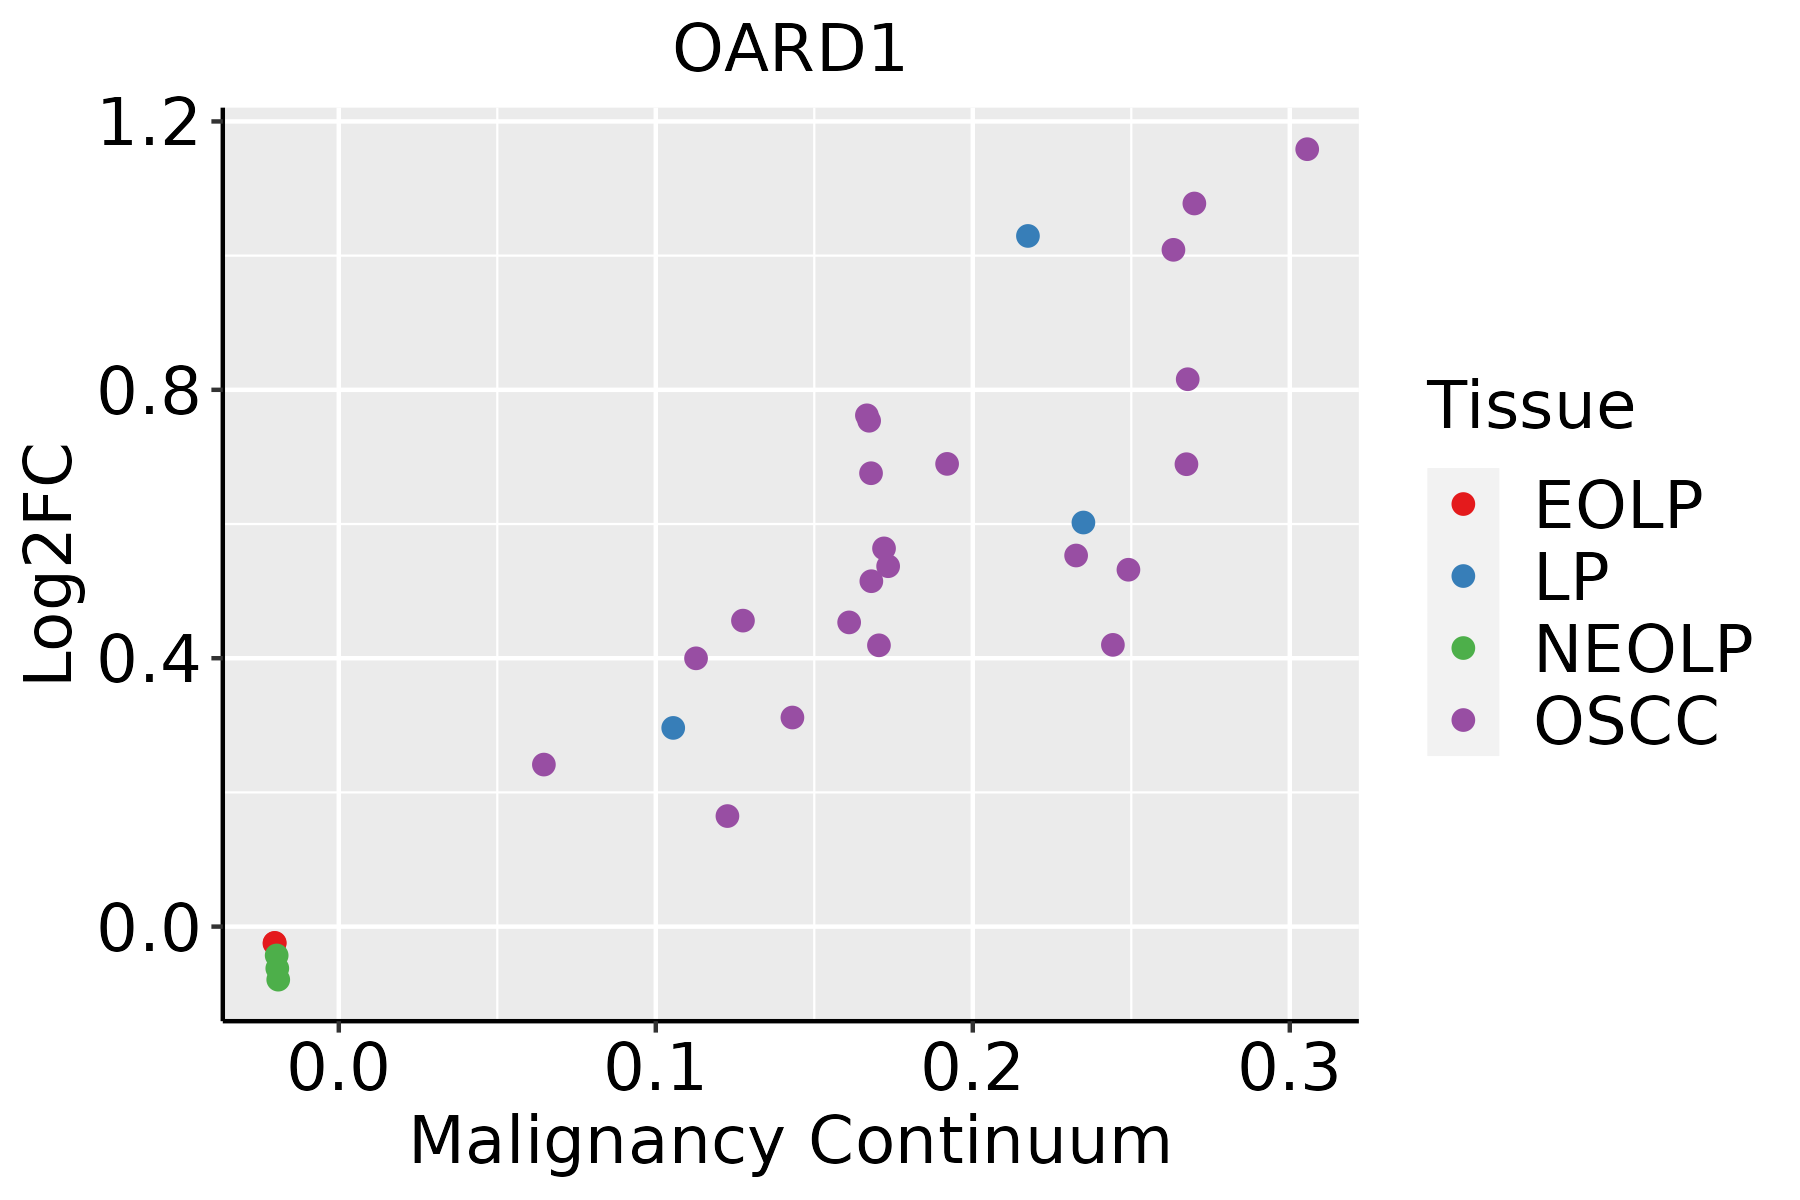
EOLP: Erosive Oral lichen planus
LP: leukoplakia
NEOLP: Non-erosive oral lichen planus
OSCC: Oral squamous cell carcinoma
SkinThe image shows the transcriptomic changes along malignancy continuum.log2FC in expression of this searched gene in stem-like cells from each diseased tissue sample relative to stem-like cells in normal samples in each tissue plotted against the malignancy continuum. Samples are colored based on if they are from different disease stage.AK: Actinic keratosis
cSCC: Cutaneous squamous cell carcinoma
SCCIS:squamous cell carcinoma in situ
ThyroidThe image shows the transcriptomic changes along malignancy continuum.log2FC in expression of this searched gene in stem-like cells from each diseased tissue sample relative to stem-like cells in normal samples in each tissue plotted against the malignancy continuum. Samples are colored based on if they are from different disease stage.ATC: Anaplastic thyroid cancer
HT: Hashimoto's thyroiditis
PTC: Papillary thyroid cancer
∗log2FC in expression of this searched gene in stem-like cells from each diseased tissue sample relative to stem-like cells in normal samples in each tissue plotted against the malignancy continuum. Samples are colored based on if they are from different disease stage.

Top

Malignant transformation related pathway analysis

check buttonFind out the enriched GO biological processes and KEGG pathways involved in transition from healthy to precancer to cancer
check button Figure of enriched GO biological processes.
TissueDisease StageEnriched GO biological Processes
ColorectumADGO analysis - Figure of enriched GO biological processes: Top 15 enriched GO BP terms are showed in the bar plot of each disease state in each tissue. Each row represents a significant GO biological process which is colored according to the -log10(p.adjust).
ColorectumSERGO analysis - Figure of enriched GO biological processes: Top 15 enriched GO BP terms are showed in the bar plot of each disease state in each tissue. Each row represents a significant GO biological process which is colored according to the -log10(p.adjust).
ColorectumMSSGO analysis - Figure of enriched GO biological processes: Top 15 enriched GO BP terms are showed in the bar plot of each disease state in each tissue. Each row represents a significant GO biological process which is colored according to the -log10(p.adjust).
ColorectumMSI-HGO analysis - Figure of enriched GO biological processes: Top 15 enriched GO BP terms are showed in the bar plot of each disease state in each tissue. Each row represents a significant GO biological process which is colored according to the -log10(p.adjust).
ColorectumFAPGO analysis - Figure of enriched GO biological processes: Top 15 enriched GO BP terms are showed in the bar plot of each disease state in each tissue. Each row represents a significant GO biological process which is colored according to the -log10(p.adjust).
∗Top 15 enriched GO BP terms are showed in the bar plot of each disease state in each tissue. Each row represents a significant GO biological process which is colored according to the -log10(p.adjust).
Page: 1 2 3 4 5 6 7 8 9 

check button Enriched GO biological processes.
GO IDTissueDisease StageDescriptionGene RatioBg Ratiopvaluep.adjustCount
GO:0072521111EsophagusESCCpurine-containing compound metabolic process238/8552416/187231.20e-061.49e-05238
GO:19016574EsophagusESCCglycosyl compound metabolic process57/855288/187232.32e-041.44e-0357
GO:00091163EsophagusESCCnucleoside metabolic process39/855262/187234.68e-031.82e-0239
GO:007252112LiverCirrhoticpurine-containing compound metabolic process156/4634416/187233.74e-091.52e-07156
GO:19016572LiverCirrhoticglycosyl compound metabolic process37/463488/187232.70e-042.40e-0337
GO:0042278LiverCirrhoticpurine nucleoside metabolic process13/463426/187234.72e-032.48e-0213
GO:0009116LiverCirrhoticnucleoside metabolic process25/463462/187234.90e-032.56e-0225
GO:007252122LiverHCCpurine-containing compound metabolic process250/7958416/187232.26e-131.24e-11250
GO:19016571LiverHCCglycosyl compound metabolic process55/795888/187231.20e-041.01e-0355
GO:00091161LiverHCCnucleoside metabolic process37/795862/187234.73e-032.02e-0237
GO:19016573Oral cavityOSCCglycosyl compound metabolic process52/730588/187231.06e-047.84e-0452
GO:007252120Oral cavityOSCCpurine-containing compound metabolic process199/7305416/187231.34e-049.53e-04199
GO:00091162Oral cavityOSCCnucleoside metabolic process37/730562/187237.79e-044.23e-0337
GO:190165711Oral cavityLPglycosyl compound metabolic process43/462388/187237.80e-072.05e-0543
GO:000911611Oral cavityLPnucleoside metabolic process31/462362/187231.46e-052.57e-0431
GO:0072521110Oral cavityLPpurine-containing compound metabolic process130/4623416/187231.30e-031.05e-02130
GO:00422781Oral cavityLPpurine nucleoside metabolic process14/462326/187231.33e-031.07e-0214
GO:0072521112SkincSCCpurine-containing compound metabolic process150/4864416/187232.88e-064.54e-05150
GO:19016575SkincSCCglycosyl compound metabolic process37/486488/187237.39e-045.15e-0337
GO:00091164SkincSCCnucleoside metabolic process27/486462/187231.99e-031.19e-0227
Page: 1 2 

check button Enriched KEGG pathways.
Pathway IDTissueDisease StageDescriptionGene RatioBg Ratiopvaluep.adjustqvalueCount
Page: 1 

Top

Cell-cell communication analysis

check buttonIdentification of potential cell-cell interactions between two cell types and their ligand-receptor pairs for different disease states
LigandReceptorLRpairPathwayTissueDisease Stage
Page: 1 

Top

Single-cell gene regulatory network inference analysis

check buttonFind out the significant the regulons (TFs) and the target genes of each regulon across cell types for different disease states
TFCell TypeTissueDisease StageTarget GeneRSSRegulon Activity
∗The dot plots of a searched regulon are shown for all cell subpopulations in each disease state of each tissue based on the regulon specific score inferred using pySCENIC and by calculating the average expression.
Page: 1 

Top

Somatic mutation of malignant transformation related genes

check buttonAnnotation of somatic variants for genes involved in malignant transformation
Hugo SymbolVariant ClassVariant ClassificationdbSNP RSHGVScHGVSpHGVSp ShortSWISSPROTBIOTYPESIFTPolyPhenTumor Sample BarcodeTissueHistologySexAgeStageTherapy TypesDrugsOutcome
OARD1SNVMissense_Mutationrs770268622c.263C>Tp.Ser88Leup.S88LQ9Y530protein_codingtolerated(0.64)benign(0.214)TCGA-AN-A046-01Breastbreast invasive carcinomaFemale>=65I/IIUnknownUnknownSD
OARD1SNVMissense_Mutationrs770268622c.263N>Tp.Ser88Leup.S88LQ9Y530protein_codingtolerated(0.64)benign(0.214)TCGA-C5-A1BK-01Cervixcervical & endocervical cancerFemale<65I/IIUnknownUnknownSD
OARD1SNVMissense_Mutationrs769331533c.376N>Tp.Arg126Cysp.R126CQ9Y530protein_codingdeleterious(0.01)possibly_damaging(0.869)TCGA-AZ-4315-01Colorectumcolon adenocarcinomaMale<65I/IIUnknownUnknownSD
OARD1SNVMissense_Mutationrs769331533c.376C>Tp.Arg126Cysp.R126CQ9Y530protein_codingdeleterious(0.01)possibly_damaging(0.869)TCGA-F5-6814-01Colorectumrectum adenocarcinomaMale<65I/IIUnknownUnknownSD
OARD1SNVMissense_Mutationnovelc.343N>Ap.Leu115Ilep.L115IQ9Y530protein_codingtolerated(0.69)benign(0.012)TCGA-A5-A0G2-01Endometriumuterine corpus endometrioid carcinomaFemale<65III/IVUnknownUnknownSD
OARD1SNVMissense_Mutationrs529411165c.409N>Ap.Glu137Lysp.E137KQ9Y530protein_codingtolerated(0.49)benign(0.001)TCGA-AP-A0LM-01Endometriumuterine corpus endometrioid carcinomaFemale<65III/IVChemotherapycisplatinSD
OARD1SNVMissense_Mutationc.445N>Ap.Val149Metp.V149MQ9Y530protein_codingdeleterious(0)probably_damaging(0.958)TCGA-AP-A0LP-01Endometriumuterine corpus endometrioid carcinomaFemale>=65I/IIHormone TherapymegaceSD
OARD1SNVMissense_Mutationnovelc.150N>Tp.Lys50Asnp.K50NQ9Y530protein_codingtolerated(0.24)possibly_damaging(0.779)TCGA-B5-A1MR-01Endometriumuterine corpus endometrioid carcinomaFemale>=65III/IVUnknownUnknownSD
OARD1SNVMissense_Mutationrs529411165c.409N>Ap.Glu137Lysp.E137KQ9Y530protein_codingtolerated(0.49)benign(0.001)TCGA-BS-A0UV-01Endometriumuterine corpus endometrioid carcinomaFemale<65III/IVUnknownUnknownSD
OARD1SNVMissense_Mutationnovelc.4N>Ap.Ala2Thrp.A2TQ9Y530protein_codingtolerated_low_confidence(0.17)benign(0)TCGA-E6-A1LX-01Endometriumuterine corpus endometrioid carcinomaFemale<65I/IIUnknownUnknownSD
Page: 1 2 

Top

Related drugs of malignant transformation related genes

check buttonIdentification of chemicals and drugs interact with genes involved in malignant transfromation
(DGIdb 4.0)
Entrez IDSymbolCategoryInteraction TypesDrug Claim NameDrug NamePMIDs
Page: 1