
|
|||||
|
 | |
| |
| |
| |
| |
| |
|
Gene: OAF |
Gene summary for OAF |
| Gene information | Species | Human | Gene symbol | OAF | Gene ID | 220323 |
| Gene name | out at first homolog | |
| Gene Alias | NS5ATP13TP2 | |
| Cytomap | 11q23.3 | |
| Gene Type | protein-coding | GO ID | NA | UniProtAcc | Q86UD1 |
Top |
Malignant transformation analysis |
| Identification of the aberrant gene expression in precancerous and cancerous lesions by comparing the gene expression of stem-like cells in diseased tissues with normal stem cells |
| Entrez ID | Symbol | Replicates | Species | Organ | Tissue | Adj P-value | Log2FC | Malignancy |
| 220323 | OAF | HTA11_2487_2000001011 | Human | Colorectum | SER | 3.13e-11 | 5.92e-01 | -0.1808 |
| 220323 | OAF | HTA11_78_2000001011 | Human | Colorectum | AD | 8.70e-04 | 3.80e-01 | -0.1088 |
| 220323 | OAF | HTA11_347_2000001011 | Human | Colorectum | AD | 1.80e-29 | 9.14e-01 | -0.1954 |
| 220323 | OAF | HTA11_411_2000001011 | Human | Colorectum | SER | 1.95e-04 | 1.01e+00 | -0.2602 |
| 220323 | OAF | HTA11_2112_2000001011 | Human | Colorectum | SER | 9.16e-06 | 8.96e-01 | -0.2196 |
| 220323 | OAF | HTA11_83_2000001011 | Human | Colorectum | SER | 9.16e-04 | 5.16e-01 | -0.1526 |
| 220323 | OAF | HTA11_696_2000001011 | Human | Colorectum | AD | 2.17e-18 | 9.10e-01 | -0.1464 |
| 220323 | OAF | HTA11_866_2000001011 | Human | Colorectum | AD | 3.25e-05 | 4.41e-01 | -0.1001 |
| 220323 | OAF | HTA11_1391_2000001011 | Human | Colorectum | AD | 4.62e-12 | 5.63e-01 | -0.059 |
| 220323 | OAF | HTA11_2992_2000001011 | Human | Colorectum | SER | 1.89e-02 | 7.18e-01 | -0.1706 |
| 220323 | OAF | HTA11_4255_2000001011 | Human | Colorectum | SER | 3.07e-03 | 4.75e-01 | 0.0446 |
| 220323 | OAF | HTA11_99999971662_82457 | Human | Colorectum | MSS | 2.15e-06 | 4.96e-01 | 0.3859 |
| 220323 | OAF | HTA11_99999973899_84307 | Human | Colorectum | MSS | 2.92e-04 | 6.07e-01 | 0.2585 |
| 220323 | OAF | A015-C-203 | Human | Colorectum | FAP | 8.52e-08 | -2.01e-01 | -0.1294 |
| 220323 | OAF | A002-C-201 | Human | Colorectum | FAP | 3.26e-02 | -1.53e-01 | 0.0324 |
| 220323 | OAF | A001-C-108 | Human | Colorectum | FAP | 2.00e-05 | -1.92e-01 | -0.0272 |
| 220323 | OAF | A002-C-205 | Human | Colorectum | FAP | 6.44e-06 | -2.42e-01 | -0.1236 |
| 220323 | OAF | A002-C-114 | Human | Colorectum | FAP | 2.24e-02 | -1.71e-01 | -0.1561 |
| 220323 | OAF | A015-C-104 | Human | Colorectum | FAP | 6.28e-10 | -2.35e-01 | -0.1899 |
| 220323 | OAF | A001-C-014 | Human | Colorectum | FAP | 2.06e-03 | -2.09e-01 | 0.0135 |
| Page: 1 2 3 4 5 6 7 |
| Tissue | Expression Dynamics | Abbreviation |
| Colorectum (GSE201348) |  | FAP: Familial adenomatous polyposis |
| CRC: Colorectal cancer | ||
| Colorectum (HTA11) |  | AD: Adenomas |
| SER: Sessile serrated lesions | ||
| MSI-H: Microsatellite-high colorectal cancer | ||
| MSS: Microsatellite stable colorectal cancer | ||
| Endometrium | 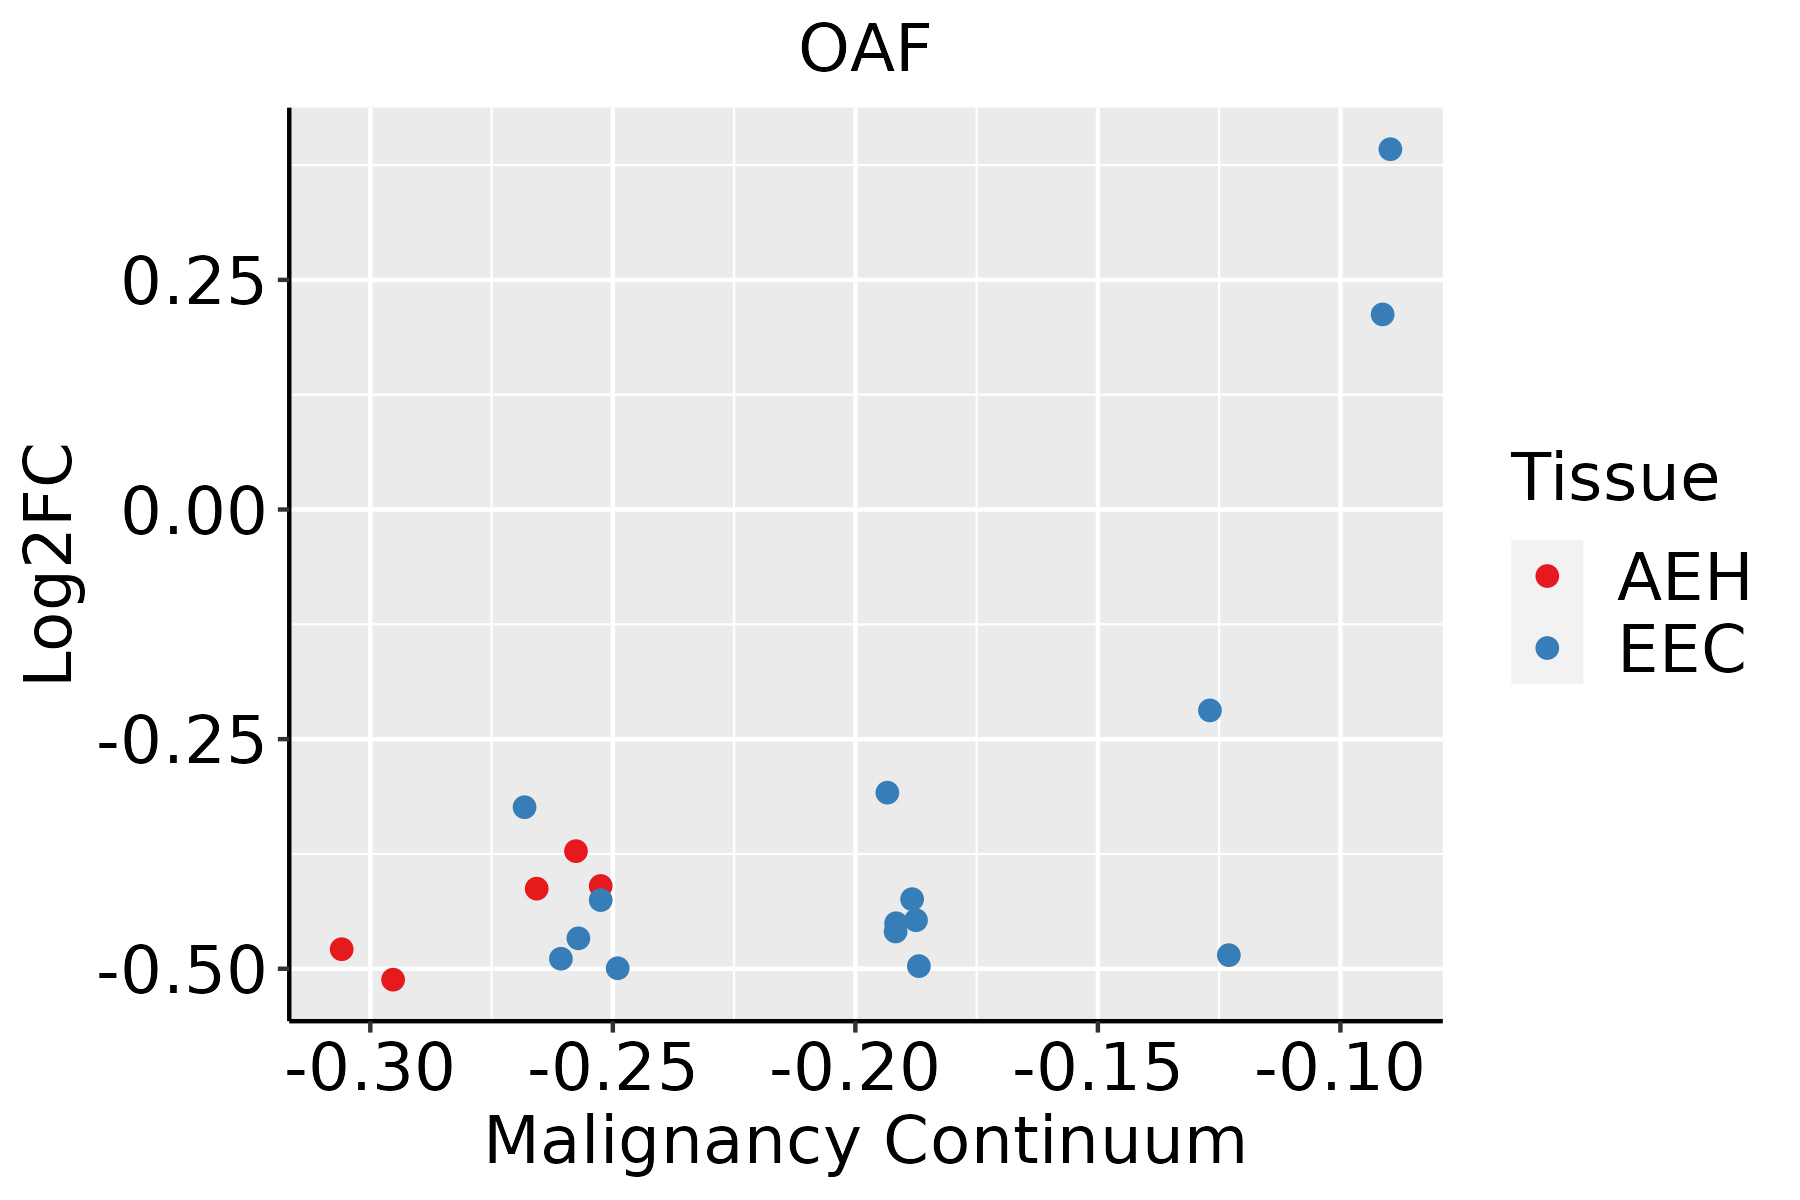 | AEH: Atypical endometrial hyperplasia |
| EEC: Endometrioid Cancer | ||
| Esophagus |  | ESCC: Esophageal squamous cell carcinoma |
| HGIN: High-grade intraepithelial neoplasias | ||
| LGIN: Low-grade intraepithelial neoplasias | ||
| Liver |  | HCC: Hepatocellular carcinoma |
| NAFLD: Non-alcoholic fatty liver disease | ||
| Oral Cavity | 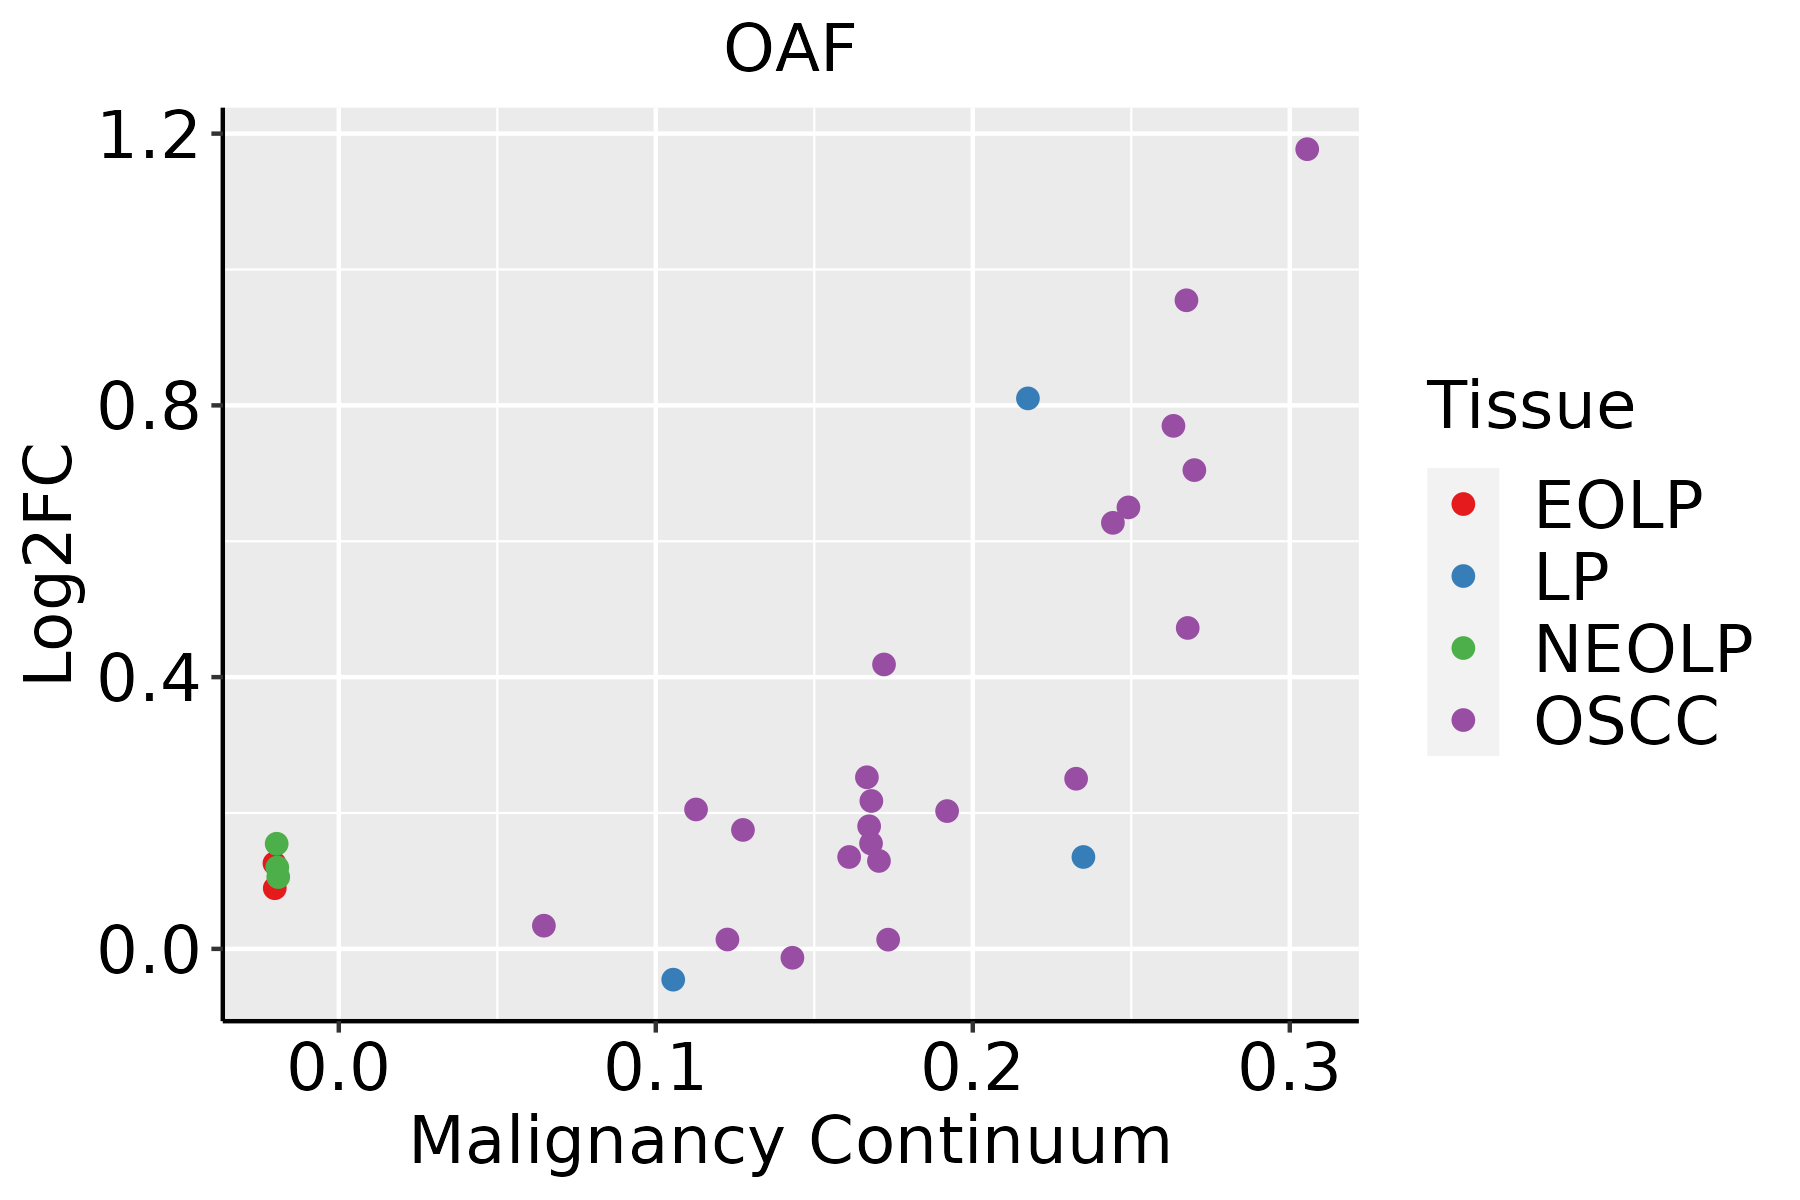 | EOLP: Erosive Oral lichen planus |
| LP: leukoplakia | ||
| NEOLP: Non-erosive oral lichen planus | ||
| OSCC: Oral squamous cell carcinoma | ||
| Thyroid | 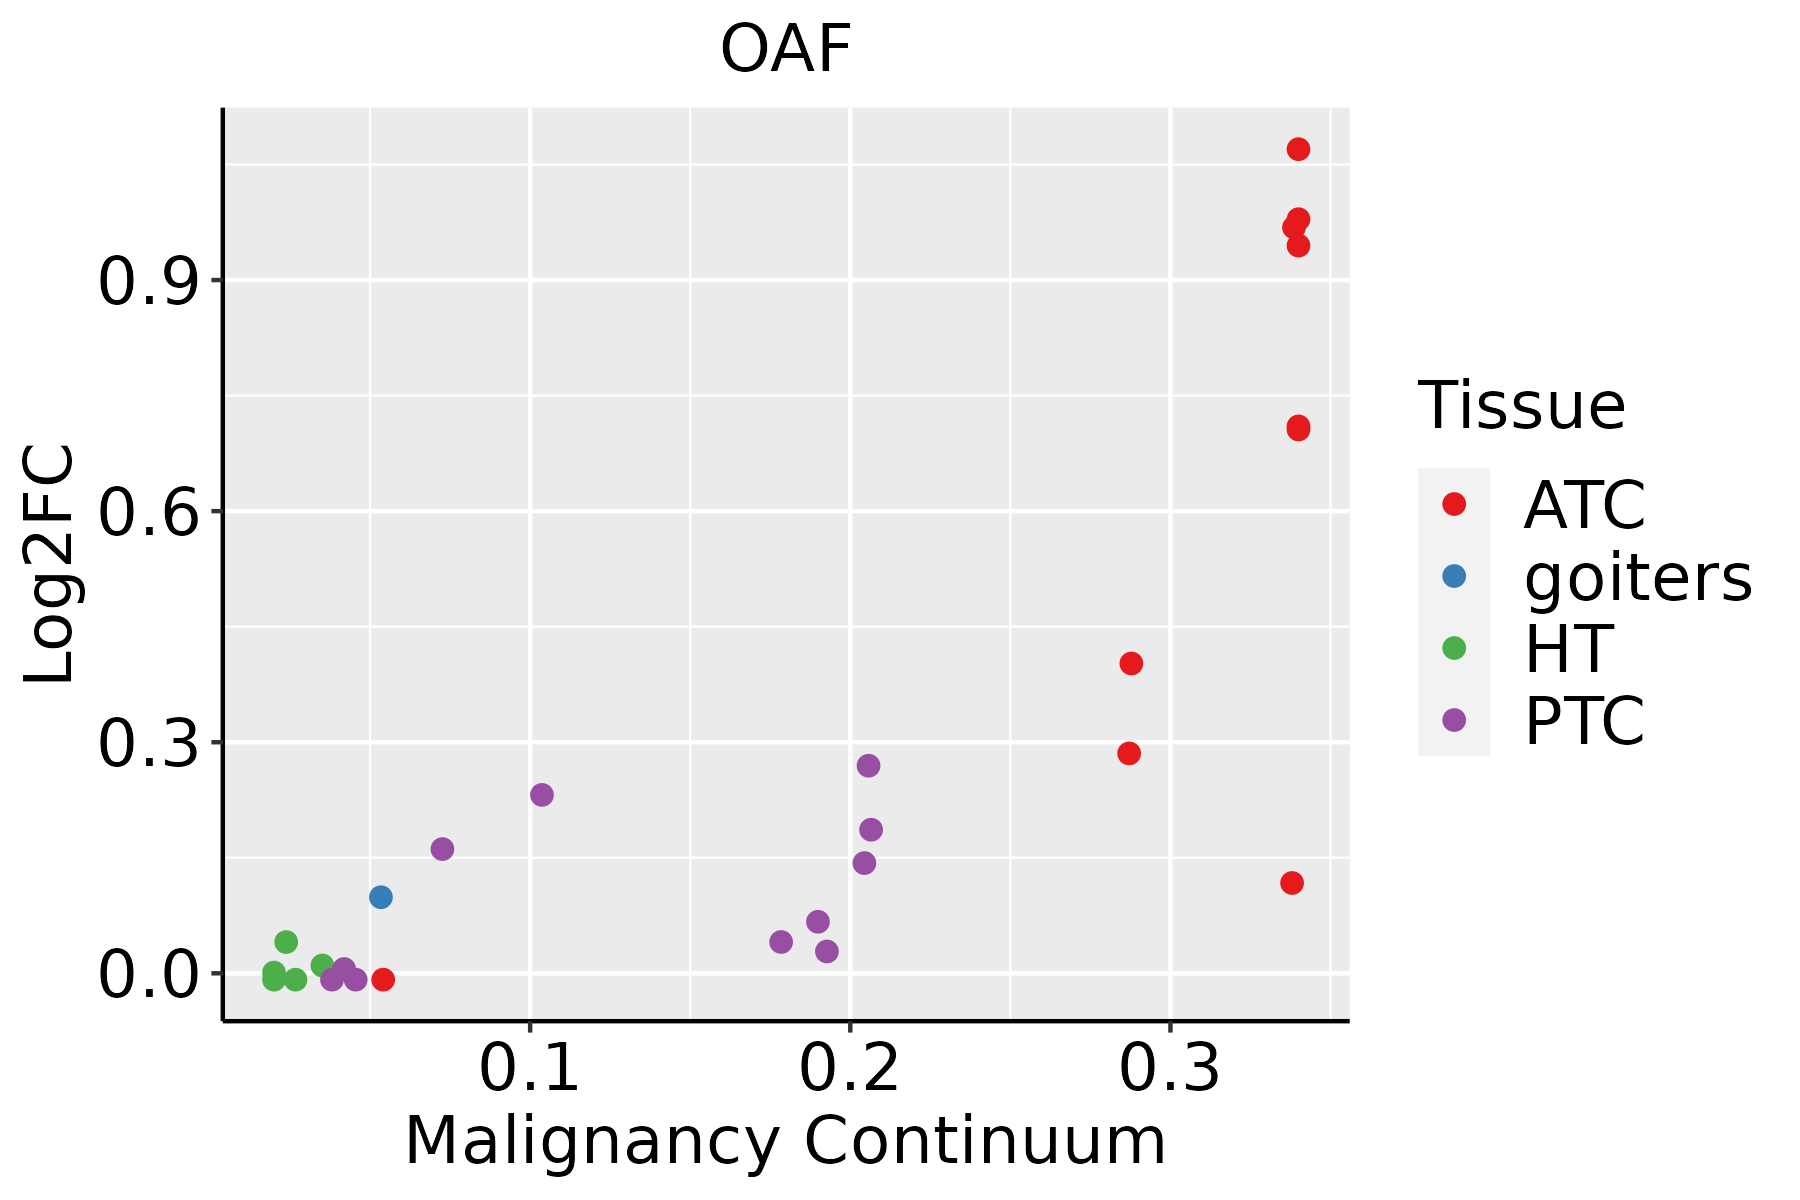 | ATC: Anaplastic thyroid cancer |
| HT: Hashimoto's thyroiditis | ||
| PTC: Papillary thyroid cancer |
| ∗log2FC in expression of this searched gene in stem-like cells from each diseased tissue sample relative to stem-like cells in normal samples in each tissue plotted against the malignancy continuum. Samples are colored based on if they are from different disease stage. |
Top |
Malignant transformation related pathway analysis |
| Find out the enriched GO biological processes and KEGG pathways involved in transition from healthy to precancer to cancer |
| Tissue | Disease Stage | Enriched GO biological Processes |
| Colorectum | AD |  |
| Colorectum | SER |  |
| Colorectum | MSS |  |
| Colorectum | MSI-H |  |
| Colorectum | FAP |  |
| ∗Top 15 enriched GO BP terms are showed in the bar plot of each disease state in each tissue. Each row represents a significant GO biological process which is colored according to the -log10(p.adjust). |
| Page: 1 2 3 4 5 6 7 8 9 |
| GO ID | Tissue | Disease Stage | Description | Gene Ratio | Bg Ratio | pvalue | p.adjust | Count |
| Page: 1 |
| Pathway ID | Tissue | Disease Stage | Description | Gene Ratio | Bg Ratio | pvalue | p.adjust | qvalue | Count |
| Page: 1 |
Top |
Cell-cell communication analysis |
| Identification of potential cell-cell interactions between two cell types and their ligand-receptor pairs for different disease states |
| Ligand | Receptor | LRpair | Pathway | Tissue | Disease Stage |
| Page: 1 |
Top |
Single-cell gene regulatory network inference analysis |
| Find out the significant the regulons (TFs) and the target genes of each regulon across cell types for different disease states |
| TF | Cell Type | Tissue | Disease Stage | Target Gene | RSS | Regulon Activity |
| ∗The dot plots of a searched regulon are shown for all cell subpopulations in each disease state of each tissue based on the regulon specific score inferred using pySCENIC and by calculating the average expression. |
| Page: 1 |
Top |
Somatic mutation of malignant transformation related genes |
| Annotation of somatic variants for genes involved in malignant transformation |
| Hugo Symbol | Variant Class | Variant Classification | dbSNP RS | HGVSc | HGVSp | HGVSp Short | SWISSPROT | BIOTYPE | SIFT | PolyPhen | Tumor Sample Barcode | Tissue | Histology | Sex | Age | Stage | Therapy Types | Drugs | Outcome |
| OAF | SNV | Missense_Mutation | novel | c.640N>G | p.Cys214Gly | p.C214G | Q86UD1 | protein_coding | deleterious(0.01) | probably_damaging(0.996) | TCGA-5M-AAT6-01 | Colorectum | colon adenocarcinoma | Female | <65 | III/IV | Unknown | Unknown | PD |
| OAF | SNV | Missense_Mutation | c.137N>T | p.Glu46Val | p.E46V | Q86UD1 | protein_coding | deleterious(0) | probably_damaging(0.998) | TCGA-AD-6895-01 | Colorectum | colon adenocarcinoma | Male | >=65 | III/IV | Unknown | Unknown | SD | |
| OAF | SNV | Missense_Mutation | rs773363476 | c.377G>A | p.Arg126Gln | p.R126Q | Q86UD1 | protein_coding | tolerated(0.3) | benign(0.036) | TCGA-DM-A1HB-01 | Colorectum | colon adenocarcinoma | Male | >=65 | III/IV | Unknown | Unknown | SD |
| OAF | SNV | Missense_Mutation | novel | c.701N>T | p.Ser234Ile | p.S234I | Q86UD1 | protein_coding | deleterious(0.01) | possibly_damaging(0.804) | TCGA-A5-A1OF-01 | Endometrium | uterine corpus endometrioid carcinoma | Female | <65 | I/II | Unknown | Unknown | SD |
| OAF | SNV | Missense_Mutation | novel | c.770N>G | p.Tyr257Cys | p.Y257C | Q86UD1 | protein_coding | deleterious(0) | probably_damaging(0.912) | TCGA-AJ-A3OJ-01 | Endometrium | uterine corpus endometrioid carcinoma | Female | <65 | I/II | Chemotherapy | carboplatin | CR |
| OAF | SNV | Missense_Mutation | rs745479682 | c.710N>A | p.Arg237Gln | p.R237Q | Q86UD1 | protein_coding | tolerated(0.15) | possibly_damaging(0.62) | TCGA-AX-A1CE-01 | Endometrium | uterine corpus endometrioid carcinoma | Female | <65 | I/II | Unspecific | Paclitaxel | SD |
| OAF | SNV | Missense_Mutation | novel | c.418N>A | p.Leu140Met | p.L140M | Q86UD1 | protein_coding | tolerated(0.19) | benign(0.179) | TCGA-AX-A2HC-01 | Endometrium | uterine corpus endometrioid carcinoma | Female | <65 | III/IV | Chemotherapy | paclitaxel | PD |
| OAF | SNV | Missense_Mutation | rs767017386 | c.636N>T | p.Lys212Asn | p.K212N | Q86UD1 | protein_coding | tolerated(0.1) | possibly_damaging(0.544) | TCGA-AX-A2HD-01 | Endometrium | uterine corpus endometrioid carcinoma | Female | >=65 | III/IV | Unknown | Unknown | SD |
| OAF | SNV | Missense_Mutation | novel | c.628N>T | p.His210Tyr | p.H210Y | Q86UD1 | protein_coding | tolerated(1) | benign(0.003) | TCGA-B5-A3FC-01 | Endometrium | uterine corpus endometrioid carcinoma | Female | <65 | I/II | Unknown | Unknown | SD |
| OAF | SNV | Missense_Mutation | novel | c.248N>A | p.Arg83Gln | p.R83Q | Q86UD1 | protein_coding | deleterious(0) | possibly_damaging(0.873) | TCGA-BK-A6W3-01 | Endometrium | uterine corpus endometrioid carcinoma | Female | <65 | I/II | Unknown | Unknown | SD |
| Page: 1 2 3 |
Top |
Related drugs of malignant transformation related genes |
| Identification of chemicals and drugs interact with genes involved in malignant transfromation |
| (DGIdb 4.0) |
| Entrez ID | Symbol | Category | Interaction Types | Drug Claim Name | Drug Name | PMIDs |
| Page: 1 |

Copyright 2023-Present -The University of Texas Health Science Center at Houston |