
|
|||||
|
 | |
| |
| |
| |
| |
| |
|
Gene: NYNRIN |
Gene summary for NYNRIN |
| Gene information | Species | Human | Gene symbol | NYNRIN | Gene ID | 57523 |
| Gene name | NYN domain and retroviral integrase containing | |
| Gene Alias | CGIN1 | |
| Cytomap | 14q12 | |
| Gene Type | protein-coding | GO ID | GO:0006139 | UniProtAcc | Q9P2P1 |
Top |
Malignant transformation analysis |
| Identification of the aberrant gene expression in precancerous and cancerous lesions by comparing the gene expression of stem-like cells in diseased tissues with normal stem cells |
| Entrez ID | Symbol | Replicates | Species | Organ | Tissue | Adj P-value | Log2FC | Malignancy |
| 57523 | NYNRIN | LZE5T | Human | Esophagus | ESCC | 5.72e-03 | 2.94e-01 | 0.0514 |
| 57523 | NYNRIN | LZE8T | Human | Esophagus | ESCC | 9.98e-03 | 1.07e-01 | 0.067 |
| 57523 | NYNRIN | LZE24T | Human | Esophagus | ESCC | 9.49e-08 | 2.58e-01 | 0.0596 |
| 57523 | NYNRIN | P2T-E | Human | Esophagus | ESCC | 2.94e-06 | 1.61e-01 | 0.1177 |
| 57523 | NYNRIN | P4T-E | Human | Esophagus | ESCC | 4.21e-06 | 2.27e-01 | 0.1323 |
| 57523 | NYNRIN | P5T-E | Human | Esophagus | ESCC | 8.79e-07 | 8.28e-02 | 0.1327 |
| 57523 | NYNRIN | P8T-E | Human | Esophagus | ESCC | 3.05e-14 | 3.45e-01 | 0.0889 |
| 57523 | NYNRIN | P9T-E | Human | Esophagus | ESCC | 1.49e-02 | 5.87e-02 | 0.1131 |
| 57523 | NYNRIN | P10T-E | Human | Esophagus | ESCC | 2.36e-21 | 3.49e-01 | 0.116 |
| 57523 | NYNRIN | P12T-E | Human | Esophagus | ESCC | 6.70e-38 | 7.47e-01 | 0.1122 |
| 57523 | NYNRIN | P15T-E | Human | Esophagus | ESCC | 2.49e-10 | 3.42e-01 | 0.1149 |
| 57523 | NYNRIN | P22T-E | Human | Esophagus | ESCC | 5.45e-06 | 1.59e-01 | 0.1236 |
| 57523 | NYNRIN | P23T-E | Human | Esophagus | ESCC | 6.54e-10 | 1.93e-01 | 0.108 |
| 57523 | NYNRIN | P26T-E | Human | Esophagus | ESCC | 3.86e-10 | 1.94e-01 | 0.1276 |
| 57523 | NYNRIN | P27T-E | Human | Esophagus | ESCC | 1.96e-15 | 2.91e-01 | 0.1055 |
| 57523 | NYNRIN | P28T-E | Human | Esophagus | ESCC | 4.39e-10 | 2.46e-01 | 0.1149 |
| 57523 | NYNRIN | P39T-E | Human | Esophagus | ESCC | 9.78e-05 | 1.08e-01 | 0.0894 |
| 57523 | NYNRIN | P48T-E | Human | Esophagus | ESCC | 3.05e-04 | 9.04e-02 | 0.0959 |
| 57523 | NYNRIN | P49T-E | Human | Esophagus | ESCC | 1.98e-05 | 5.84e-01 | 0.1768 |
| 57523 | NYNRIN | P57T-E | Human | Esophagus | ESCC | 1.66e-09 | 2.18e-01 | 0.0926 |
| Page: 1 2 |
| Tissue | Expression Dynamics | Abbreviation |
| Esophagus | 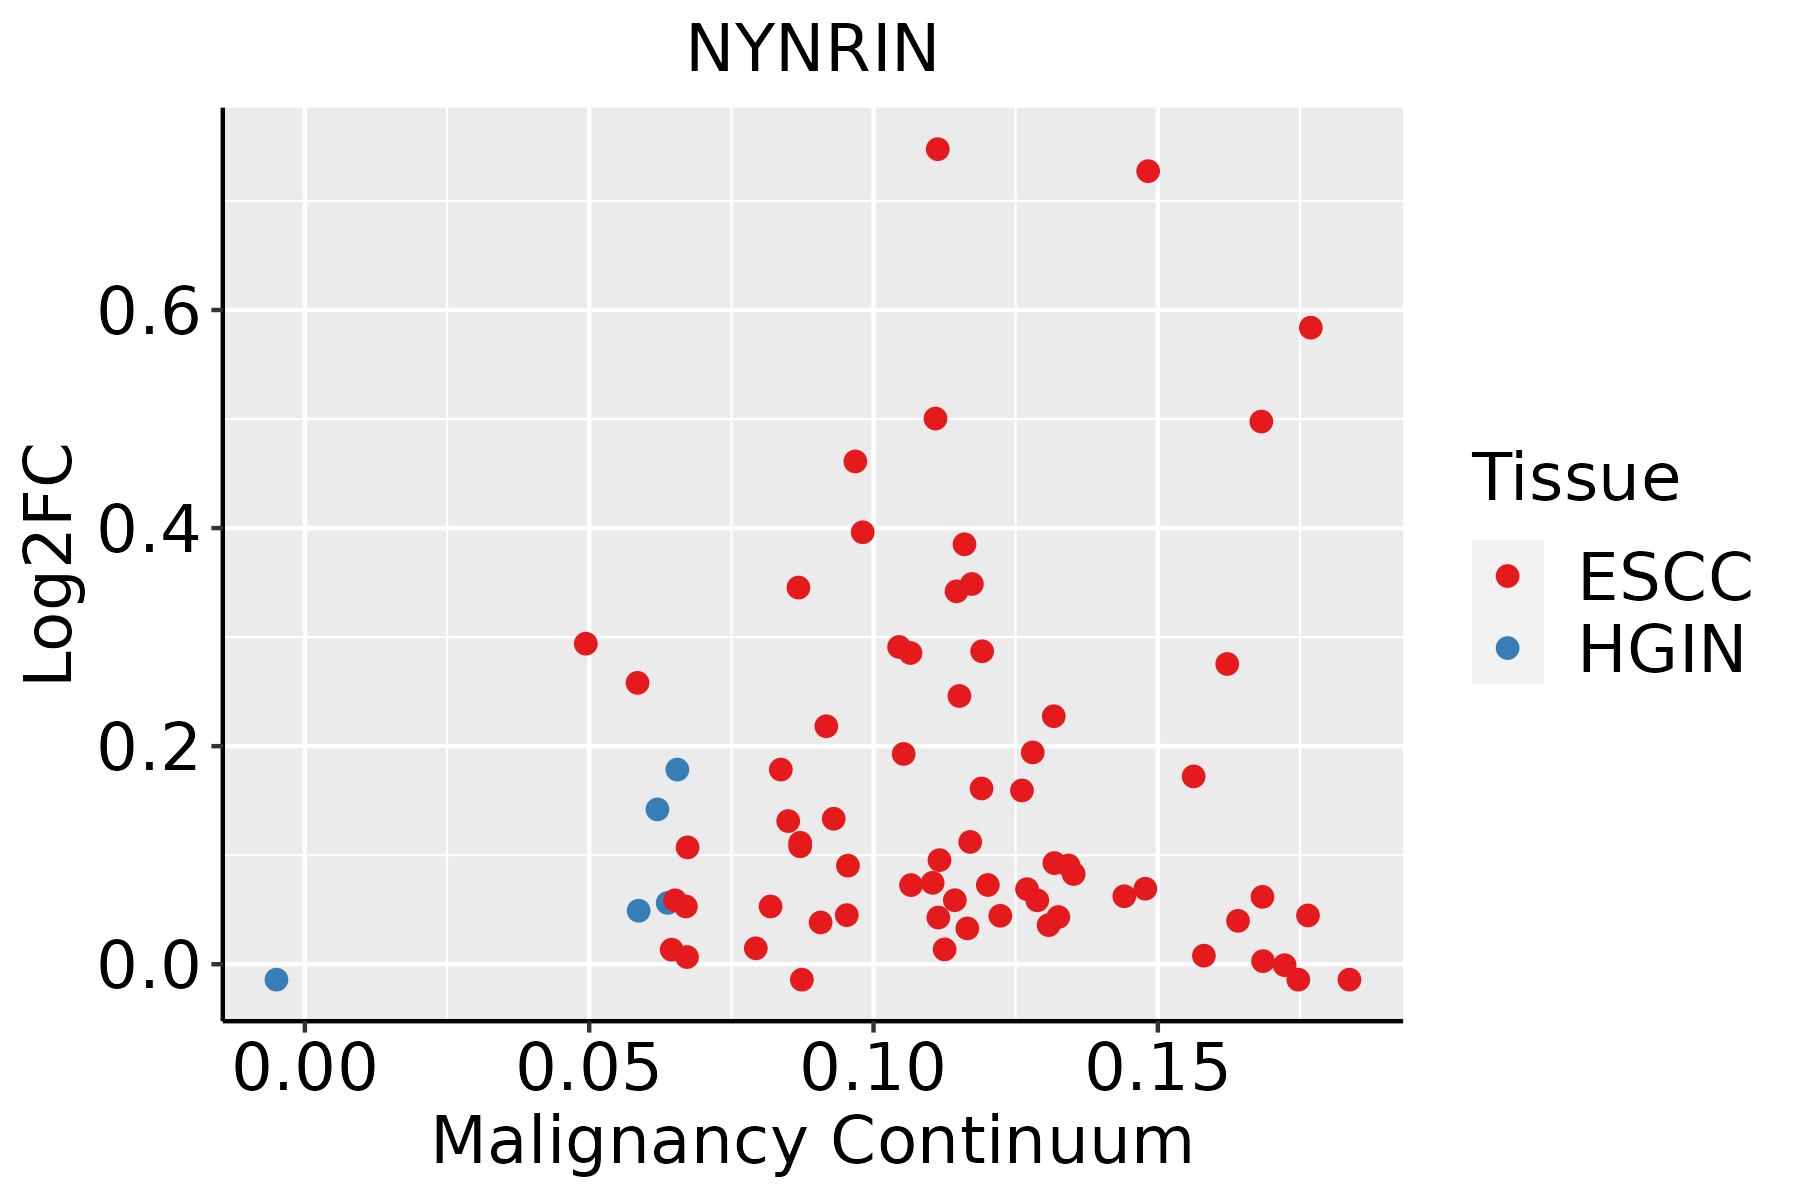 | ESCC: Esophageal squamous cell carcinoma |
| HGIN: High-grade intraepithelial neoplasias | ||
| LGIN: Low-grade intraepithelial neoplasias |
| ∗log2FC in expression of this searched gene in stem-like cells from each diseased tissue sample relative to stem-like cells in normal samples in each tissue plotted against the malignancy continuum. Samples are colored based on if they are from different disease stage. |
Top |
Malignant transformation related pathway analysis |
| Find out the enriched GO biological processes and KEGG pathways involved in transition from healthy to precancer to cancer |
| Tissue | Disease Stage | Enriched GO biological Processes |
| Colorectum | AD |  |
| Colorectum | SER |  |
| Colorectum | MSS |  |
| Colorectum | MSI-H |  |
| Colorectum | FAP |  |
| ∗Top 15 enriched GO BP terms are showed in the bar plot of each disease state in each tissue. Each row represents a significant GO biological process which is colored according to the -log10(p.adjust). |
| Page: 1 2 3 4 5 6 7 8 9 |
| GO ID | Tissue | Disease Stage | Description | Gene Ratio | Bg Ratio | pvalue | p.adjust | Count |
| GO:00905013 | Esophagus | ESCC | RNA phosphodiester bond hydrolysis | 110/8552 | 152/18723 | 1.95e-11 | 6.81e-10 | 110 |
| GO:00903053 | Esophagus | ESCC | nucleic acid phosphodiester bond hydrolysis | 163/8552 | 261/18723 | 3.07e-08 | 5.73e-07 | 163 |
| GO:00905023 | Esophagus | ESCC | RNA phosphodiester bond hydrolysis, endonucleolytic | 55/8552 | 82/18723 | 7.34e-05 | 5.51e-04 | 55 |
| Page: 1 |
| Pathway ID | Tissue | Disease Stage | Description | Gene Ratio | Bg Ratio | pvalue | p.adjust | qvalue | Count |
| Page: 1 |
Top |
Cell-cell communication analysis |
| Identification of potential cell-cell interactions between two cell types and their ligand-receptor pairs for different disease states |
| Ligand | Receptor | LRpair | Pathway | Tissue | Disease Stage |
| Page: 1 |
Top |
Single-cell gene regulatory network inference analysis |
| Find out the significant the regulons (TFs) and the target genes of each regulon across cell types for different disease states |
| TF | Cell Type | Tissue | Disease Stage | Target Gene | RSS | Regulon Activity |
| ∗The dot plots of a searched regulon are shown for all cell subpopulations in each disease state of each tissue based on the regulon specific score inferred using pySCENIC and by calculating the average expression. |
| Page: 1 |
Top |
Somatic mutation of malignant transformation related genes |
| Annotation of somatic variants for genes involved in malignant transformation |
| Hugo Symbol | Variant Class | Variant Classification | dbSNP RS | HGVSc | HGVSp | HGVSp Short | SWISSPROT | BIOTYPE | SIFT | PolyPhen | Tumor Sample Barcode | Tissue | Histology | Sex | Age | Stage | Therapy Types | Drugs | Outcome |
| NYNRIN | SNV | Missense_Mutation | rs201775736 | c.3118N>T | p.Arg1040Trp | p.R1040W | Q9P2P1 | protein_coding | tolerated_low_confidence(0.07) | possibly_damaging(0.467) | TCGA-A2-A4S2-01 | Breast | breast invasive carcinoma | Female | <65 | III/IV | Chemotherapy | adriamycin | CR |
| NYNRIN | SNV | Missense_Mutation | c.941A>T | p.Asn314Ile | p.N314I | Q9P2P1 | protein_coding | deleterious_low_confidence(0.04) | benign(0.007) | TCGA-A8-A08F-01 | Breast | breast invasive carcinoma | Female | <65 | III/IV | Chemotherapy | 5-fluorouracil | CR | |
| NYNRIN | SNV | Missense_Mutation | rs758775630 | c.5060N>A | p.Arg1687Gln | p.R1687Q | Q9P2P1 | protein_coding | deleterious_low_confidence(0.01) | probably_damaging(0.962) | TCGA-AN-A046-01 | Breast | breast invasive carcinoma | Female | >=65 | I/II | Unknown | Unknown | SD |
| NYNRIN | SNV | Missense_Mutation | novel | c.5610N>T | p.Glu1870Asp | p.E1870D | Q9P2P1 | protein_coding | tolerated_low_confidence(0.09) | benign(0.003) | TCGA-AN-A046-01 | Breast | breast invasive carcinoma | Female | >=65 | I/II | Unknown | Unknown | SD |
| NYNRIN | SNV | Missense_Mutation | rs746050976 | c.4844N>T | p.Ser1615Leu | p.S1615L | Q9P2P1 | protein_coding | deleterious(0) | benign(0.091) | TCGA-AR-A0TY-01 | Breast | breast invasive carcinoma | Female | <65 | I/II | Unspecific | Paclitaxel | PD |
| NYNRIN | SNV | Missense_Mutation | rs773733347 | c.433N>G | p.Pro145Ala | p.P145A | Q9P2P1 | protein_coding | deleterious_low_confidence(0.01) | benign(0.003) | TCGA-AR-A24H-01 | Breast | breast invasive carcinoma | Female | >=65 | I/II | Hormone Therapy | tamoxiphen | SD |
| NYNRIN | SNV | Missense_Mutation | c.3331N>C | p.Tyr1111His | p.Y1111H | Q9P2P1 | protein_coding | deleterious(0) | probably_damaging(0.96) | TCGA-B6-A0I6-01 | Breast | breast invasive carcinoma | Female | <65 | I/II | Unknown | Unknown | PD | |
| NYNRIN | SNV | Missense_Mutation | c.5592N>C | p.Trp1864Cys | p.W1864C | Q9P2P1 | protein_coding | deleterious_low_confidence(0) | probably_damaging(0.996) | TCGA-BH-A0BZ-01 | Breast | breast invasive carcinoma | Female | <65 | III/IV | Chemotherapy | doxorubicin | CR | |
| NYNRIN | SNV | Missense_Mutation | c.1012N>T | p.Val338Leu | p.V338L | Q9P2P1 | protein_coding | deleterious_low_confidence(0.01) | benign(0.267) | TCGA-D8-A1XQ-01 | Breast | breast invasive carcinoma | Female | >=65 | I/II | Unknown | Unknown | SD | |
| NYNRIN | SNV | Missense_Mutation | c.3710G>A | p.Arg1237Gln | p.R1237Q | Q9P2P1 | protein_coding | deleterious(0.01) | benign(0.109) | TCGA-OL-A5RU-01 | Breast | breast invasive carcinoma | Female | <65 | I/II | Chemotherapy | cyclophosphamide | CR |
| Page: 1 2 3 4 5 6 7 8 9 10 11 12 13 14 15 16 17 |
Top |
Related drugs of malignant transformation related genes |
| Identification of chemicals and drugs interact with genes involved in malignant transfromation |
| (DGIdb 4.0) |
| Entrez ID | Symbol | Category | Interaction Types | Drug Claim Name | Drug Name | PMIDs |
| Page: 1 |

Copyright 2023-Present -The University of Texas Health Science Center at Houston |