
|
|||||
|
 | |
| |
| |
| |
| |
| |
|
Gene: NXT1 |
Gene summary for NXT1 |
| Gene information | Species | Human | Gene symbol | NXT1 | Gene ID | 29107 |
| Gene name | nuclear transport factor 2 like export factor 1 | |
| Gene Alias | MTR2 | |
| Cytomap | 20p11.21 | |
| Gene Type | protein-coding | GO ID | GO:0006403 | UniProtAcc | Q9UKK6 |
Top |
Malignant transformation analysis |
| Identification of the aberrant gene expression in precancerous and cancerous lesions by comparing the gene expression of stem-like cells in diseased tissues with normal stem cells |
| Entrez ID | Symbol | Replicates | Species | Organ | Tissue | Adj P-value | Log2FC | Malignancy |
| 29107 | NXT1 | LZE4T | Human | Esophagus | ESCC | 3.17e-07 | 2.54e-01 | 0.0811 |
| 29107 | NXT1 | LZE7T | Human | Esophagus | ESCC | 7.20e-04 | 4.86e-01 | 0.0667 |
| 29107 | NXT1 | LZE8T | Human | Esophagus | ESCC | 2.37e-02 | 7.44e-02 | 0.067 |
| 29107 | NXT1 | LZE20T | Human | Esophagus | ESCC | 1.92e-02 | 1.29e-01 | 0.0662 |
| 29107 | NXT1 | LZE22D1 | Human | Esophagus | HGIN | 4.27e-02 | -6.23e-02 | 0.0595 |
| 29107 | NXT1 | LZE24T | Human | Esophagus | ESCC | 7.02e-12 | 5.13e-01 | 0.0596 |
| 29107 | NXT1 | LZE6T | Human | Esophagus | ESCC | 7.21e-04 | 4.55e-02 | 0.0845 |
| 29107 | NXT1 | P1T-E | Human | Esophagus | ESCC | 4.72e-04 | 5.61e-01 | 0.0875 |
| 29107 | NXT1 | P2T-E | Human | Esophagus | ESCC | 3.32e-22 | 6.05e-01 | 0.1177 |
| 29107 | NXT1 | P4T-E | Human | Esophagus | ESCC | 8.07e-24 | 8.01e-01 | 0.1323 |
| 29107 | NXT1 | P5T-E | Human | Esophagus | ESCC | 5.59e-11 | 5.13e-01 | 0.1327 |
| 29107 | NXT1 | P8T-E | Human | Esophagus | ESCC | 5.31e-07 | 3.54e-01 | 0.0889 |
| 29107 | NXT1 | P9T-E | Human | Esophagus | ESCC | 3.97e-15 | 5.64e-01 | 0.1131 |
| 29107 | NXT1 | P10T-E | Human | Esophagus | ESCC | 1.28e-23 | 6.49e-01 | 0.116 |
| 29107 | NXT1 | P11T-E | Human | Esophagus | ESCC | 3.98e-10 | 6.12e-01 | 0.1426 |
| 29107 | NXT1 | P12T-E | Human | Esophagus | ESCC | 5.20e-21 | 6.76e-01 | 0.1122 |
| 29107 | NXT1 | P15T-E | Human | Esophagus | ESCC | 1.89e-17 | 4.78e-01 | 0.1149 |
| 29107 | NXT1 | P16T-E | Human | Esophagus | ESCC | 2.02e-20 | 5.50e-01 | 0.1153 |
| 29107 | NXT1 | P17T-E | Human | Esophagus | ESCC | 1.64e-04 | 4.79e-01 | 0.1278 |
| 29107 | NXT1 | P19T-E | Human | Esophagus | ESCC | 9.95e-04 | 3.39e-01 | 0.1662 |
| Page: 1 2 3 4 5 6 7 |
| Tissue | Expression Dynamics | Abbreviation |
| Esophagus |  | ESCC: Esophageal squamous cell carcinoma |
| HGIN: High-grade intraepithelial neoplasias | ||
| LGIN: Low-grade intraepithelial neoplasias | ||
| Liver | 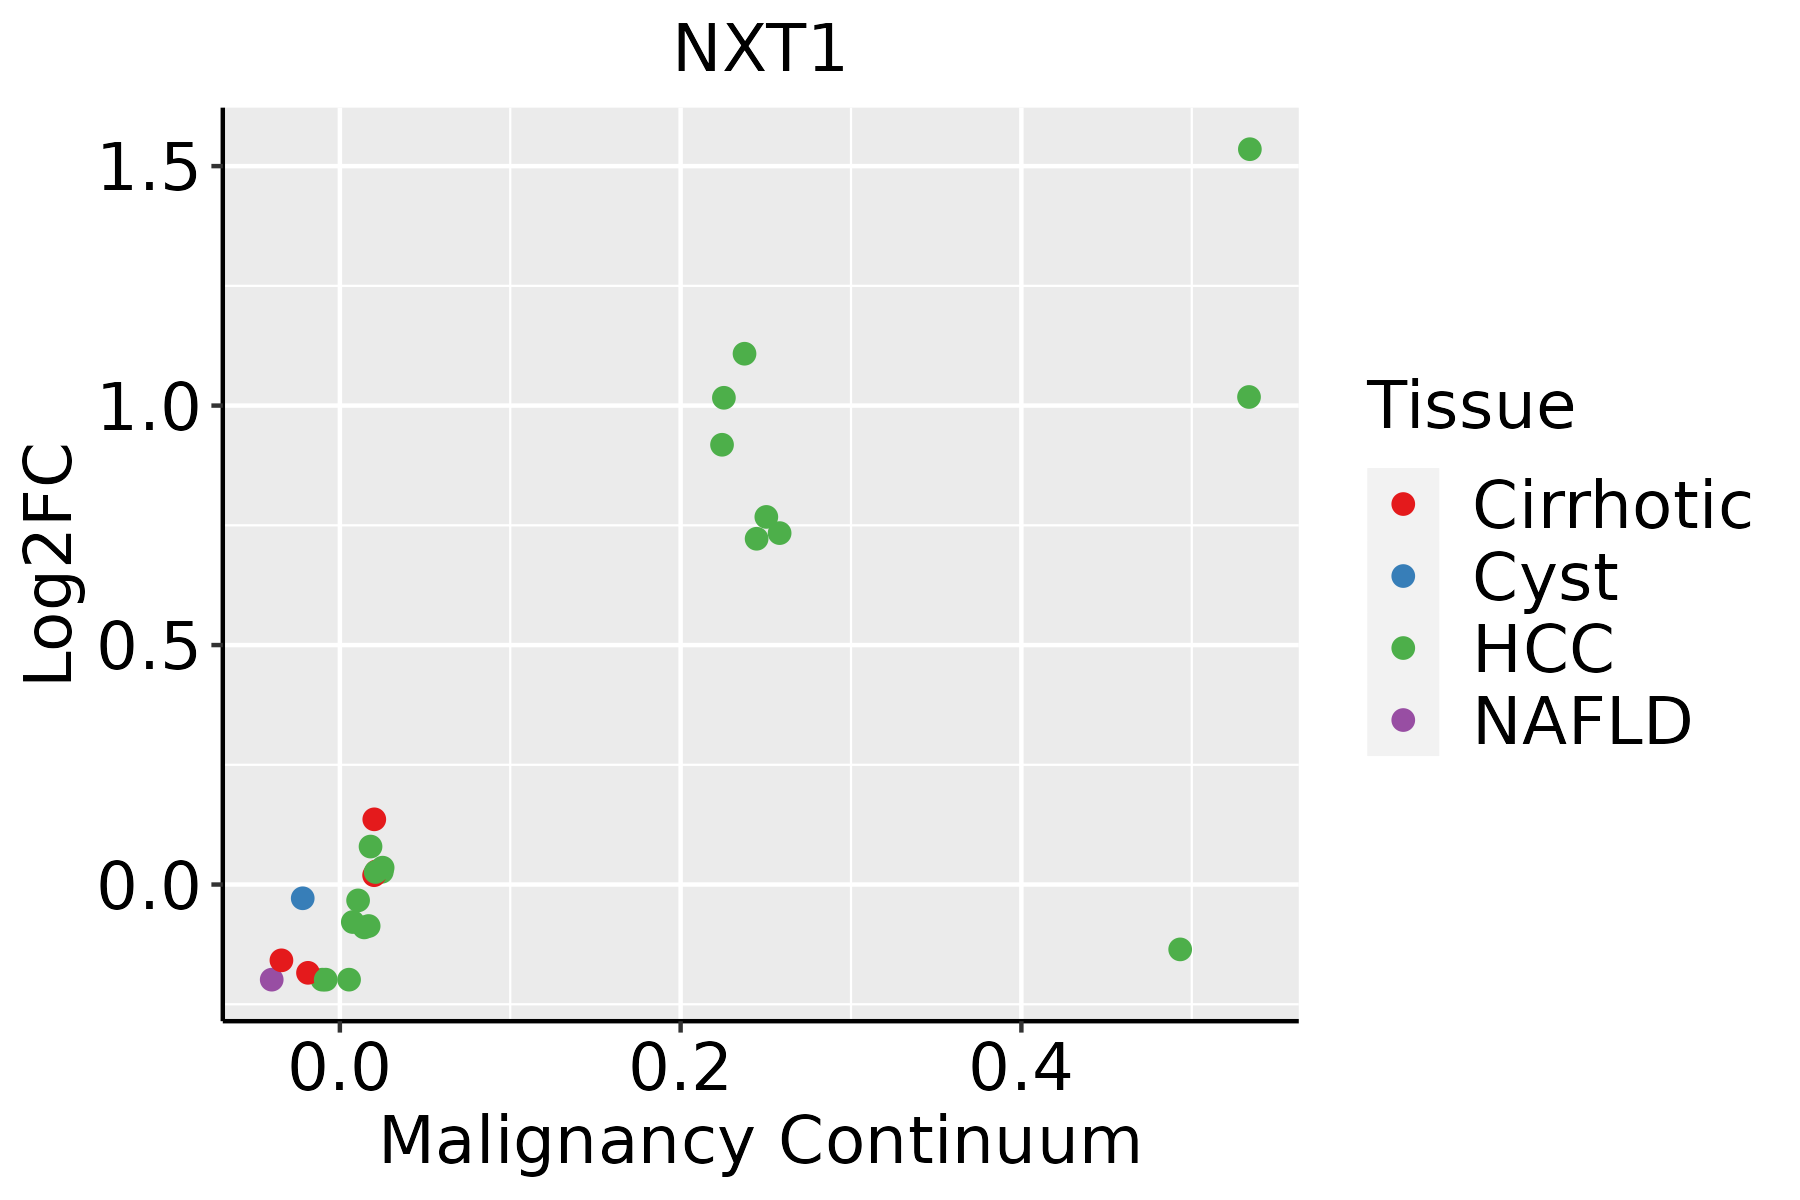 | HCC: Hepatocellular carcinoma |
| NAFLD: Non-alcoholic fatty liver disease | ||
| Oral Cavity | 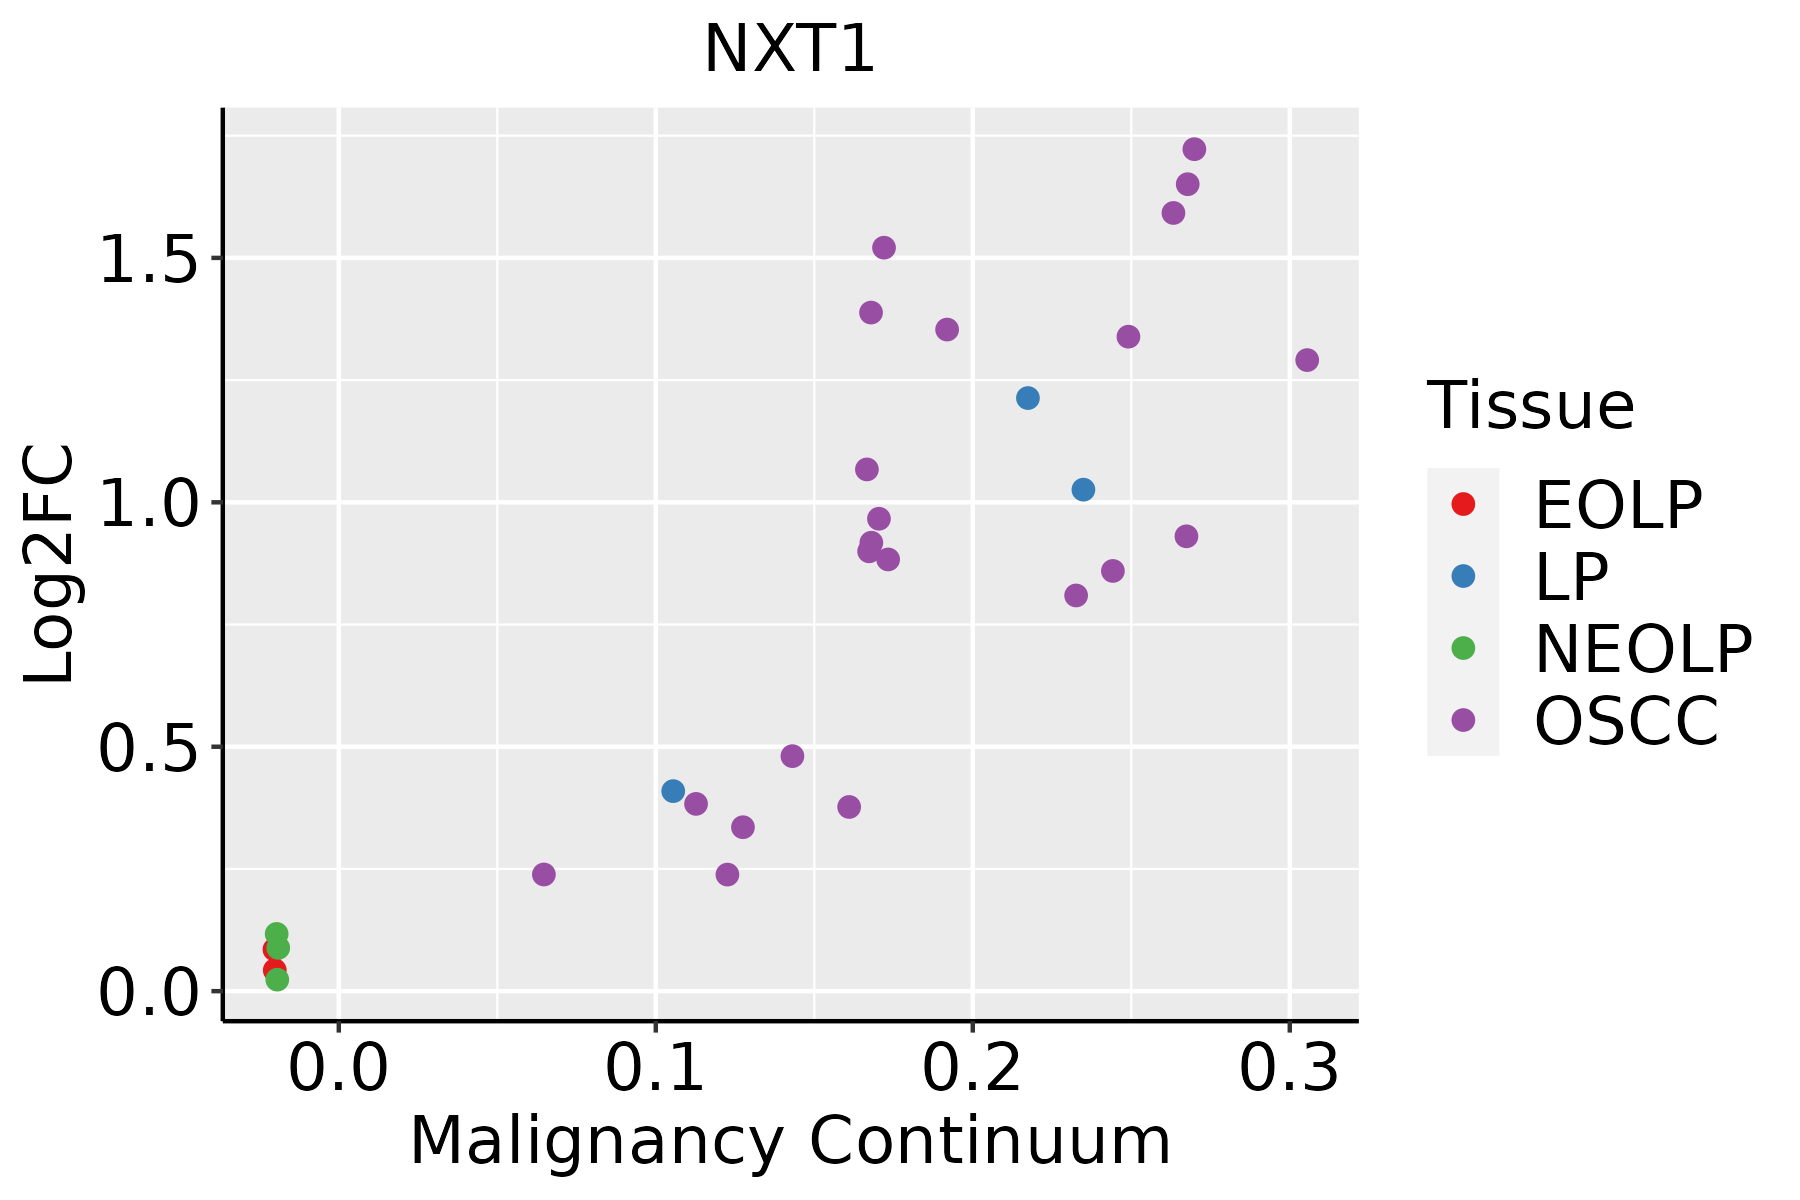 | EOLP: Erosive Oral lichen planus |
| LP: leukoplakia | ||
| NEOLP: Non-erosive oral lichen planus | ||
| OSCC: Oral squamous cell carcinoma | ||
| Skin | 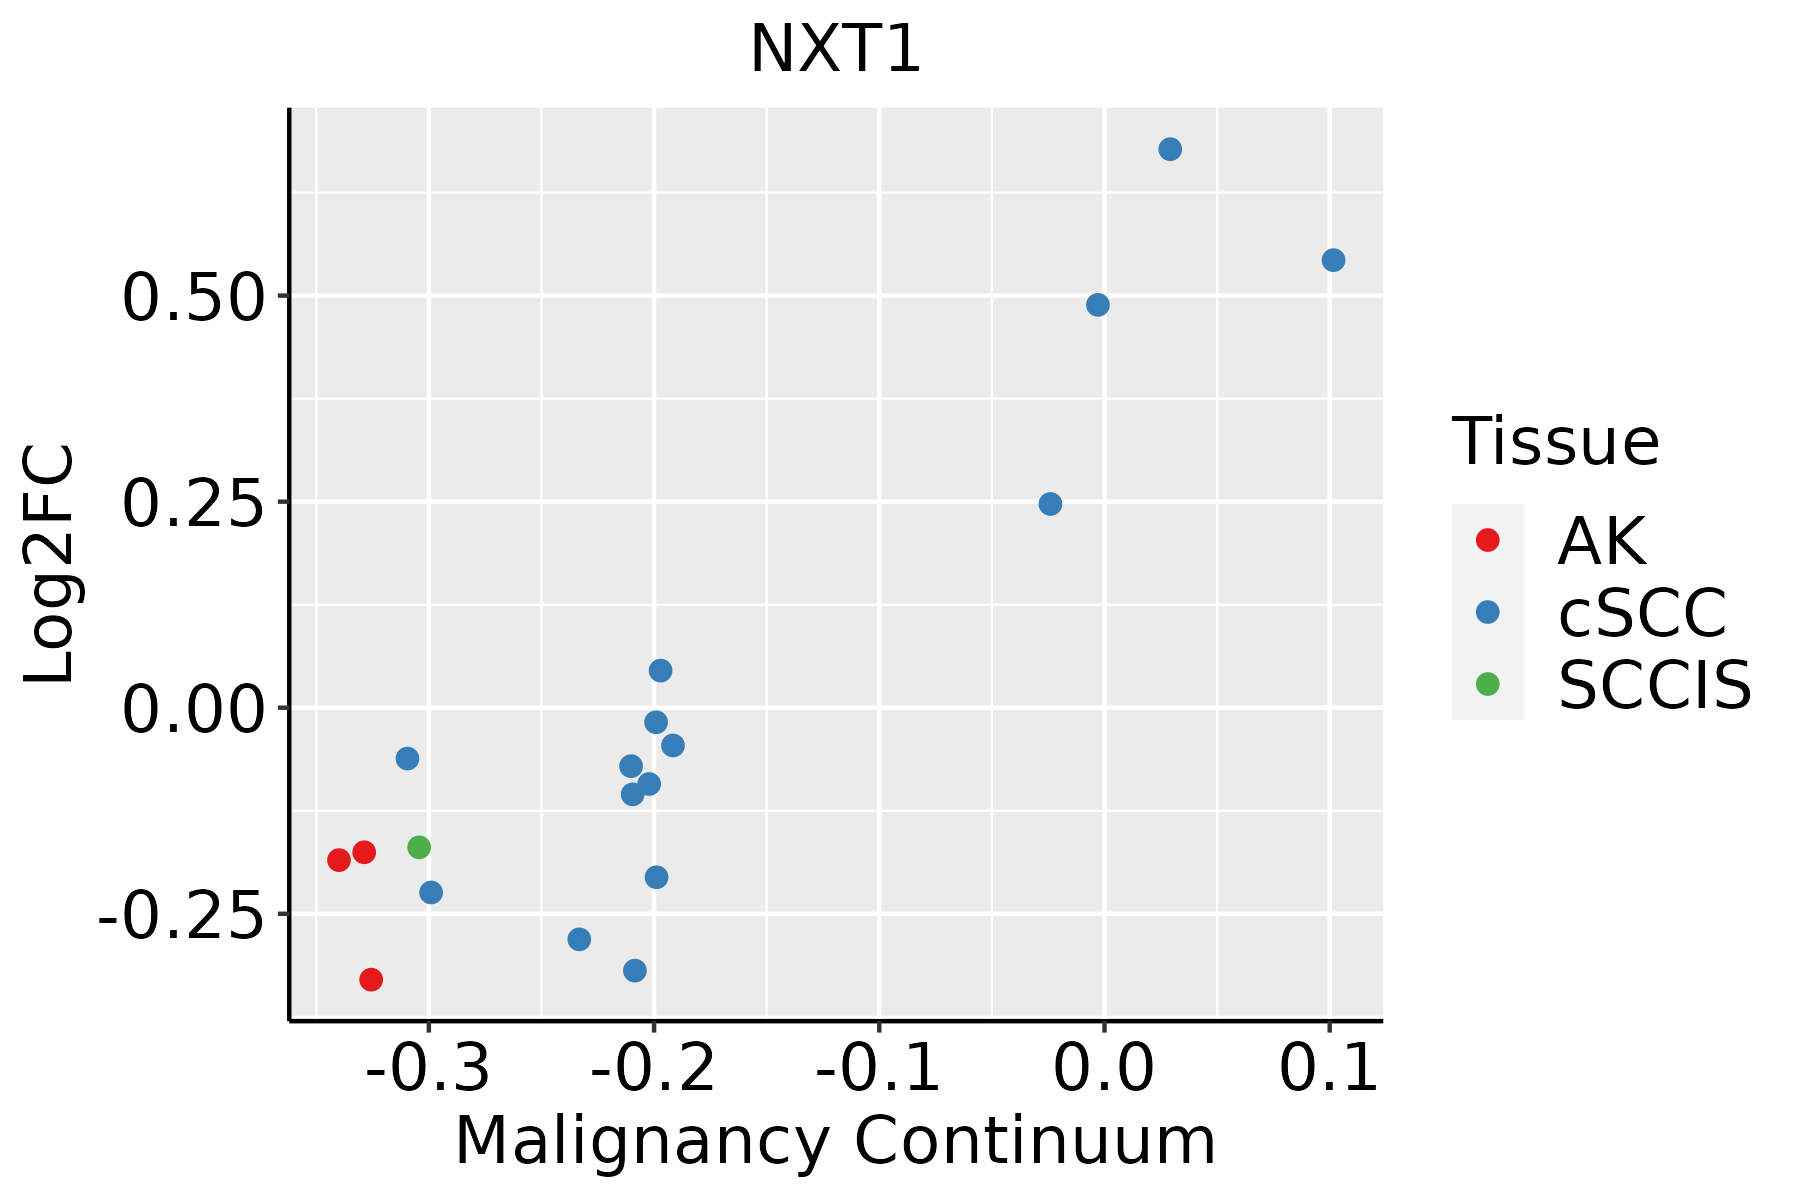 | AK: Actinic keratosis |
| cSCC: Cutaneous squamous cell carcinoma | ||
| SCCIS:squamous cell carcinoma in situ | ||
| Thyroid | 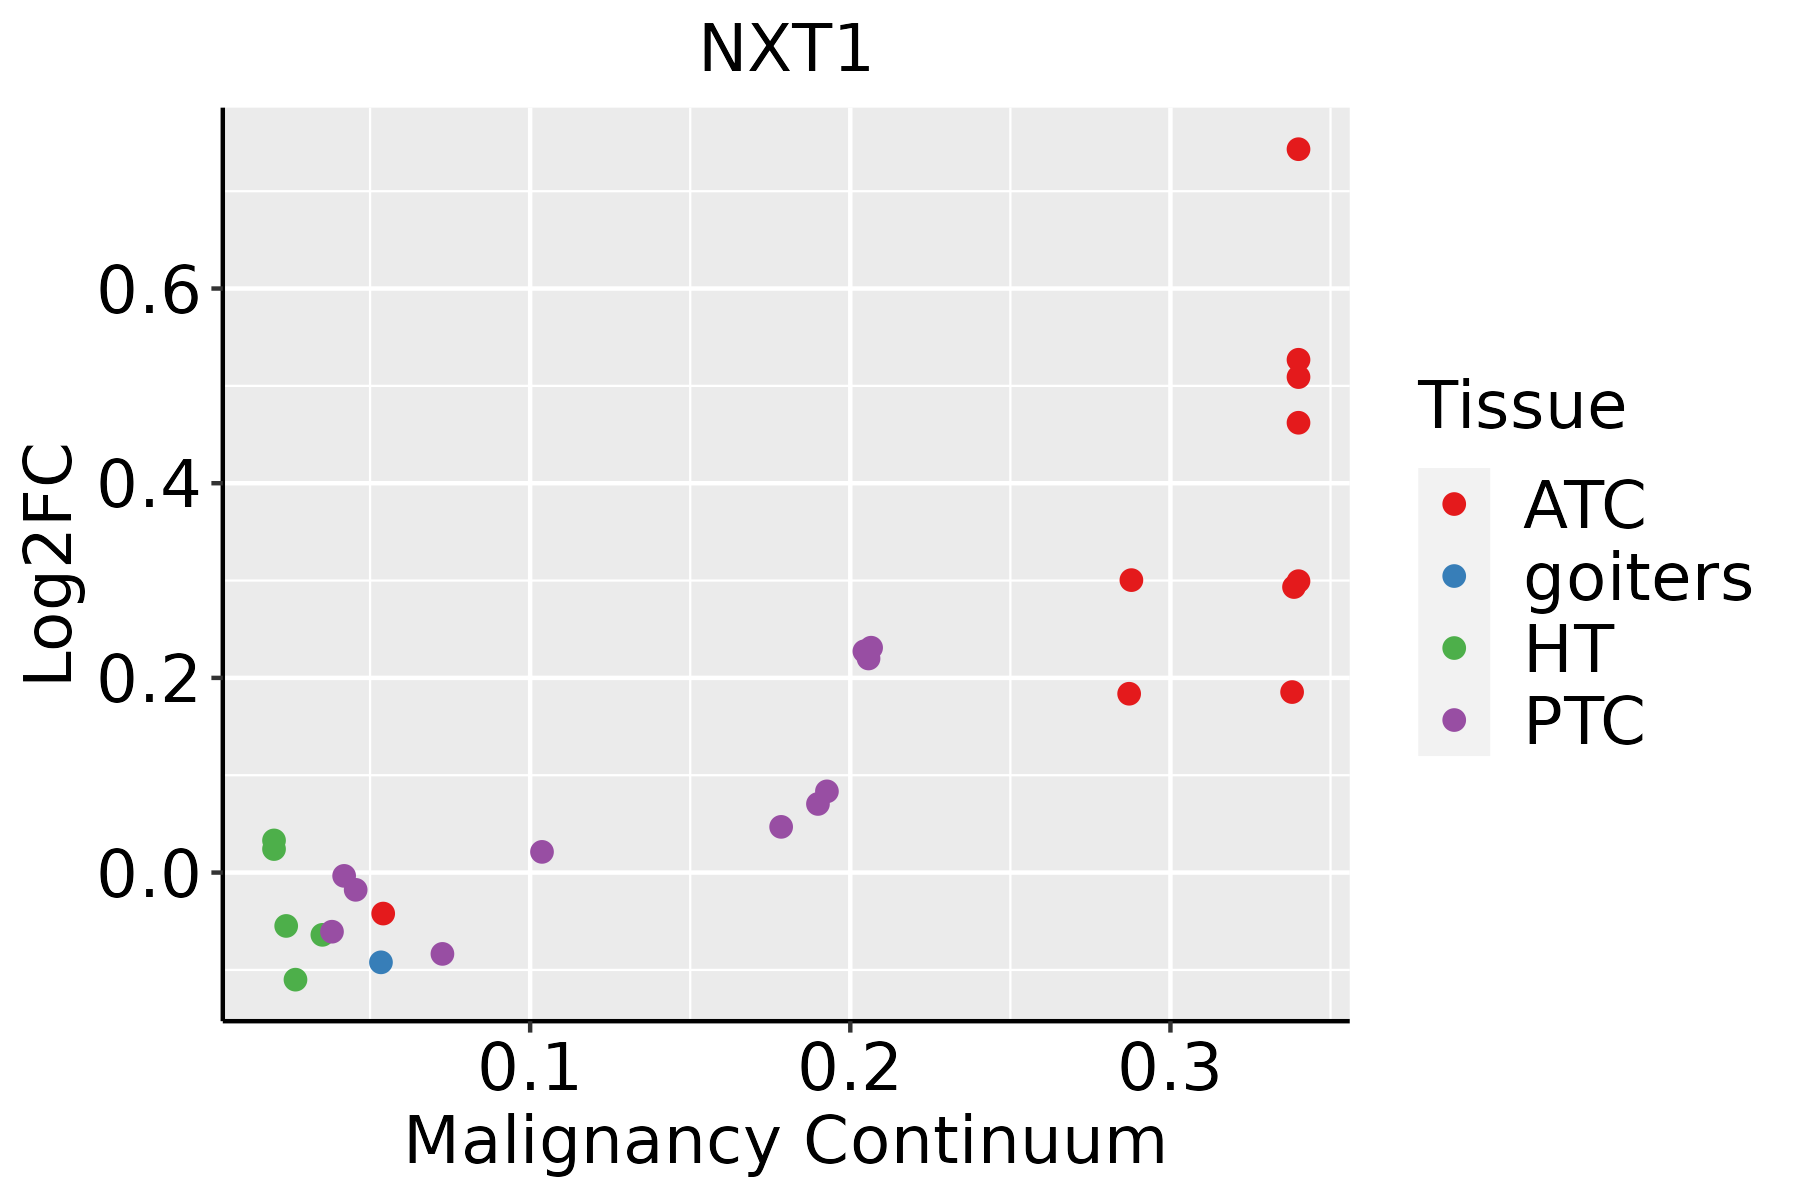 | ATC: Anaplastic thyroid cancer |
| HT: Hashimoto's thyroiditis | ||
| PTC: Papillary thyroid cancer |
| ∗log2FC in expression of this searched gene in stem-like cells from each diseased tissue sample relative to stem-like cells in normal samples in each tissue plotted against the malignancy continuum. Samples are colored based on if they are from different disease stage. |
Top |
Malignant transformation related pathway analysis |
| Find out the enriched GO biological processes and KEGG pathways involved in transition from healthy to precancer to cancer |
| Tissue | Disease Stage | Enriched GO biological Processes |
| Colorectum | AD |  |
| Colorectum | SER |  |
| Colorectum | MSS |  |
| Colorectum | MSI-H |  |
| Colorectum | FAP |  |
| ∗Top 15 enriched GO BP terms are showed in the bar plot of each disease state in each tissue. Each row represents a significant GO biological process which is colored according to the -log10(p.adjust). |
| Page: 1 2 3 4 5 6 7 8 9 |
| GO ID | Tissue | Disease Stage | Description | Gene Ratio | Bg Ratio | pvalue | p.adjust | Count |
| GO:007259420 | Esophagus | HGIN | establishment of protein localization to organelle | 120/2587 | 422/18723 | 1.73e-15 | 4.00e-13 | 120 |
| GO:000640320 | Esophagus | HGIN | RNA localization | 66/2587 | 201/18723 | 4.06e-12 | 5.41e-10 | 66 |
| GO:003450417 | Esophagus | HGIN | protein localization to nucleus | 84/2587 | 290/18723 | 1.06e-11 | 1.24e-09 | 84 |
| GO:000691319 | Esophagus | HGIN | nucleocytoplasmic transport | 83/2587 | 301/18723 | 2.14e-10 | 1.97e-08 | 83 |
| GO:005116919 | Esophagus | HGIN | nuclear transport | 83/2587 | 301/18723 | 2.14e-10 | 1.97e-08 | 83 |
| GO:005116819 | Esophagus | HGIN | nuclear export | 48/2587 | 154/18723 | 2.21e-08 | 1.34e-06 | 48 |
| GO:005065716 | Esophagus | HGIN | nucleic acid transport | 49/2587 | 163/18723 | 5.71e-08 | 3.06e-06 | 49 |
| GO:005065816 | Esophagus | HGIN | RNA transport | 49/2587 | 163/18723 | 5.71e-08 | 3.06e-06 | 49 |
| GO:005123616 | Esophagus | HGIN | establishment of RNA localization | 49/2587 | 166/18723 | 1.07e-07 | 5.47e-06 | 49 |
| GO:001593116 | Esophagus | HGIN | nucleobase-containing compound transport | 57/2587 | 222/18723 | 1.76e-06 | 6.52e-05 | 57 |
| GO:000661110 | Esophagus | HGIN | protein export from nucleus | 22/2587 | 57/18723 | 2.96e-06 | 1.02e-04 | 22 |
| GO:001703817 | Esophagus | HGIN | protein import | 51/2587 | 206/18723 | 1.79e-05 | 4.86e-04 | 51 |
| GO:005117010 | Esophagus | HGIN | import into nucleus | 41/2587 | 159/18723 | 4.24e-05 | 1.04e-03 | 41 |
| GO:000660610 | Esophagus | HGIN | protein import into nucleus | 39/2587 | 155/18723 | 1.14e-04 | 2.39e-03 | 39 |
| GO:00064056 | Esophagus | HGIN | RNA export from nucleus | 23/2587 | 84/18723 | 7.90e-04 | 1.03e-02 | 23 |
| GO:0072594110 | Esophagus | ESCC | establishment of protein localization to organelle | 311/8552 | 422/18723 | 3.02e-32 | 2.13e-29 | 311 |
| GO:0006913110 | Esophagus | ESCC | nucleocytoplasmic transport | 230/8552 | 301/18723 | 6.04e-28 | 2.02e-25 | 230 |
| GO:0051169110 | Esophagus | ESCC | nuclear transport | 230/8552 | 301/18723 | 6.04e-28 | 2.02e-25 | 230 |
| GO:0006403110 | Esophagus | ESCC | RNA localization | 166/8552 | 201/18723 | 1.95e-27 | 6.18e-25 | 166 |
| GO:003450418 | Esophagus | ESCC | protein localization to nucleus | 211/8552 | 290/18723 | 4.06e-21 | 6.60e-19 | 211 |
| Page: 1 2 3 4 5 6 7 8 |
| Pathway ID | Tissue | Disease Stage | Description | Gene Ratio | Bg Ratio | pvalue | p.adjust | qvalue | Count |
| hsa0501430 | Esophagus | HGIN | Amyotrophic lateral sclerosis | 140/1383 | 364/8465 | 2.13e-25 | 1.16e-23 | 9.19e-24 | 140 |
| hsa030159 | Esophagus | HGIN | mRNA surveillance pathway | 30/1383 | 97/8465 | 2.48e-04 | 2.69e-03 | 2.14e-03 | 30 |
| hsa030137 | Esophagus | HGIN | Nucleocytoplasmic transport | 31/1383 | 108/8465 | 8.29e-04 | 7.95e-03 | 6.31e-03 | 31 |
| hsa0516420 | Esophagus | HGIN | Influenza A | 42/1383 | 171/8465 | 3.41e-03 | 2.54e-02 | 2.02e-02 | 42 |
| hsa05014113 | Esophagus | HGIN | Amyotrophic lateral sclerosis | 140/1383 | 364/8465 | 2.13e-25 | 1.16e-23 | 9.19e-24 | 140 |
| hsa0301514 | Esophagus | HGIN | mRNA surveillance pathway | 30/1383 | 97/8465 | 2.48e-04 | 2.69e-03 | 2.14e-03 | 30 |
| hsa0301312 | Esophagus | HGIN | Nucleocytoplasmic transport | 31/1383 | 108/8465 | 8.29e-04 | 7.95e-03 | 6.31e-03 | 31 |
| hsa05164110 | Esophagus | HGIN | Influenza A | 42/1383 | 171/8465 | 3.41e-03 | 2.54e-02 | 2.02e-02 | 42 |
| hsa05014210 | Esophagus | ESCC | Amyotrophic lateral sclerosis | 266/4205 | 364/8465 | 1.31e-20 | 2.20e-18 | 1.13e-18 | 266 |
| hsa0301321 | Esophagus | ESCC | Nucleocytoplasmic transport | 89/4205 | 108/8465 | 1.20e-12 | 2.37e-11 | 1.21e-11 | 89 |
| hsa0516425 | Esophagus | ESCC | Influenza A | 122/4205 | 171/8465 | 5.01e-09 | 4.79e-08 | 2.45e-08 | 122 |
| hsa0301524 | Esophagus | ESCC | mRNA surveillance pathway | 72/4205 | 97/8465 | 6.12e-07 | 4.10e-06 | 2.10e-06 | 72 |
| hsa0501438 | Esophagus | ESCC | Amyotrophic lateral sclerosis | 266/4205 | 364/8465 | 1.31e-20 | 2.20e-18 | 1.13e-18 | 266 |
| hsa0301331 | Esophagus | ESCC | Nucleocytoplasmic transport | 89/4205 | 108/8465 | 1.20e-12 | 2.37e-11 | 1.21e-11 | 89 |
| hsa0516435 | Esophagus | ESCC | Influenza A | 122/4205 | 171/8465 | 5.01e-09 | 4.79e-08 | 2.45e-08 | 122 |
| hsa0301534 | Esophagus | ESCC | mRNA surveillance pathway | 72/4205 | 97/8465 | 6.12e-07 | 4.10e-06 | 2.10e-06 | 72 |
| hsa0501414 | Liver | Cirrhotic | Amyotrophic lateral sclerosis | 187/2530 | 364/8465 | 1.56e-18 | 6.50e-17 | 4.01e-17 | 187 |
| hsa030154 | Liver | Cirrhotic | mRNA surveillance pathway | 46/2530 | 97/8465 | 1.92e-04 | 1.30e-03 | 8.03e-04 | 46 |
| hsa0516410 | Liver | Cirrhotic | Influenza A | 66/2530 | 171/8465 | 8.56e-03 | 2.91e-02 | 1.79e-02 | 66 |
| hsa0501415 | Liver | Cirrhotic | Amyotrophic lateral sclerosis | 187/2530 | 364/8465 | 1.56e-18 | 6.50e-17 | 4.01e-17 | 187 |
| Page: 1 2 3 |
Top |
Cell-cell communication analysis |
| Identification of potential cell-cell interactions between two cell types and their ligand-receptor pairs for different disease states |
| Ligand | Receptor | LRpair | Pathway | Tissue | Disease Stage |
| Page: 1 |
Top |
Single-cell gene regulatory network inference analysis |
| Find out the significant the regulons (TFs) and the target genes of each regulon across cell types for different disease states |
| TF | Cell Type | Tissue | Disease Stage | Target Gene | RSS | Regulon Activity |
| ∗The dot plots of a searched regulon are shown for all cell subpopulations in each disease state of each tissue based on the regulon specific score inferred using pySCENIC and by calculating the average expression. |
| Page: 1 |
Top |
Somatic mutation of malignant transformation related genes |
| Annotation of somatic variants for genes involved in malignant transformation |
| Hugo Symbol | Variant Class | Variant Classification | dbSNP RS | HGVSc | HGVSp | HGVSp Short | SWISSPROT | BIOTYPE | SIFT | PolyPhen | Tumor Sample Barcode | Tissue | Histology | Sex | Age | Stage | Therapy Types | Drugs | Outcome |
| NXT1 | SNV | Missense_Mutation | novel | c.181N>C | p.Phe61Leu | p.F61L | Q9UKK6 | protein_coding | deleterious(0) | possibly_damaging(0.814) | TCGA-2W-A8YY-01 | Cervix | cervical & endocervical cancer | Female | <65 | I/II | Chemotherapy | cisplatin | CR |
| NXT1 | SNV | Missense_Mutation | novel | c.127G>A | p.Ala43Thr | p.A43T | Q9UKK6 | protein_coding | deleterious(0) | possibly_damaging(0.902) | TCGA-EA-A3HU-01 | Cervix | cervical & endocervical cancer | Female | <65 | I/II | Unknown | Unknown | SD |
| NXT1 | SNV | Missense_Mutation | c.128N>T | p.Ala43Val | p.A43V | Q9UKK6 | protein_coding | deleterious(0) | possibly_damaging(0.68) | TCGA-D5-6928-01 | Colorectum | colon adenocarcinoma | Male | >=65 | I/II | Unknown | Unknown | SD | |
| NXT1 | SNV | Missense_Mutation | c.94N>T | p.Arg32Trp | p.R32W | Q9UKK6 | protein_coding | deleterious(0) | probably_damaging(1) | TCGA-DM-A1DA-01 | Colorectum | colon adenocarcinoma | Female | >=65 | III/IV | Unknown | Unknown | SD | |
| NXT1 | SNV | Missense_Mutation | c.319N>T | p.Arg107Trp | p.R107W | Q9UKK6 | protein_coding | deleterious(0.01) | benign(0.164) | TCGA-AJ-A3BG-01 | Endometrium | uterine corpus endometrioid carcinoma | Female | >=65 | I/II | Chemotherapy | carboplatin | PD | |
| NXT1 | SNV | Missense_Mutation | rs780312087 | c.269N>T | p.Thr90Met | p.T90M | Q9UKK6 | protein_coding | deleterious(0) | probably_damaging(0.954) | TCGA-AX-A1C9-01 | Endometrium | uterine corpus endometrioid carcinoma | Female | >=65 | I/II | Unknown | Unknown | SD |
| NXT1 | SNV | Missense_Mutation | rs767786208 | c.385G>A | p.Ala129Thr | p.A129T | Q9UKK6 | protein_coding | deleterious(0.02) | benign(0.178) | TCGA-EY-A1GI-01 | Endometrium | uterine corpus endometrioid carcinoma | Female | <65 | I/II | Unknown | Unknown | SD |
| NXT1 | insertion | Frame_Shift_Ins | novel | c.180_181insT | p.Glu63Ter | p.E63* | Q9UKK6 | protein_coding | TCGA-DF-A2KY-01 | Endometrium | uterine corpus endometrioid carcinoma | Female | <65 | III/IV | Chemotherapy | carboplatin | SD | ||
| NXT1 | SNV | Missense_Mutation | novel | c.28N>A | p.Val10Met | p.V10M | Q9UKK6 | protein_coding | deleterious(0) | possibly_damaging(0.518) | TCGA-78-7155-01 | Lung | lung adenocarcinoma | Male | >=65 | I/II | Chemotherapy | carboplatin | PD |
| NXT1 | SNV | Missense_Mutation | c.204N>A | p.Ser68Arg | p.S68R | Q9UKK6 | protein_coding | deleterious(0) | probably_damaging(0.997) | TCGA-51-4081-01 | Lung | lung squamous cell carcinoma | Male | <65 | I/II | Chemotherapy | cisplatin | SD |
| Page: 1 2 |
Top |
Related drugs of malignant transformation related genes |
| Identification of chemicals and drugs interact with genes involved in malignant transfromation |
| (DGIdb 4.0) |
| Entrez ID | Symbol | Category | Interaction Types | Drug Claim Name | Drug Name | PMIDs |
| Page: 1 |

Copyright 2023-Present -The University of Texas Health Science Center at Houston |