
|
|||||
|
 | |
| |
| |
| |
| |
| |
|
Gene: NXPH3 |
Gene summary for NXPH3 |
| Gene information | Species | Human | Gene symbol | NXPH3 | Gene ID | 11248 |
| Gene name | neurexophilin 3 | |
| Gene Alias | NPH3 | |
| Cytomap | 17q21.33 | |
| Gene Type | protein-coding | GO ID | GO:0007154 | UniProtAcc | O95157 |
Top |
Malignant transformation analysis |
| Identification of the aberrant gene expression in precancerous and cancerous lesions by comparing the gene expression of stem-like cells in diseased tissues with normal stem cells |
| Entrez ID | Symbol | Replicates | Species | Organ | Tissue | Adj P-value | Log2FC | Malignancy |
| 11248 | NXPH3 | S014 | Human | Liver | HCC | 3.64e-16 | 4.24e-01 | 0.2254 |
| 11248 | NXPH3 | S015 | Human | Liver | HCC | 1.61e-18 | 8.00e-01 | 0.2375 |
| 11248 | NXPH3 | S016 | Human | Liver | HCC | 7.39e-22 | 5.12e-01 | 0.2243 |
| Page: 1 |
| Tissue | Expression Dynamics | Abbreviation |
| Liver | 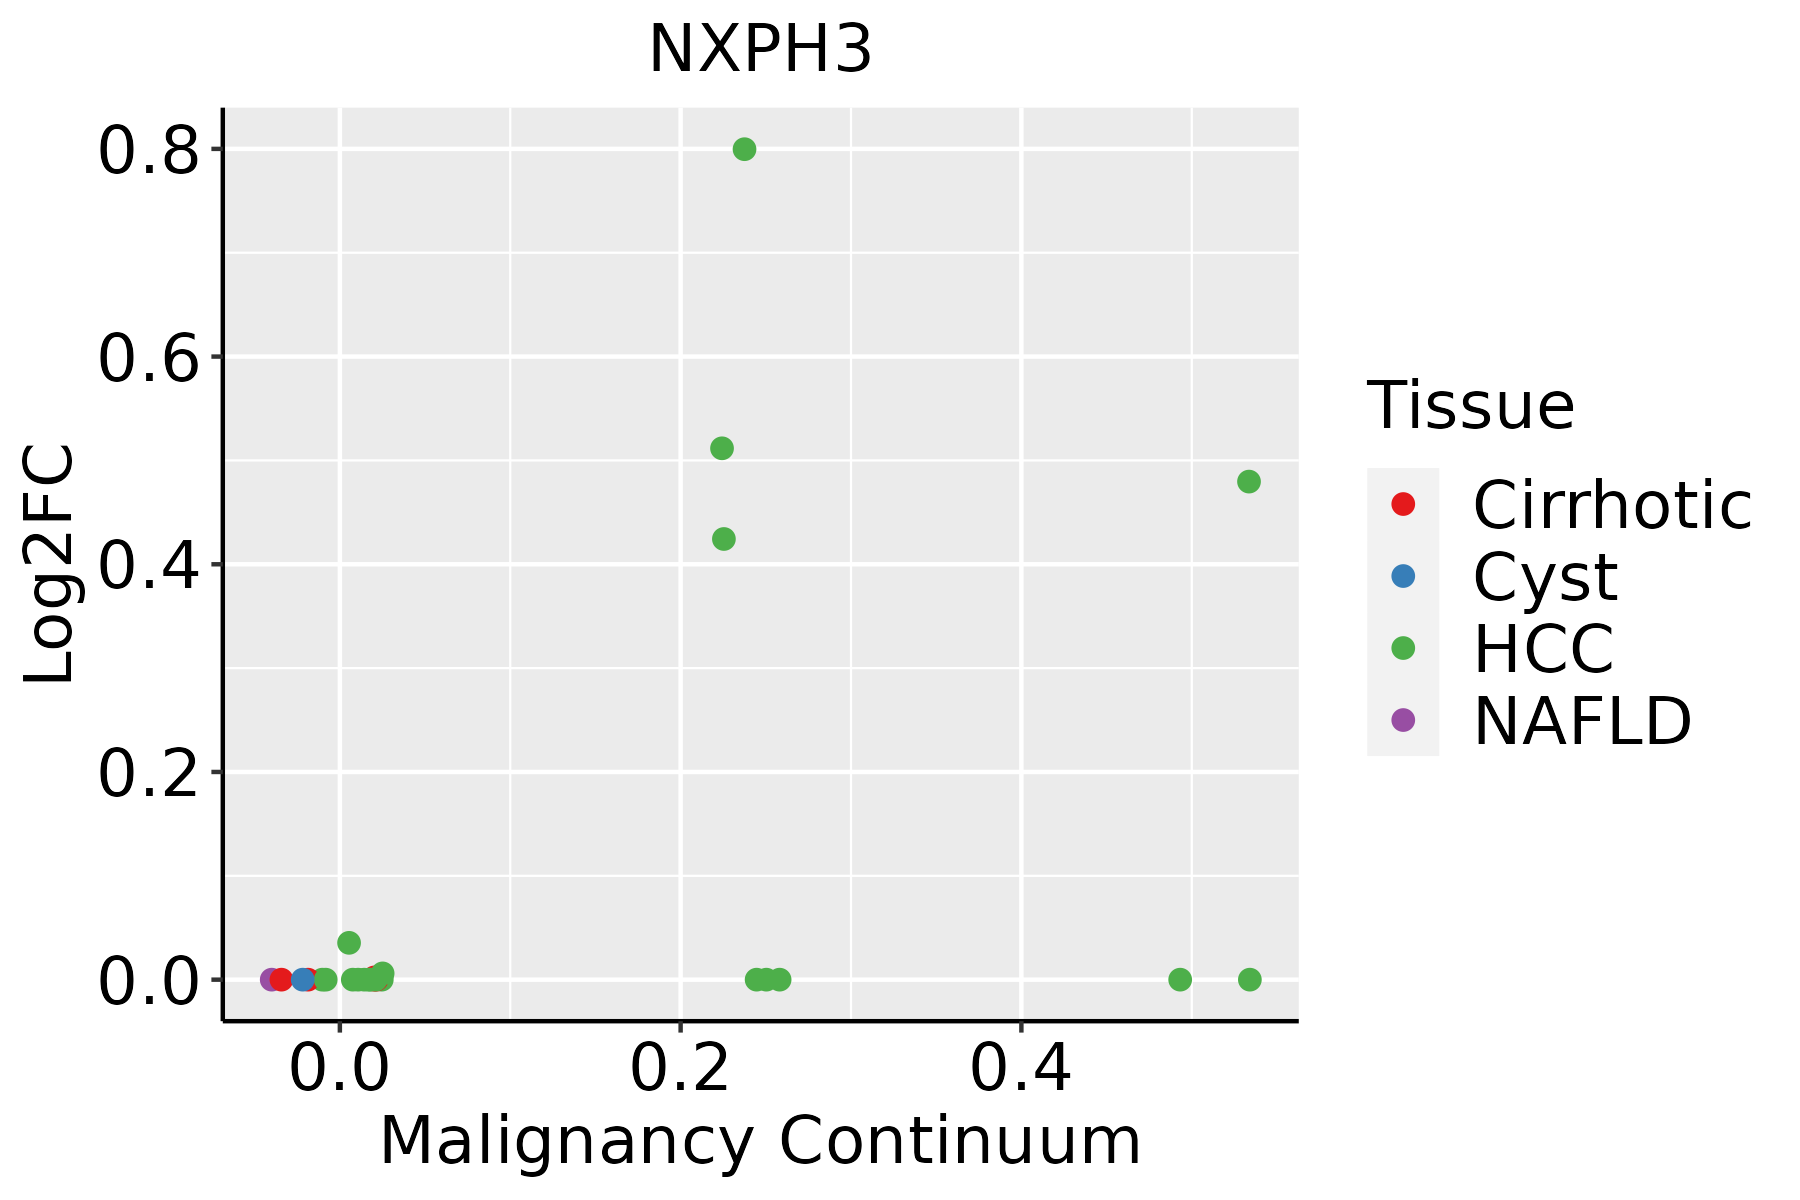 | HCC: Hepatocellular carcinoma |
| NAFLD: Non-alcoholic fatty liver disease |
| ∗log2FC in expression of this searched gene in stem-like cells from each diseased tissue sample relative to stem-like cells in normal samples in each tissue plotted against the malignancy continuum. Samples are colored based on if they are from different disease stage. |
Top |
Malignant transformation related pathway analysis |
| Find out the enriched GO biological processes and KEGG pathways involved in transition from healthy to precancer to cancer |
| Tissue | Disease Stage | Enriched GO biological Processes |
| Colorectum | AD |  |
| Colorectum | SER |  |
| Colorectum | MSS |  |
| Colorectum | MSI-H |  |
| Colorectum | FAP |  |
| ∗Top 15 enriched GO BP terms are showed in the bar plot of each disease state in each tissue. Each row represents a significant GO biological process which is colored according to the -log10(p.adjust). |
| Page: 1 2 3 4 5 6 7 8 9 |
| GO ID | Tissue | Disease Stage | Description | Gene Ratio | Bg Ratio | pvalue | p.adjust | Count |
| Page: 1 |
| Pathway ID | Tissue | Disease Stage | Description | Gene Ratio | Bg Ratio | pvalue | p.adjust | qvalue | Count |
| Page: 1 |
Top |
Cell-cell communication analysis |
| Identification of potential cell-cell interactions between two cell types and their ligand-receptor pairs for different disease states |
| Ligand | Receptor | LRpair | Pathway | Tissue | Disease Stage |
| Page: 1 |
Top |
Single-cell gene regulatory network inference analysis |
| Find out the significant the regulons (TFs) and the target genes of each regulon across cell types for different disease states |
| TF | Cell Type | Tissue | Disease Stage | Target Gene | RSS | Regulon Activity |
| NXPH3 | SMC | Endometrium | ADJ | ITM2B,PPIF,PRELP, etc. | 2.72e-01 |  |
| NXPH3 | SMC | Endometrium | AEH | ITM2B,PPIF,PRELP, etc. | 1.77e-01 |  |
| NXPH3 | MYOFIB | Endometrium | Healthy | ITM2B,PPIF,PRELP, etc. | 2.44e-01 |  |
| NXPH3 | SMC | Prostate | ADJ | RDH5,PLN,RERGL, etc. | 4.90e-01 |  |
| NXPH3 | SMC | Prostate | BPH | RDH5,PLN,RERGL, etc. | 2.61e-01 |  |
| NXPH3 | PERI | Prostate | BPH | RDH5,PLN,RERGL, etc. | 3.45e-01 | |
| NXPH3 | SMC | Prostate | Healthy | RDH5,PLN,RERGL, etc. | 4.05e-01 |  |
| NXPH3 | PERI | Prostate | Healthy | RDH5,PLN,RERGL, etc. | 2.35e-01 | |
| NXPH3 | SMC | Prostate | Tumor | RDH5,PLN,RERGL, etc. | 3.49e-01 |  |
| ∗The dot plots of a searched regulon are shown for all cell subpopulations in each disease state of each tissue based on the regulon specific score inferred using pySCENIC and by calculating the average expression. |
| Page: 1 |
Top |
Somatic mutation of malignant transformation related genes |
| Annotation of somatic variants for genes involved in malignant transformation |
| Hugo Symbol | Variant Class | Variant Classification | dbSNP RS | HGVSc | HGVSp | HGVSp Short | SWISSPROT | BIOTYPE | SIFT | PolyPhen | Tumor Sample Barcode | Tissue | Histology | Sex | Age | Stage | Therapy Types | Drugs | Outcome |
| NXPH3 | SNV | Missense_Mutation | rs746062768 | c.41N>T | p.Gly14Val | p.G14V | O95157 | protein_coding | tolerated(0.1) | probably_damaging(0.972) | TCGA-E2-A1B1-01 | Breast | breast invasive carcinoma | Female | <65 | I/II | Other, specify in notesbiphosphonate | zoledronic | SD |
| NXPH3 | SNV | Missense_Mutation | novel | c.131N>T | p.Pro44Leu | p.P44L | O95157 | protein_coding | tolerated(0.08) | benign(0.007) | TCGA-2W-A8YY-01 | Cervix | cervical & endocervical cancer | Female | <65 | I/II | Chemotherapy | cisplatin | CR |
| NXPH3 | SNV | Missense_Mutation | c.733G>C | p.Asp245His | p.D245H | O95157 | protein_coding | deleterious(0) | possibly_damaging(0.797) | TCGA-IR-A3LI-01 | Cervix | cervical & endocervical cancer | Female | <65 | I/II | Chemotherapy | cisplatin | CR | |
| NXPH3 | SNV | Missense_Mutation | rs758345082 | c.670N>A | p.Ala224Thr | p.A224T | O95157 | protein_coding | tolerated(0.4) | possibly_damaging(0.809) | TCGA-VS-A94Z-01 | Cervix | cervical & endocervical cancer | Female | <65 | I/II | Chemotherapy | cisplatin | CR |
| NXPH3 | SNV | Missense_Mutation | novel | c.419G>A | p.Gly140Asp | p.G140D | O95157 | protein_coding | deleterious(0) | possibly_damaging(0.903) | TCGA-AA-3947-01 | Colorectum | colon adenocarcinoma | Female | <65 | I/II | Unknown | Unknown | SD |
| NXPH3 | SNV | Missense_Mutation | rs370205840 | c.580N>A | p.Asp194Asn | p.D194N | O95157 | protein_coding | deleterious(0.03) | probably_damaging(0.995) | TCGA-AA-3984-01 | Colorectum | colon adenocarcinoma | Female | <65 | I/II | Unknown | Unknown | SD |
| NXPH3 | SNV | Missense_Mutation | rs758345082 | c.670N>A | p.Ala224Thr | p.A224T | O95157 | protein_coding | tolerated(0.4) | possibly_damaging(0.809) | TCGA-AA-3984-01 | Colorectum | colon adenocarcinoma | Female | <65 | I/II | Unknown | Unknown | SD |
| NXPH3 | SNV | Missense_Mutation | rs762101820 | c.496G>A | p.Glu166Lys | p.E166K | O95157 | protein_coding | deleterious(0.02) | possibly_damaging(0.522) | TCGA-CA-6718-01 | Colorectum | colon adenocarcinoma | Male | <65 | I/II | Unknown | Unknown | PD |
| NXPH3 | SNV | Missense_Mutation | novel | c.116N>G | p.Glu39Gly | p.E39G | O95157 | protein_coding | tolerated(0.12) | benign(0.283) | TCGA-D5-6927-01 | Colorectum | colon adenocarcinoma | Male | <65 | I/II | Unknown | Unknown | SD |
| NXPH3 | SNV | Missense_Mutation | novel | c.458N>C | p.Lys153Thr | p.K153T | O95157 | protein_coding | deleterious(0.01) | probably_damaging(0.998) | TCGA-F5-6814-01 | Colorectum | rectum adenocarcinoma | Male | <65 | I/II | Unknown | Unknown | SD |
| Page: 1 2 3 4 |
Top |
Related drugs of malignant transformation related genes |
| Identification of chemicals and drugs interact with genes involved in malignant transfromation |
| (DGIdb 4.0) |
| Entrez ID | Symbol | Category | Interaction Types | Drug Claim Name | Drug Name | PMIDs |
| Page: 1 |

Copyright 2023-Present -The University of Texas Health Science Center at Houston |