
|
|||||
|
 | |
| |
| |
| |
| |
| |
|
Gene: NXPE3 |
Gene summary for NXPE3 |
| Gene information | Species | Human | Gene symbol | NXPE3 | Gene ID | 91775 |
| Gene name | neurexophilin and PC-esterase domain family member 3 | |
| Gene Alias | FAM55C | |
| Cytomap | 3q12.3 | |
| Gene Type | protein-coding | GO ID | GO:0005575 | UniProtAcc | Q969Y0 |
Top |
Malignant transformation analysis |
| Identification of the aberrant gene expression in precancerous and cancerous lesions by comparing the gene expression of stem-like cells in diseased tissues with normal stem cells |
| Entrez ID | Symbol | Replicates | Species | Organ | Tissue | Adj P-value | Log2FC | Malignancy |
| 91775 | NXPE3 | LZE2T | Human | Esophagus | ESCC | 4.73e-03 | 2.90e-01 | 0.082 |
| 91775 | NXPE3 | LZE4T | Human | Esophagus | ESCC | 7.96e-15 | 4.31e-01 | 0.0811 |
| 91775 | NXPE3 | LZE22T | Human | Esophagus | ESCC | 1.28e-07 | 4.22e-01 | 0.068 |
| 91775 | NXPE3 | LZE24T | Human | Esophagus | ESCC | 1.09e-06 | 1.59e-01 | 0.0596 |
| 91775 | NXPE3 | P2T-E | Human | Esophagus | ESCC | 3.11e-16 | 2.95e-01 | 0.1177 |
| 91775 | NXPE3 | P4T-E | Human | Esophagus | ESCC | 1.75e-05 | 1.38e-01 | 0.1323 |
| 91775 | NXPE3 | P5T-E | Human | Esophagus | ESCC | 4.32e-08 | 1.69e-01 | 0.1327 |
| 91775 | NXPE3 | P8T-E | Human | Esophagus | ESCC | 2.17e-10 | 1.80e-01 | 0.0889 |
| 91775 | NXPE3 | P9T-E | Human | Esophagus | ESCC | 3.67e-14 | 3.20e-01 | 0.1131 |
| 91775 | NXPE3 | P10T-E | Human | Esophagus | ESCC | 1.92e-31 | 5.22e-01 | 0.116 |
| 91775 | NXPE3 | P11T-E | Human | Esophagus | ESCC | 2.06e-07 | 2.62e-01 | 0.1426 |
| 91775 | NXPE3 | P12T-E | Human | Esophagus | ESCC | 1.71e-04 | 1.23e-01 | 0.1122 |
| 91775 | NXPE3 | P15T-E | Human | Esophagus | ESCC | 9.51e-20 | 3.97e-01 | 0.1149 |
| 91775 | NXPE3 | P16T-E | Human | Esophagus | ESCC | 1.19e-16 | 2.70e-01 | 0.1153 |
| 91775 | NXPE3 | P19T-E | Human | Esophagus | ESCC | 3.75e-07 | 3.87e-01 | 0.1662 |
| 91775 | NXPE3 | P20T-E | Human | Esophagus | ESCC | 2.32e-06 | 1.59e-01 | 0.1124 |
| 91775 | NXPE3 | P21T-E | Human | Esophagus | ESCC | 5.97e-22 | 4.96e-01 | 0.1617 |
| 91775 | NXPE3 | P22T-E | Human | Esophagus | ESCC | 8.01e-24 | 4.76e-01 | 0.1236 |
| 91775 | NXPE3 | P23T-E | Human | Esophagus | ESCC | 7.44e-14 | 3.44e-01 | 0.108 |
| 91775 | NXPE3 | P24T-E | Human | Esophagus | ESCC | 2.83e-07 | 1.51e-01 | 0.1287 |
| Page: 1 2 3 |
| Tissue | Expression Dynamics | Abbreviation |
| Esophagus | 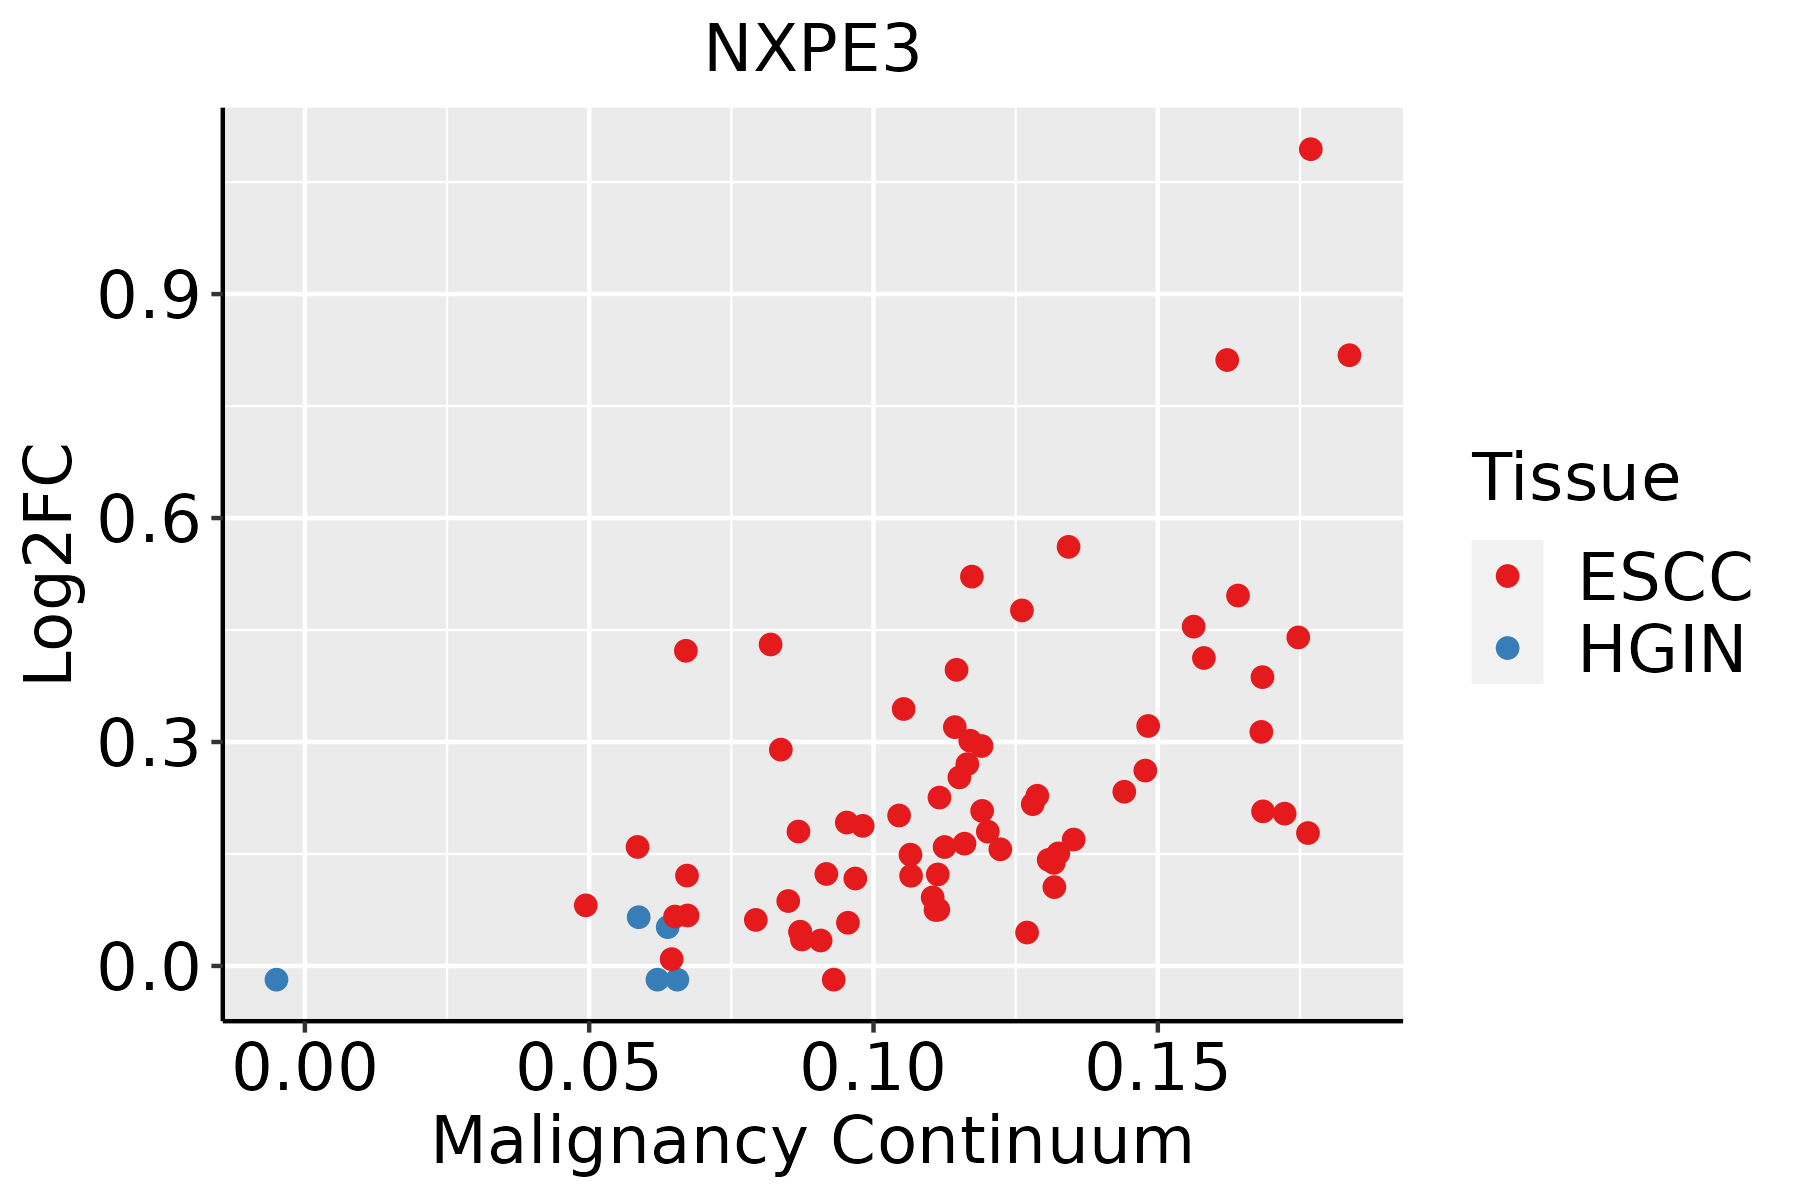 | ESCC: Esophageal squamous cell carcinoma |
| HGIN: High-grade intraepithelial neoplasias | ||
| LGIN: Low-grade intraepithelial neoplasias | ||
| Liver |  | HCC: Hepatocellular carcinoma |
| NAFLD: Non-alcoholic fatty liver disease |
| ∗log2FC in expression of this searched gene in stem-like cells from each diseased tissue sample relative to stem-like cells in normal samples in each tissue plotted against the malignancy continuum. Samples are colored based on if they are from different disease stage. |
Top |
Malignant transformation related pathway analysis |
| Find out the enriched GO biological processes and KEGG pathways involved in transition from healthy to precancer to cancer |
| Tissue | Disease Stage | Enriched GO biological Processes |
| Colorectum | AD |  |
| Colorectum | SER |  |
| Colorectum | MSS |  |
| Colorectum | MSI-H |  |
| Colorectum | FAP |  |
| ∗Top 15 enriched GO BP terms are showed in the bar plot of each disease state in each tissue. Each row represents a significant GO biological process which is colored according to the -log10(p.adjust). |
| Page: 1 2 3 4 5 6 7 8 9 |
| GO ID | Tissue | Disease Stage | Description | Gene Ratio | Bg Ratio | pvalue | p.adjust | Count |
| Page: 1 |
| Pathway ID | Tissue | Disease Stage | Description | Gene Ratio | Bg Ratio | pvalue | p.adjust | qvalue | Count |
| Page: 1 |
Top |
Cell-cell communication analysis |
| Identification of potential cell-cell interactions between two cell types and their ligand-receptor pairs for different disease states |
| Ligand | Receptor | LRpair | Pathway | Tissue | Disease Stage |
| Page: 1 |
Top |
Single-cell gene regulatory network inference analysis |
| Find out the significant the regulons (TFs) and the target genes of each regulon across cell types for different disease states |
| TF | Cell Type | Tissue | Disease Stage | Target Gene | RSS | Regulon Activity |
| ∗The dot plots of a searched regulon are shown for all cell subpopulations in each disease state of each tissue based on the regulon specific score inferred using pySCENIC and by calculating the average expression. |
| Page: 1 |
Top |
Somatic mutation of malignant transformation related genes |
| Annotation of somatic variants for genes involved in malignant transformation |
| Hugo Symbol | Variant Class | Variant Classification | dbSNP RS | HGVSc | HGVSp | HGVSp Short | SWISSPROT | BIOTYPE | SIFT | PolyPhen | Tumor Sample Barcode | Tissue | Histology | Sex | Age | Stage | Therapy Types | Drugs | Outcome |
| NXPE3 | SNV | Missense_Mutation | rs200277463 | c.1391N>A | p.Arg464His | p.R464H | Q969Y0 | protein_coding | deleterious(0.02) | possibly_damaging(0.629) | TCGA-AR-A1AI-01 | Breast | breast invasive carcinoma | Female | <65 | I/II | Chemotherapy | cytoxan | PD |
| NXPE3 | SNV | Missense_Mutation | rs763331084 | c.266T>G | p.Val89Gly | p.V89G | Q969Y0 | protein_coding | tolerated(0.38) | benign(0) | TCGA-AR-A1AY-01 | Breast | breast invasive carcinoma | Female | >=65 | I/II | Unspecific | Doxorubicin | SD |
| NXPE3 | SNV | Missense_Mutation | rs763331084 | c.266T>G | p.Val89Gly | p.V89G | Q969Y0 | protein_coding | tolerated(0.38) | benign(0) | TCGA-E2-A1LA-01 | Breast | breast invasive carcinoma | Female | <65 | I/II | Hormone Therapy | arimidex | SD |
| NXPE3 | insertion | Frame_Shift_Ins | novel | c.1582_1583insACATTCT | p.Leu528HisfsTer15 | p.L528Hfs*15 | Q969Y0 | protein_coding | TCGA-B6-A0IJ-01 | Breast | breast invasive carcinoma | Female | <65 | I/II | Unknown | Unknown | SD | ||
| NXPE3 | deletion | Frame_Shift_Del | novel | c.1635delN | p.Gln546SerfsTer41 | p.Q546Sfs*41 | Q969Y0 | protein_coding | TCGA-D8-A27V-01 | Breast | breast invasive carcinoma | Female | <65 | I/II | Hormone Therapy | tamoxiphen | SD | ||
| NXPE3 | SNV | Missense_Mutation | novel | c.653N>A | p.Arg218Lys | p.R218K | Q969Y0 | protein_coding | tolerated(0.34) | benign(0.288) | TCGA-C5-A2LZ-01 | Cervix | cervical & endocervical cancer | Female | >=65 | III/IV | Unknown | Unknown | PD |
| NXPE3 | SNV | Missense_Mutation | rs779031147 | c.1238G>A | p.Arg413His | p.R413H | Q969Y0 | protein_coding | deleterious(0.05) | benign(0.36) | TCGA-EA-A3HR-01 | Cervix | cervical & endocervical cancer | Female | <65 | I/II | Unknown | Unknown | SD |
| NXPE3 | SNV | Missense_Mutation | c.889N>C | p.Asp297His | p.D297H | Q969Y0 | protein_coding | deleterious(0.05) | possibly_damaging(0.711) | TCGA-FU-A3TX-01 | Cervix | cervical & endocervical cancer | Female | >=65 | I/II | Unknown | Unknown | SD | |
| NXPE3 | SNV | Missense_Mutation | rs147008534 | c.1015C>T | p.Arg339Cys | p.R339C | Q969Y0 | protein_coding | deleterious(0.01) | possibly_damaging(0.634) | TCGA-A6-5661-01 | Colorectum | colon adenocarcinoma | Female | >=65 | I/II | Unknown | Unknown | SD |
| NXPE3 | SNV | Missense_Mutation | c.191N>A | p.Gly64Asp | p.G64D | Q969Y0 | protein_coding | tolerated(0.15) | benign(0.045) | TCGA-AA-3710-01 | Colorectum | colon adenocarcinoma | Female | >=65 | I/II | Unknown | Unknown | SD |
| Page: 1 2 3 4 5 6 7 8 |
Top |
Related drugs of malignant transformation related genes |
| Identification of chemicals and drugs interact with genes involved in malignant transfromation |
| (DGIdb 4.0) |
| Entrez ID | Symbol | Category | Interaction Types | Drug Claim Name | Drug Name | PMIDs |
| Page: 1 |

Copyright 2023-Present -The University of Texas Health Science Center at Houston |