
|
|||||
|
 | |
| |
| |
| |
| |
| |
|
Gene: NXN |
Gene summary for NXN |
| Gene information | Species | Human | Gene symbol | NXN | Gene ID | 64359 |
| Gene name | nucleoredoxin | |
| Gene Alias | NRX | |
| Cytomap | 17p13.3 | |
| Gene Type | protein-coding | GO ID | GO:0001701 | UniProtAcc | Q6DKJ4 |
Top |
Malignant transformation analysis |
| Identification of the aberrant gene expression in precancerous and cancerous lesions by comparing the gene expression of stem-like cells in diseased tissues with normal stem cells |
| Entrez ID | Symbol | Replicates | Species | Organ | Tissue | Adj P-value | Log2FC | Malignancy |
| 64359 | NXN | CA_HPV_1 | Human | Cervix | CC | 6.02e-05 | -1.57e-01 | 0.0264 |
| 64359 | NXN | CCI_1 | Human | Cervix | CC | 3.50e-18 | 1.42e+00 | 0.528 |
| 64359 | NXN | CCI_2 | Human | Cervix | CC | 3.61e-05 | 6.87e-01 | 0.5249 |
| 64359 | NXN | CCI_3 | Human | Cervix | CC | 5.40e-04 | 6.85e-01 | 0.516 |
| 64359 | NXN | AEH-subject2 | Human | Endometrium | AEH | 1.55e-07 | 2.60e-01 | -0.2525 |
| 64359 | NXN | AEH-subject3 | Human | Endometrium | AEH | 1.28e-05 | 1.67e-01 | -0.2576 |
| 64359 | NXN | AEH-subject4 | Human | Endometrium | AEH | 3.74e-29 | 8.53e-01 | -0.2657 |
| 64359 | NXN | AEH-subject5 | Human | Endometrium | AEH | 1.33e-05 | 2.36e-01 | -0.2953 |
| 64359 | NXN | EEC-subject1 | Human | Endometrium | EEC | 3.98e-14 | 4.76e-01 | -0.2682 |
| 64359 | NXN | EEC-subject2 | Human | Endometrium | EEC | 1.47e-04 | 2.59e-01 | -0.2607 |
| 64359 | NXN | EEC-subject3 | Human | Endometrium | EEC | 5.60e-16 | 2.55e-01 | -0.2525 |
| 64359 | NXN | GSM5276935 | Human | Endometrium | EEC | 9.13e-07 | -2.03e-01 | -0.123 |
| 64359 | NXN | GSM6177620_NYU_UCEC1_lib1_lib1 | Human | Endometrium | EEC | 1.98e-13 | -2.01e-01 | -0.1869 |
| 64359 | NXN | GSM6177620_NYU_UCEC1_lib2_lib2 | Human | Endometrium | EEC | 1.10e-20 | -2.04e-01 | -0.1875 |
| 64359 | NXN | GSM6177620_NYU_UCEC1_lib3_lib3 | Human | Endometrium | EEC | 1.73e-14 | -2.15e-01 | -0.1883 |
| 64359 | NXN | GSM6177621_NYU_UCEC2_lib1_lib1 | Human | Endometrium | EEC | 2.08e-17 | -1.68e-01 | -0.1934 |
| 64359 | NXN | GSM6177622_NYU_UCEC3_lib1_lib1 | Human | Endometrium | EEC | 8.49e-18 | -6.75e-02 | -0.1917 |
| 64359 | NXN | GSM6177622_NYU_UCEC3_lib2_lib2 | Human | Endometrium | EEC | 5.15e-22 | -7.48e-02 | -0.1916 |
| 64359 | NXN | LZE22T | Human | Esophagus | ESCC | 2.91e-02 | 3.54e-01 | 0.068 |
| 64359 | NXN | LZE24T | Human | Esophagus | ESCC | 6.49e-08 | 1.44e-01 | 0.0596 |
| Page: 1 2 3 4 5 6 7 |
| Tissue | Expression Dynamics | Abbreviation |
| Cervix | 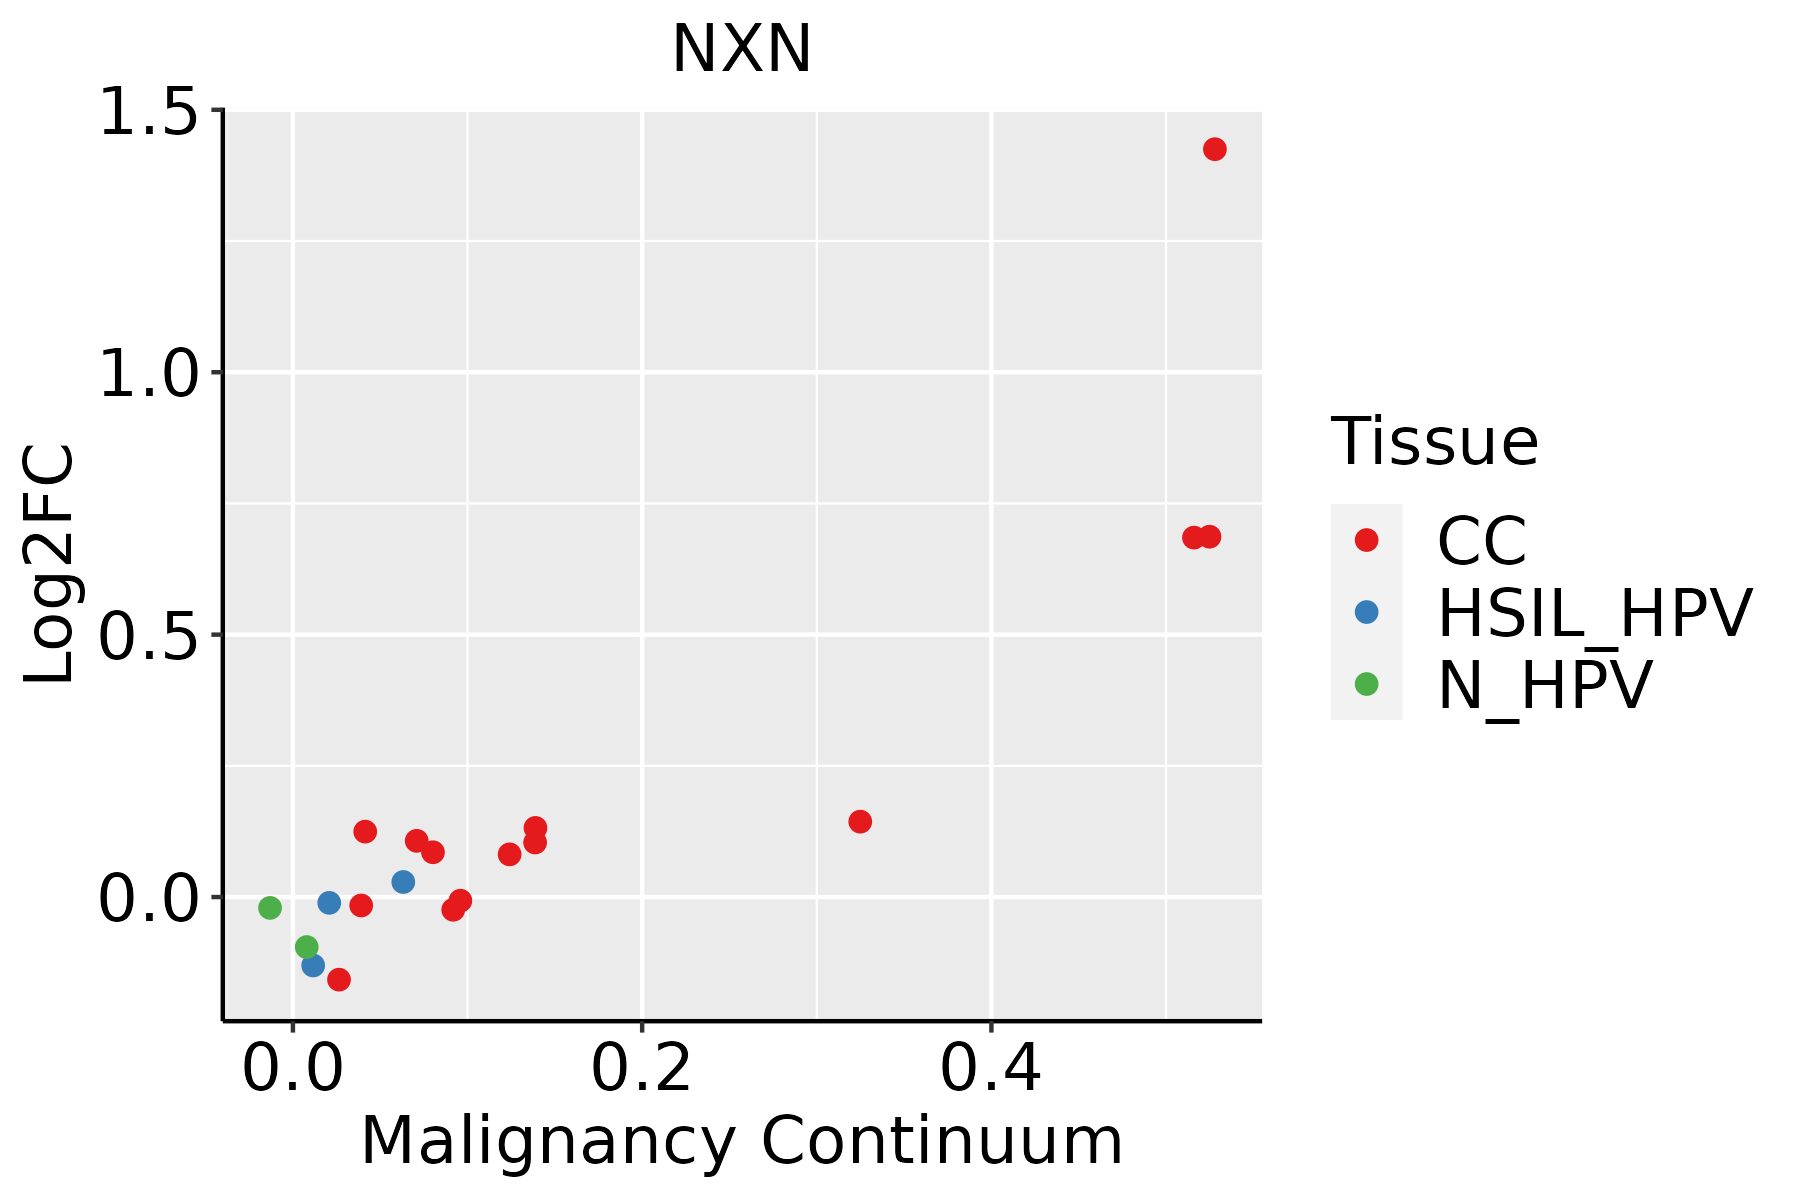 | CC: Cervix cancer |
| HSIL_HPV: HPV-infected high-grade squamous intraepithelial lesions | ||
| N_HPV: HPV-infected normal cervix | ||
| Endometrium | 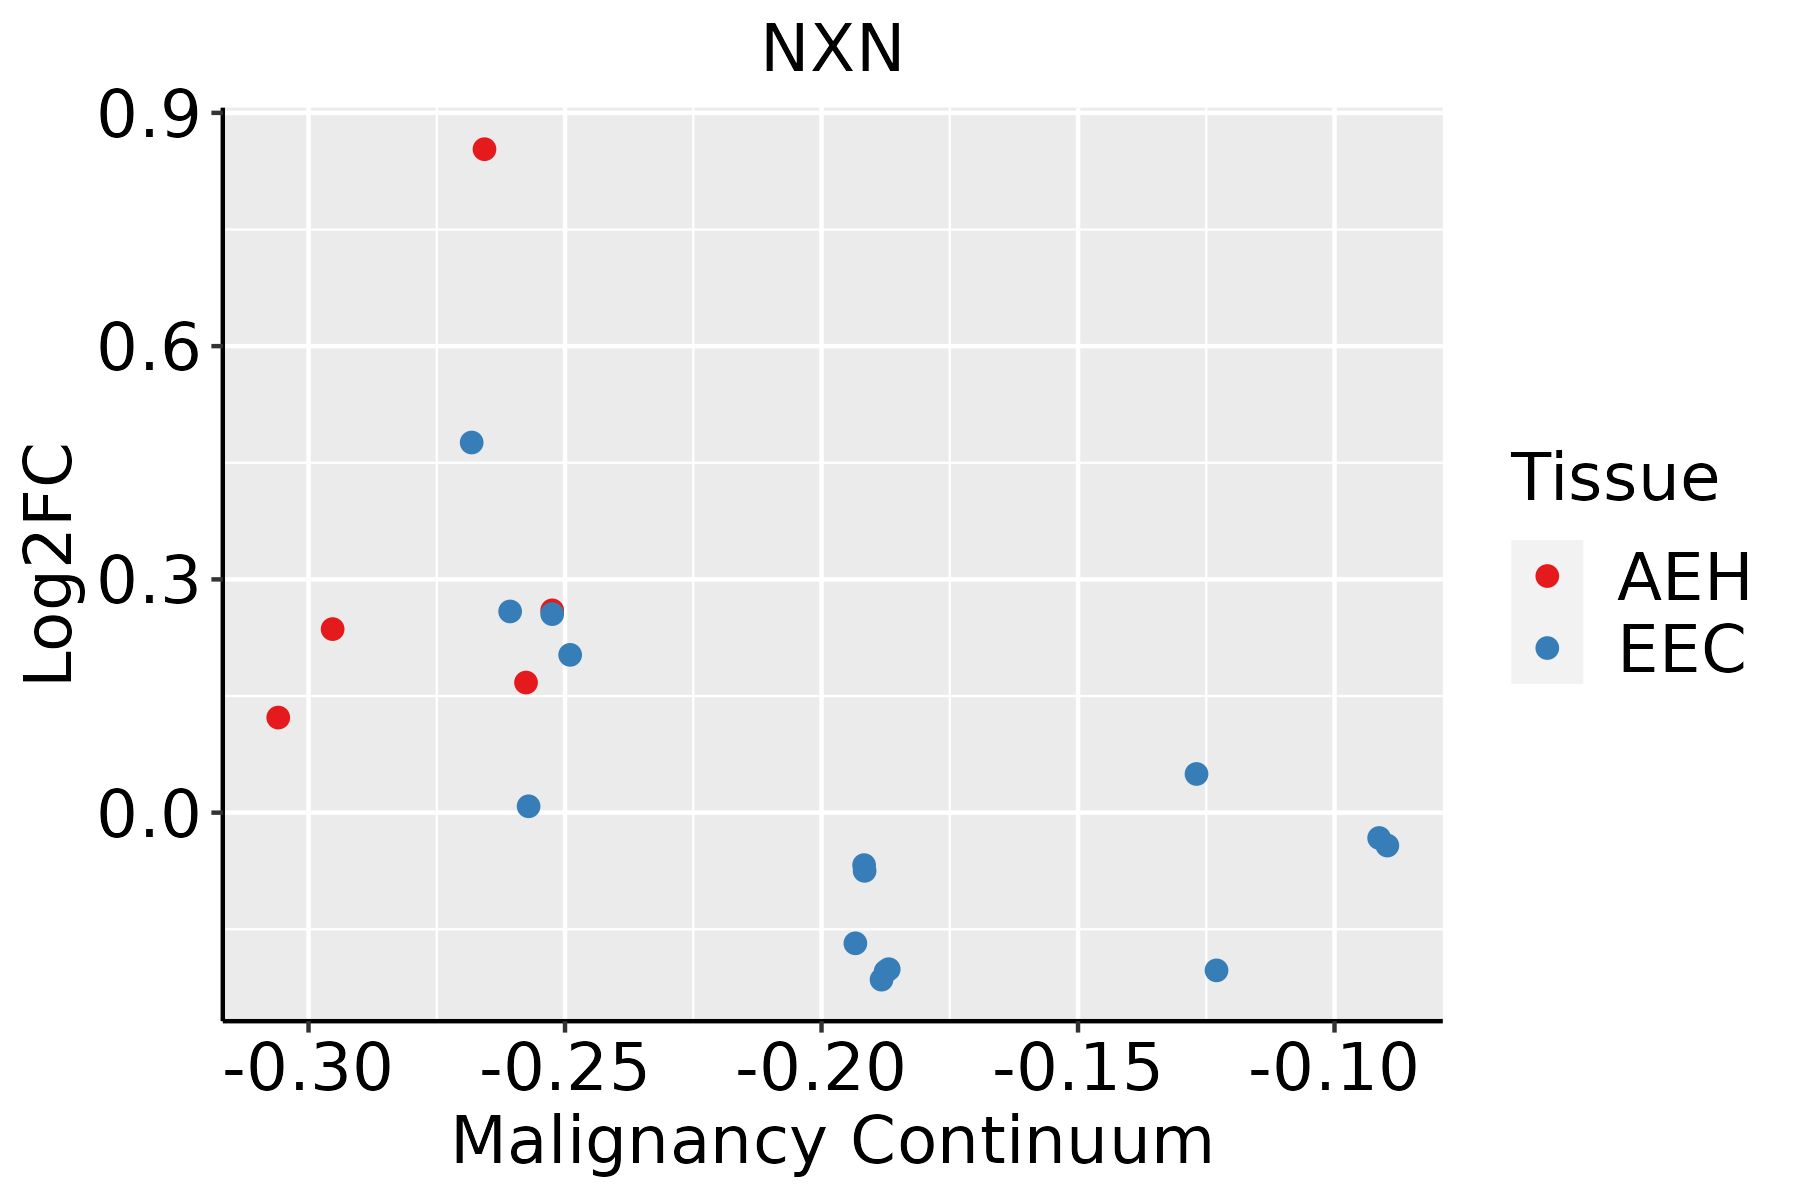 | AEH: Atypical endometrial hyperplasia |
| EEC: Endometrioid Cancer | ||
| Esophagus |  | ESCC: Esophageal squamous cell carcinoma |
| HGIN: High-grade intraepithelial neoplasias | ||
| LGIN: Low-grade intraepithelial neoplasias | ||
| Lung | 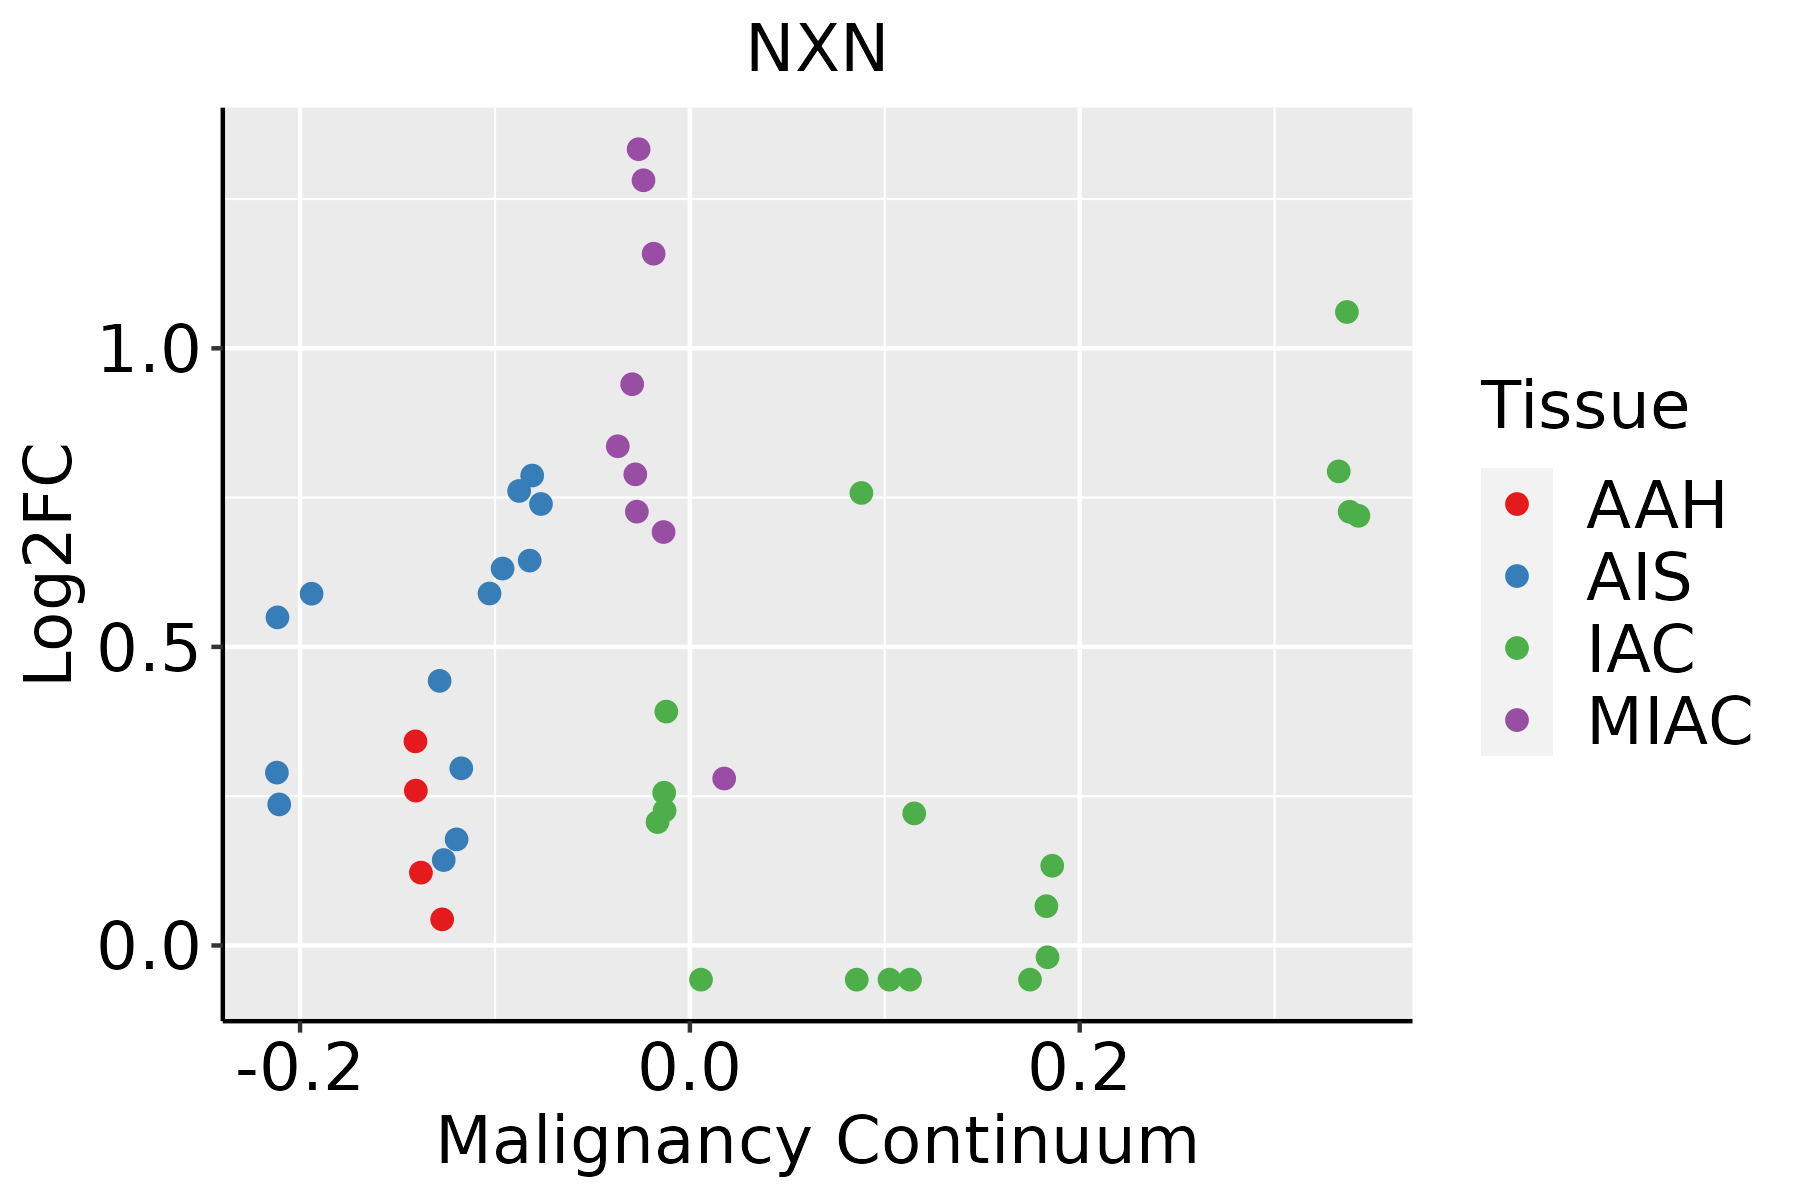 | AAH: Atypical adenomatous hyperplasia |
| AIS: Adenocarcinoma in situ | ||
| IAC: Invasive lung adenocarcinoma | ||
| MIA: Minimally invasive adenocarcinoma | ||
| Oral Cavity | 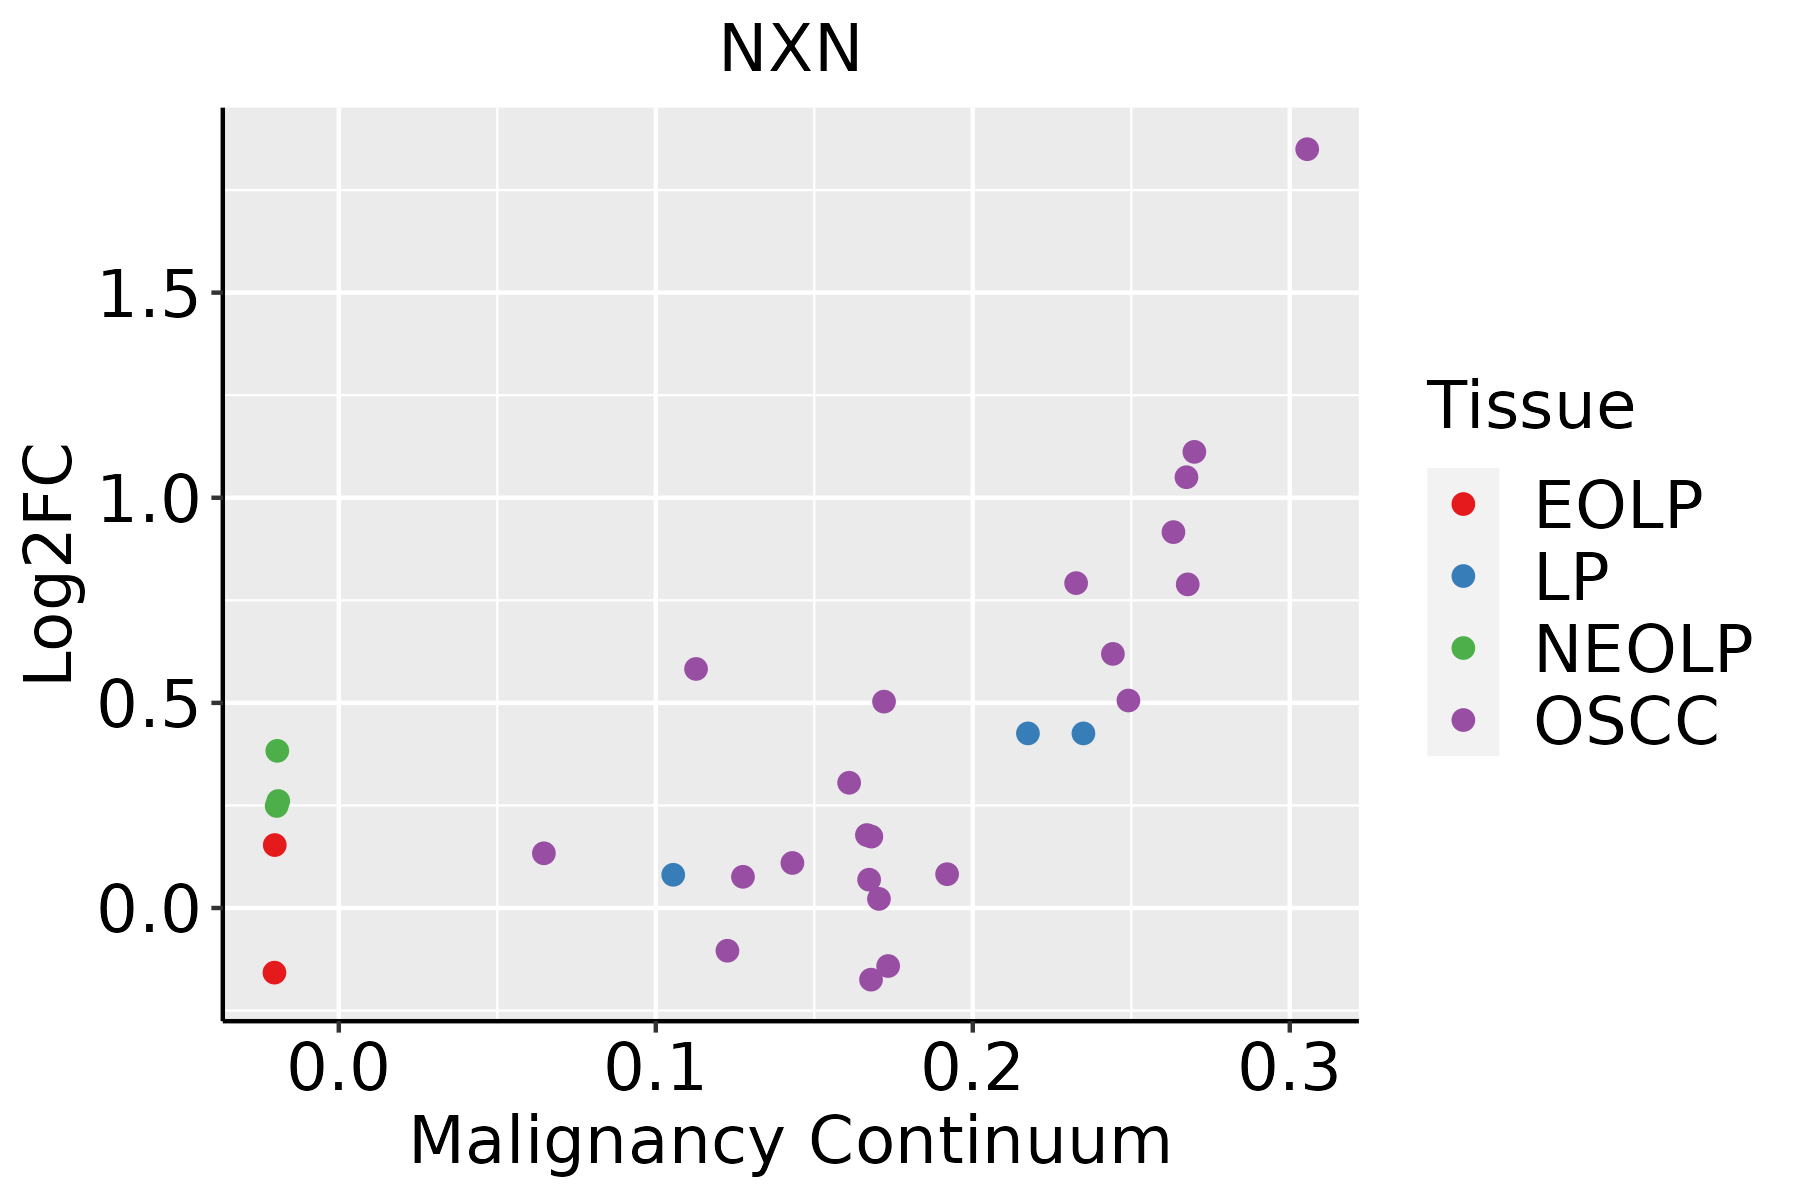 | EOLP: Erosive Oral lichen planus |
| LP: leukoplakia | ||
| NEOLP: Non-erosive oral lichen planus | ||
| OSCC: Oral squamous cell carcinoma | ||
| Prostate | 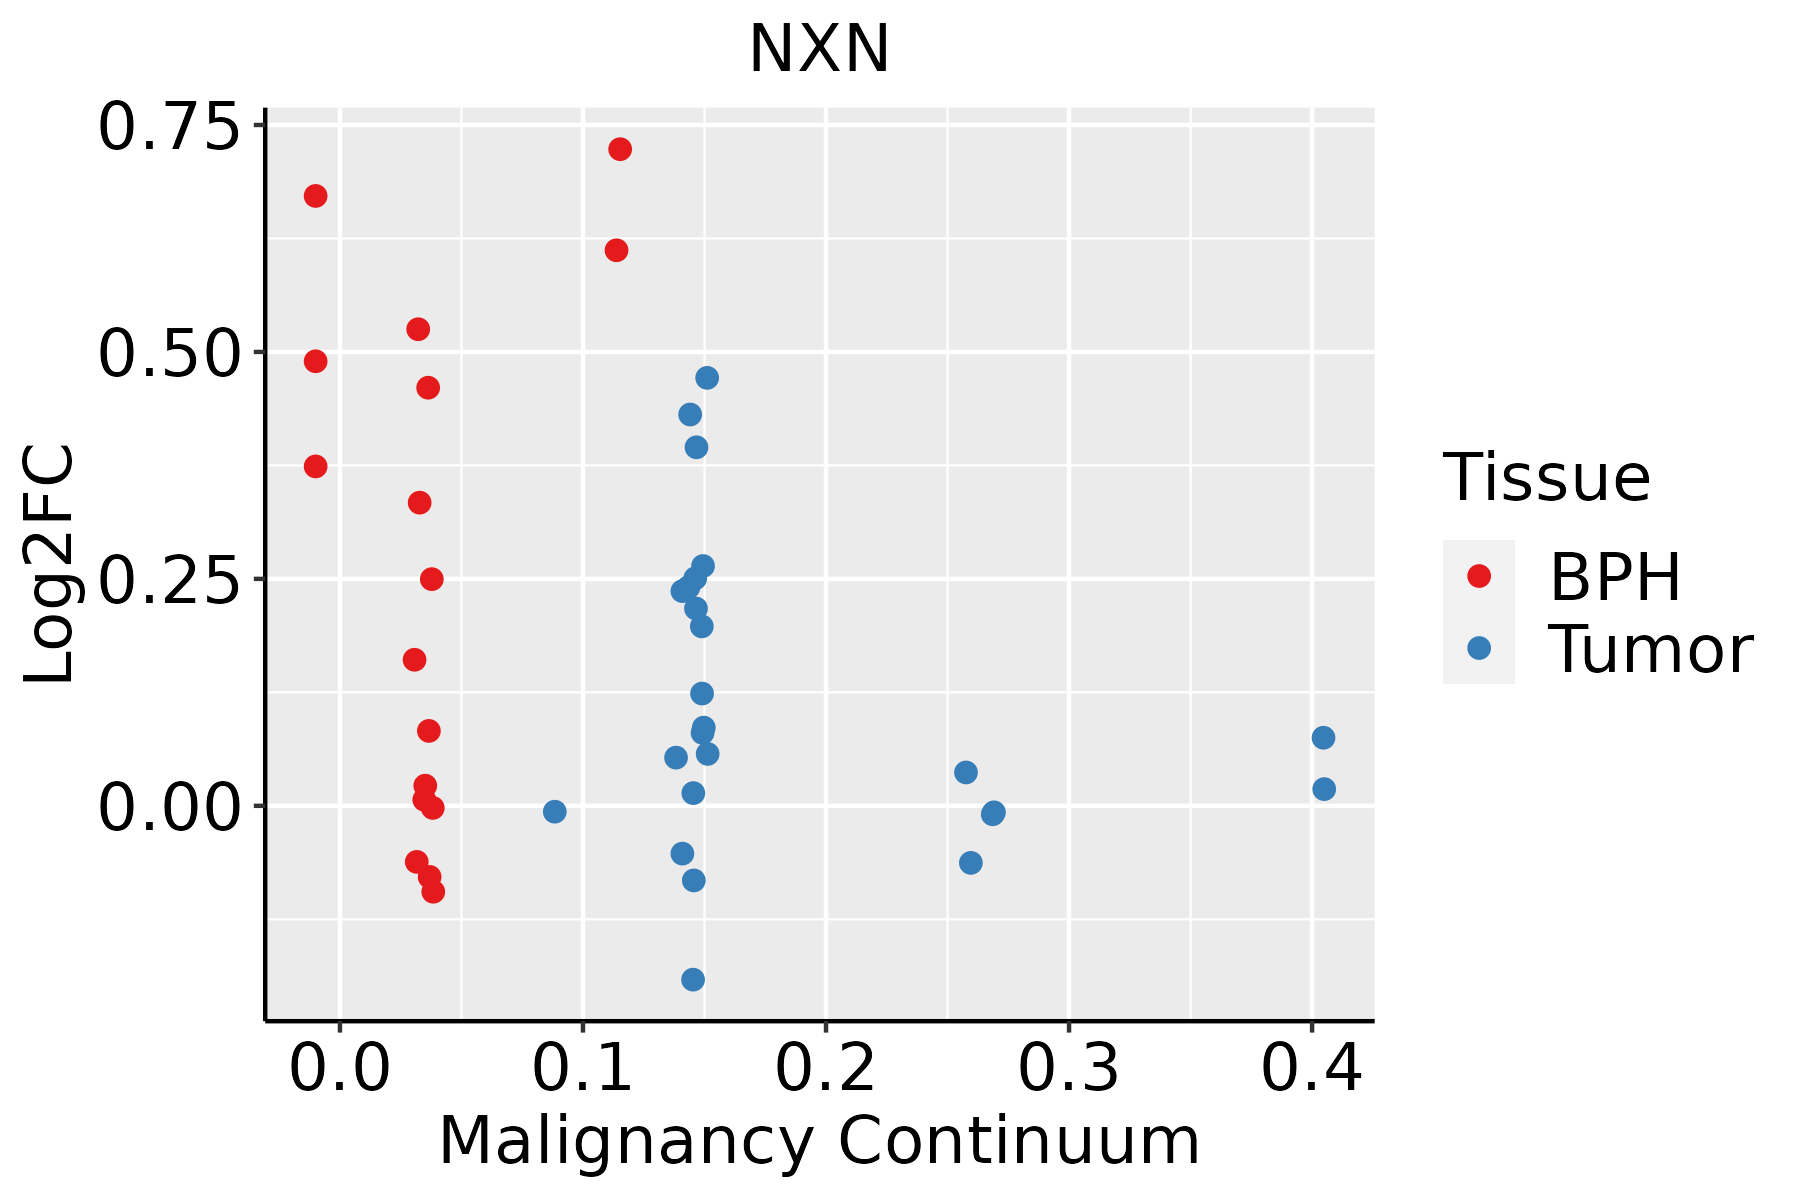 | BPH: Benign Prostatic Hyperplasia |
| Skin |  | AK: Actinic keratosis |
| cSCC: Cutaneous squamous cell carcinoma | ||
| SCCIS:squamous cell carcinoma in situ | ||
| Thyroid | 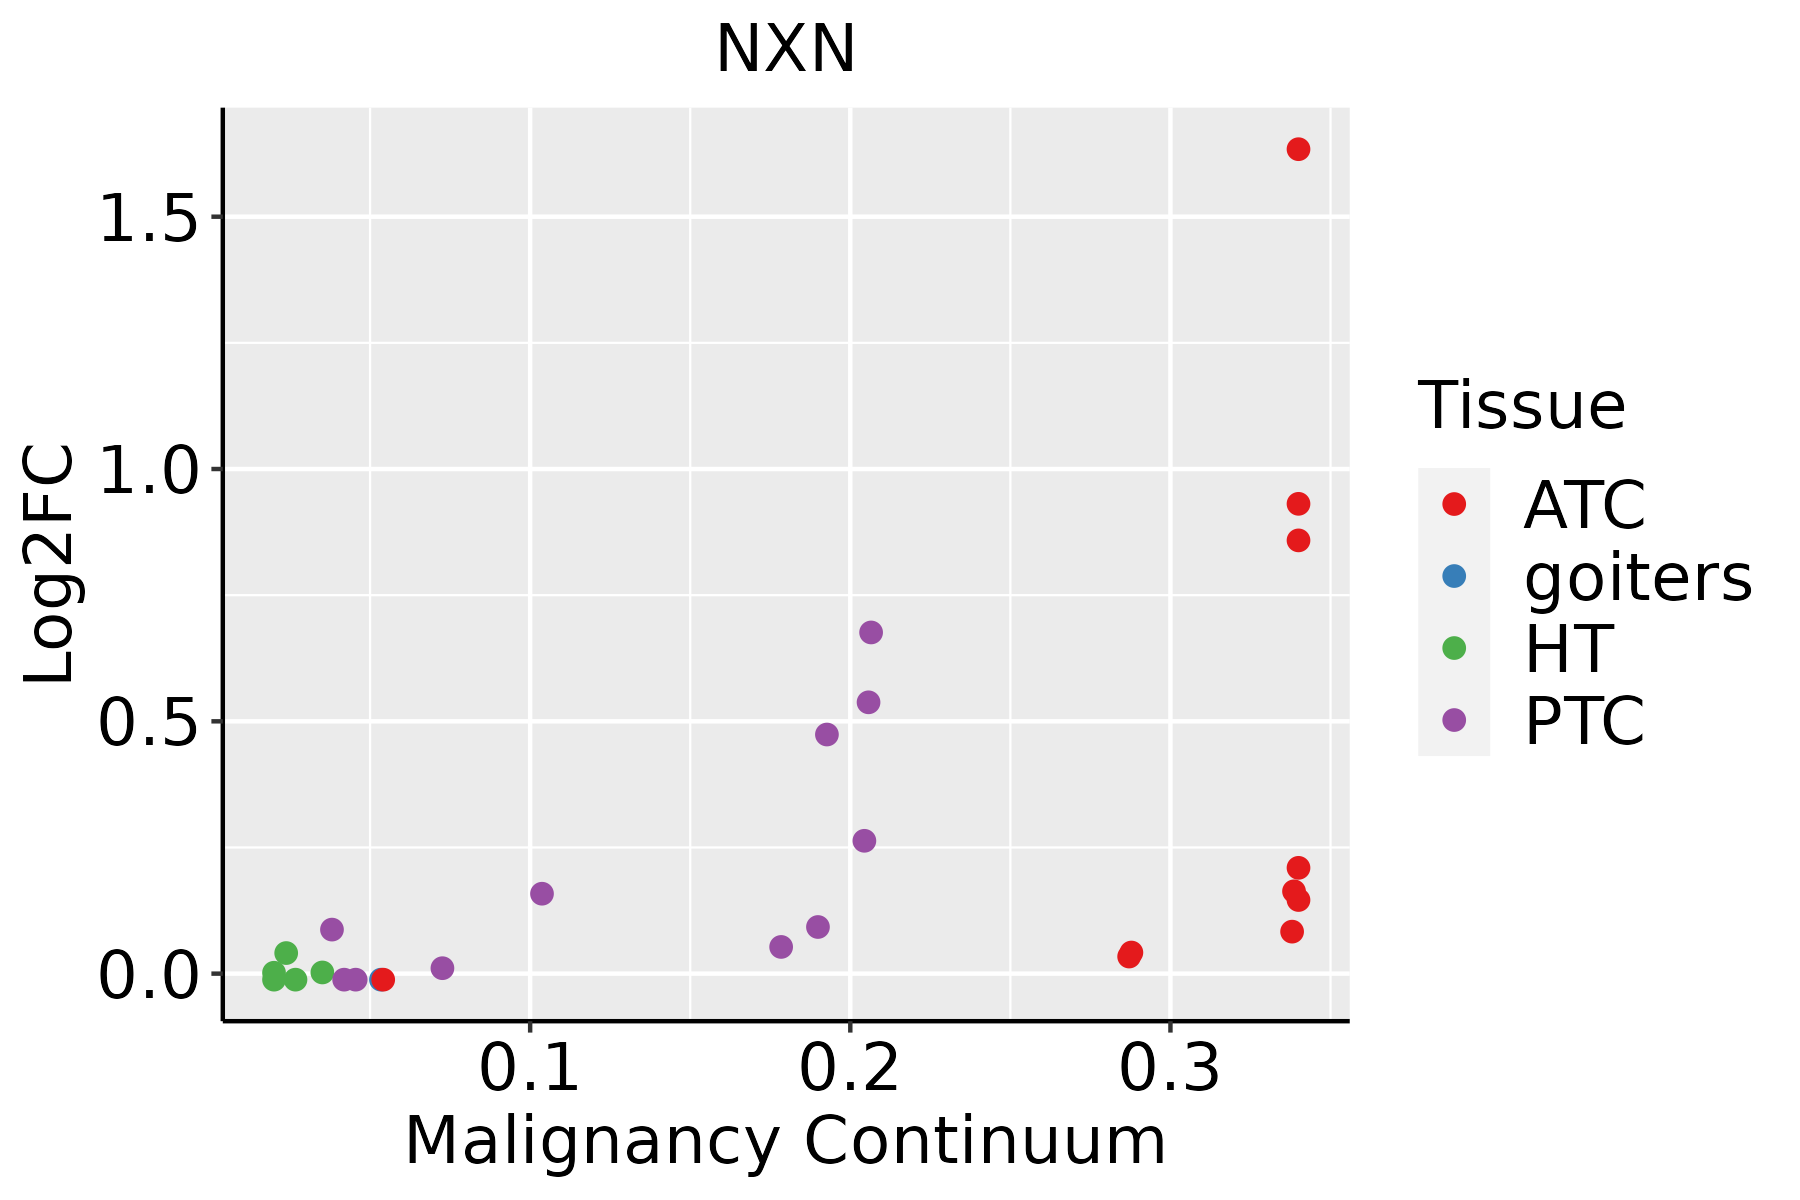 | ATC: Anaplastic thyroid cancer |
| HT: Hashimoto's thyroiditis | ||
| PTC: Papillary thyroid cancer |
| ∗log2FC in expression of this searched gene in stem-like cells from each diseased tissue sample relative to stem-like cells in normal samples in each tissue plotted against the malignancy continuum. Samples are colored based on if they are from different disease stage. |
Top |
Malignant transformation related pathway analysis |
| Find out the enriched GO biological processes and KEGG pathways involved in transition from healthy to precancer to cancer |
| Tissue | Disease Stage | Enriched GO biological Processes |
| Colorectum | AD |  |
| Colorectum | SER |  |
| Colorectum | MSS |  |
| Colorectum | MSI-H |  |
| Colorectum | FAP |  |
| ∗Top 15 enriched GO BP terms are showed in the bar plot of each disease state in each tissue. Each row represents a significant GO biological process which is colored according to the -log10(p.adjust). |
| Page: 1 2 3 4 5 6 7 8 9 |
| GO ID | Tissue | Disease Stage | Description | Gene Ratio | Bg Ratio | pvalue | p.adjust | Count |
| GO:190332010 | Cervix | CC | regulation of protein modification by small protein conjugation or removal | 66/2311 | 242/18723 | 2.31e-10 | 3.46e-08 | 66 |
| GO:003139610 | Cervix | CC | regulation of protein ubiquitination | 59/2311 | 210/18723 | 5.90e-10 | 7.51e-08 | 59 |
| GO:00160557 | Cervix | CC | Wnt signaling pathway | 98/2311 | 444/18723 | 4.82e-09 | 4.65e-07 | 98 |
| GO:01987387 | Cervix | CC | cell-cell signaling by wnt | 98/2311 | 446/18723 | 6.16e-09 | 5.58e-07 | 98 |
| GO:00301117 | Cervix | CC | regulation of Wnt signaling pathway | 76/2311 | 328/18723 | 3.05e-08 | 2.08e-06 | 76 |
| GO:003139710 | Cervix | CC | negative regulation of protein ubiquitination | 28/2311 | 83/18723 | 3.32e-07 | 1.35e-05 | 28 |
| GO:190332110 | Cervix | CC | negative regulation of protein modification by small protein conjugation or removal | 29/2311 | 95/18723 | 2.15e-06 | 6.55e-05 | 29 |
| GO:00988699 | Cervix | CC | cellular oxidant detoxification | 30/2311 | 101/18723 | 2.72e-06 | 7.93e-05 | 30 |
| GO:19907489 | Cervix | CC | cellular detoxification | 30/2311 | 116/18723 | 5.34e-05 | 7.94e-04 | 30 |
| GO:00017018 | Cervix | CC | in utero embryonic development | 71/2311 | 367/18723 | 7.21e-05 | 1.00e-03 | 71 |
| GO:00972379 | Cervix | CC | cellular response to toxic substance | 31/2311 | 124/18723 | 8.09e-05 | 1.10e-03 | 31 |
| GO:00096369 | Cervix | CC | response to toxic substance | 52/2311 | 262/18723 | 3.34e-04 | 3.52e-03 | 52 |
| GO:00987549 | Cervix | CC | detoxification | 33/2311 | 152/18723 | 7.97e-04 | 7.00e-03 | 33 |
| GO:00301784 | Cervix | CC | negative regulation of Wnt signaling pathway | 35/2311 | 170/18723 | 1.52e-03 | 1.17e-02 | 35 |
| GO:190332016 | Endometrium | AEH | regulation of protein modification by small protein conjugation or removal | 67/2100 | 242/18723 | 1.10e-12 | 2.26e-10 | 67 |
| GO:003139616 | Endometrium | AEH | regulation of protein ubiquitination | 57/2100 | 210/18723 | 1.24e-10 | 1.40e-08 | 57 |
| GO:00301118 | Endometrium | AEH | regulation of Wnt signaling pathway | 71/2100 | 328/18723 | 3.31e-08 | 1.87e-06 | 71 |
| GO:003139716 | Endometrium | AEH | negative regulation of protein ubiquitination | 28/2100 | 83/18723 | 4.36e-08 | 2.40e-06 | 28 |
| GO:190332116 | Endometrium | AEH | negative regulation of protein modification by small protein conjugation or removal | 30/2100 | 95/18723 | 7.94e-08 | 4.04e-06 | 30 |
| GO:00160558 | Endometrium | AEH | Wnt signaling pathway | 85/2100 | 444/18723 | 4.99e-07 | 1.97e-05 | 85 |
| Page: 1 2 3 4 5 6 7 8 9 10 11 |
| Pathway ID | Tissue | Disease Stage | Description | Gene Ratio | Bg Ratio | pvalue | p.adjust | qvalue | Count |
| Page: 1 |
Top |
Cell-cell communication analysis |
| Identification of potential cell-cell interactions between two cell types and their ligand-receptor pairs for different disease states |
| Ligand | Receptor | LRpair | Pathway | Tissue | Disease Stage |
| Page: 1 |
Top |
Single-cell gene regulatory network inference analysis |
| Find out the significant the regulons (TFs) and the target genes of each regulon across cell types for different disease states |
| TF | Cell Type | Tissue | Disease Stage | Target Gene | RSS | Regulon Activity |
| ∗The dot plots of a searched regulon are shown for all cell subpopulations in each disease state of each tissue based on the regulon specific score inferred using pySCENIC and by calculating the average expression. |
| Page: 1 |
Top |
Somatic mutation of malignant transformation related genes |
| Annotation of somatic variants for genes involved in malignant transformation |
| Hugo Symbol | Variant Class | Variant Classification | dbSNP RS | HGVSc | HGVSp | HGVSp Short | SWISSPROT | BIOTYPE | SIFT | PolyPhen | Tumor Sample Barcode | Tissue | Histology | Sex | Age | Stage | Therapy Types | Drugs | Outcome |
| NXN | SNV | Missense_Mutation | novel | c.464N>A | p.Arg155Gln | p.R155Q | Q6DKJ4 | protein_coding | tolerated(0.21) | probably_damaging(0.945) | TCGA-AC-A23H-01 | Breast | breast invasive carcinoma | Female | >=65 | I/II | Unknown | Unknown | PD |
| NXN | SNV | Missense_Mutation | c.600N>A | p.Phe200Leu | p.F200L | Q6DKJ4 | protein_coding | deleterious(0.04) | probably_damaging(0.977) | TCGA-AN-A046-01 | Breast | breast invasive carcinoma | Female | >=65 | I/II | Unknown | Unknown | SD | |
| NXN | SNV | Missense_Mutation | novel | c.1165N>T | p.Pro389Ser | p.P389S | Q6DKJ4 | protein_coding | tolerated(0.22) | probably_damaging(0.999) | TCGA-OL-A66J-01 | Breast | breast invasive carcinoma | Female | >=65 | I/II | Unknown | Unknown | SD |
| NXN | SNV | Missense_Mutation | novel | c.1205N>T | p.Ala402Val | p.A402V | Q6DKJ4 | protein_coding | tolerated(0.12) | probably_damaging(0.996) | TCGA-2W-A8YY-01 | Cervix | cervical & endocervical cancer | Female | <65 | I/II | Chemotherapy | cisplatin | CR |
| NXN | SNV | Missense_Mutation | c.383G>A | p.Arg128Gln | p.R128Q | Q6DKJ4 | protein_coding | deleterious(0.02) | benign(0.278) | TCGA-IR-A3LL-01 | Cervix | cervical & endocervical cancer | Female | <65 | I/II | Chemotherapy | cisplatin | CR | |
| NXN | SNV | Missense_Mutation | c.600N>A | p.Phe200Leu | p.F200L | Q6DKJ4 | protein_coding | deleterious(0.04) | probably_damaging(0.977) | TCGA-AA-A00N-01 | Colorectum | colon adenocarcinoma | Male | >=65 | I/II | Unknown | Unknown | PD | |
| NXN | SNV | Missense_Mutation | c.529C>T | p.Pro177Ser | p.P177S | Q6DKJ4 | protein_coding | tolerated(0.33) | probably_damaging(0.986) | TCGA-AD-A5EJ-01 | Colorectum | colon adenocarcinoma | Female | >=65 | I/II | Unknown | Unknown | SD | |
| NXN | SNV | Missense_Mutation | novel | c.1226N>G | p.Asp409Gly | p.D409G | Q6DKJ4 | protein_coding | tolerated(0.1) | probably_damaging(0.997) | TCGA-AZ-4315-01 | Colorectum | colon adenocarcinoma | Male | <65 | I/II | Unknown | Unknown | SD |
| NXN | SNV | Missense_Mutation | rs201764402 | c.604N>A | p.Ala202Thr | p.A202T | Q6DKJ4 | protein_coding | deleterious(0) | probably_damaging(0.995) | TCGA-CM-4743-01 | Colorectum | colon adenocarcinoma | Male | >=65 | I/II | Chemotherapy | capecitabine | SD |
| NXN | SNV | Missense_Mutation | novel | c.860T>C | p.Val287Ala | p.V287A | Q6DKJ4 | protein_coding | deleterious(0.03) | benign(0.197) | TCGA-G4-6588-01 | Colorectum | colon adenocarcinoma | Female | <65 | I/II | Unknown | Unknown | SD |
| Page: 1 2 3 4 |
Top |
Related drugs of malignant transformation related genes |
| Identification of chemicals and drugs interact with genes involved in malignant transfromation |
| (DGIdb 4.0) |
| Entrez ID | Symbol | Category | Interaction Types | Drug Claim Name | Drug Name | PMIDs |
| Page: 1 |

Copyright 2023-Present -The University of Texas Health Science Center at Houston |