
|
|||||
|
 | |
| |
| |
| |
| |
| |
|
Gene: NVL |
Gene summary for NVL |
| Gene information | Species | Human | Gene symbol | NVL | Gene ID | 4931 |
| Gene name | nuclear VCP like | |
| Gene Alias | NVL2 | |
| Cytomap | 1q42.11 | |
| Gene Type | protein-coding | GO ID | GO:0006139 | UniProtAcc | O15381 |
Top |
Malignant transformation analysis |
| Identification of the aberrant gene expression in precancerous and cancerous lesions by comparing the gene expression of stem-like cells in diseased tissues with normal stem cells |
| Entrez ID | Symbol | Replicates | Species | Organ | Tissue | Adj P-value | Log2FC | Malignancy |
| 4931 | NVL | HTA11_3410_2000001011 | Human | Colorectum | AD | 1.31e-07 | -3.99e-01 | 0.0155 |
| 4931 | NVL | HTA11_347_2000001011 | Human | Colorectum | AD | 4.34e-08 | 5.47e-01 | -0.1954 |
| 4931 | NVL | HTA11_866_3004761011 | Human | Colorectum | AD | 1.98e-05 | -4.34e-01 | 0.096 |
| 4931 | NVL | HTA11_99999970781_79442 | Human | Colorectum | MSS | 7.27e-08 | -3.63e-01 | 0.294 |
| 4931 | NVL | HTA11_99999974143_84620 | Human | Colorectum | MSS | 2.28e-06 | -3.69e-01 | 0.3005 |
| 4931 | NVL | A002-C-010 | Human | Colorectum | FAP | 1.45e-05 | -2.05e-01 | 0.242 |
| 4931 | NVL | A001-C-207 | Human | Colorectum | FAP | 1.04e-06 | -3.23e-01 | 0.1278 |
| 4931 | NVL | A015-C-203 | Human | Colorectum | FAP | 3.70e-27 | -3.27e-01 | -0.1294 |
| 4931 | NVL | A015-C-204 | Human | Colorectum | FAP | 2.46e-06 | -3.53e-01 | -0.0228 |
| 4931 | NVL | A014-C-040 | Human | Colorectum | FAP | 4.02e-03 | -2.72e-01 | -0.1184 |
| 4931 | NVL | A002-C-201 | Human | Colorectum | FAP | 1.69e-11 | -3.18e-01 | 0.0324 |
| 4931 | NVL | A002-C-203 | Human | Colorectum | FAP | 4.49e-08 | -2.39e-01 | 0.2786 |
| 4931 | NVL | A001-C-119 | Human | Colorectum | FAP | 2.65e-06 | -2.47e-01 | -0.1557 |
| 4931 | NVL | A001-C-108 | Human | Colorectum | FAP | 9.28e-15 | -2.35e-01 | -0.0272 |
| 4931 | NVL | A002-C-205 | Human | Colorectum | FAP | 7.26e-18 | -2.72e-01 | -0.1236 |
| 4931 | NVL | A001-C-104 | Human | Colorectum | FAP | 2.67e-03 | -1.88e-01 | 0.0184 |
| 4931 | NVL | A015-C-005 | Human | Colorectum | FAP | 6.61e-05 | -2.93e-01 | -0.0336 |
| 4931 | NVL | A015-C-006 | Human | Colorectum | FAP | 3.53e-12 | -3.35e-01 | -0.0994 |
| 4931 | NVL | A015-C-106 | Human | Colorectum | FAP | 2.80e-13 | -3.13e-01 | -0.0511 |
| 4931 | NVL | A002-C-114 | Human | Colorectum | FAP | 3.11e-15 | -3.46e-01 | -0.1561 |
| Page: 1 2 3 4 5 |
| Tissue | Expression Dynamics | Abbreviation |
| Colorectum (GSE201348) |  | FAP: Familial adenomatous polyposis |
| CRC: Colorectal cancer | ||
| Colorectum (HTA11) |  | AD: Adenomas |
| SER: Sessile serrated lesions | ||
| MSI-H: Microsatellite-high colorectal cancer | ||
| MSS: Microsatellite stable colorectal cancer | ||
| Esophagus | 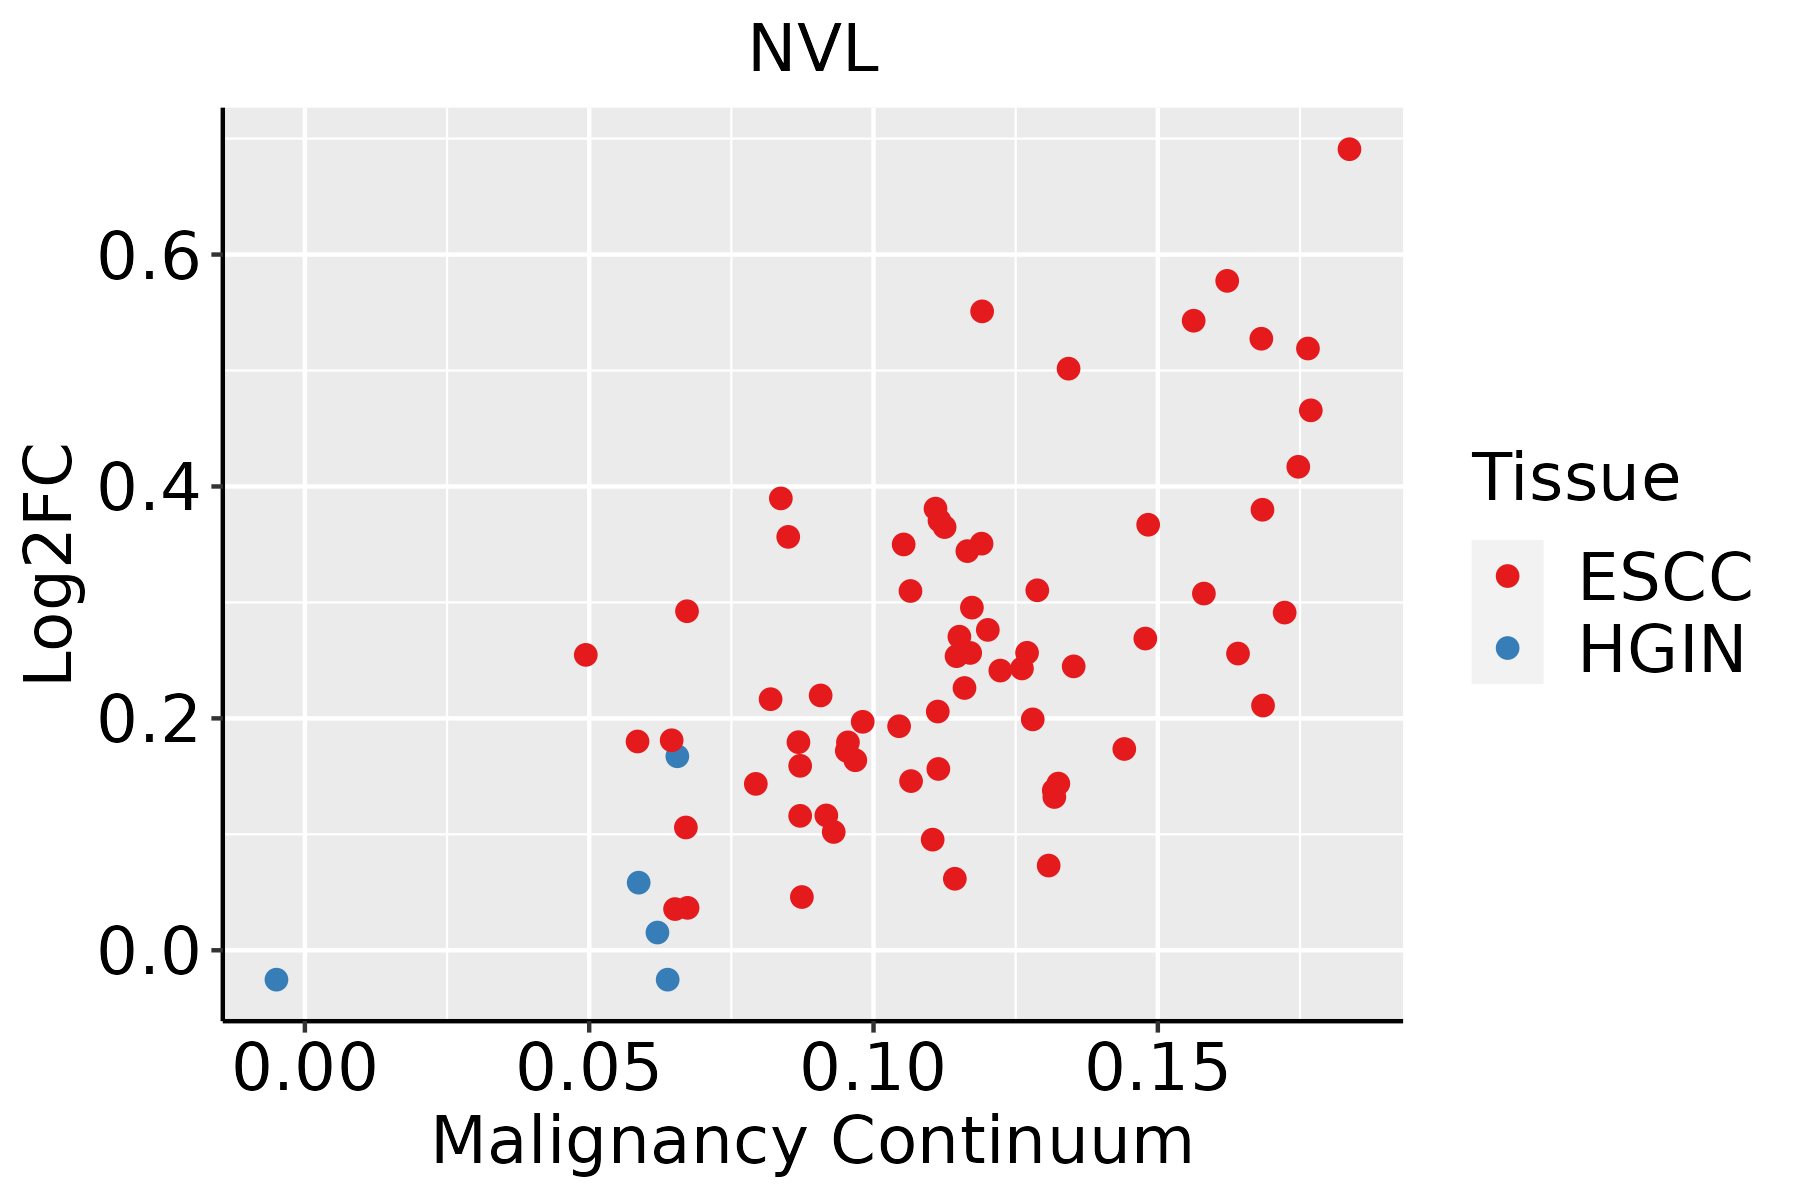 | ESCC: Esophageal squamous cell carcinoma |
| HGIN: High-grade intraepithelial neoplasias | ||
| LGIN: Low-grade intraepithelial neoplasias | ||
| Liver |  | HCC: Hepatocellular carcinoma |
| NAFLD: Non-alcoholic fatty liver disease |
| ∗log2FC in expression of this searched gene in stem-like cells from each diseased tissue sample relative to stem-like cells in normal samples in each tissue plotted against the malignancy continuum. Samples are colored based on if they are from different disease stage. |
Top |
Malignant transformation related pathway analysis |
| Find out the enriched GO biological processes and KEGG pathways involved in transition from healthy to precancer to cancer |
| Tissue | Disease Stage | Enriched GO biological Processes |
| Colorectum | AD |  |
| Colorectum | SER |  |
| Colorectum | MSS |  |
| Colorectum | MSI-H |  |
| Colorectum | FAP |  |
| ∗Top 15 enriched GO BP terms are showed in the bar plot of each disease state in each tissue. Each row represents a significant GO biological process which is colored according to the -log10(p.adjust). |
| Page: 1 2 3 4 5 6 7 8 9 |
| GO ID | Tissue | Disease Stage | Description | Gene Ratio | Bg Ratio | pvalue | p.adjust | Count |
| GO:0051098 | Colorectum | AD | regulation of binding | 126/3918 | 363/18723 | 6.01e-10 | 4.88e-08 | 126 |
| GO:0022613 | Colorectum | AD | ribonucleoprotein complex biogenesis | 151/3918 | 463/18723 | 1.96e-09 | 1.39e-07 | 151 |
| GO:0051099 | Colorectum | AD | positive regulation of binding | 66/3918 | 173/18723 | 1.47e-07 | 6.64e-06 | 66 |
| GO:1900180 | Colorectum | AD | regulation of protein localization to nucleus | 55/3918 | 136/18723 | 1.70e-07 | 7.34e-06 | 55 |
| GO:0051052 | Colorectum | AD | regulation of DNA metabolic process | 116/3918 | 359/18723 | 2.47e-07 | 1.00e-05 | 116 |
| GO:0051054 | Colorectum | AD | positive regulation of DNA metabolic process | 73/3918 | 201/18723 | 3.27e-07 | 1.29e-05 | 73 |
| GO:0034504 | Colorectum | AD | protein localization to nucleus | 94/3918 | 290/18723 | 2.83e-06 | 8.09e-05 | 94 |
| GO:0043393 | Colorectum | AD | regulation of protein binding | 68/3918 | 196/18723 | 5.17e-06 | 1.34e-04 | 68 |
| GO:2000278 | Colorectum | AD | regulation of DNA biosynthetic process | 41/3918 | 106/18723 | 2.17e-05 | 4.33e-04 | 41 |
| GO:2000573 | Colorectum | AD | positive regulation of DNA biosynthetic process | 28/3918 | 66/18723 | 6.35e-05 | 1.05e-03 | 28 |
| GO:0051972 | Colorectum | AD | regulation of telomerase activity | 22/3918 | 47/18723 | 6.45e-05 | 1.07e-03 | 22 |
| GO:0032092 | Colorectum | AD | positive regulation of protein binding | 33/3918 | 85/18723 | 1.22e-04 | 1.78e-03 | 33 |
| GO:0051973 | Colorectum | AD | positive regulation of telomerase activity | 17/3918 | 34/18723 | 1.59e-04 | 2.20e-03 | 17 |
| GO:0042273 | Colorectum | AD | ribosomal large subunit biogenesis | 28/3918 | 72/18723 | 3.74e-04 | 4.31e-03 | 28 |
| GO:0071897 | Colorectum | AD | DNA biosynthetic process | 55/3918 | 180/18723 | 1.46e-03 | 1.24e-02 | 55 |
| GO:0042254 | Colorectum | AD | ribosome biogenesis | 84/3918 | 299/18723 | 1.82e-03 | 1.50e-02 | 84 |
| GO:00226132 | Colorectum | MSS | ribonucleoprotein complex biogenesis | 144/3467 | 463/18723 | 2.76e-11 | 3.67e-09 | 144 |
| GO:00510982 | Colorectum | MSS | regulation of binding | 113/3467 | 363/18723 | 3.55e-09 | 2.41e-07 | 113 |
| GO:19001802 | Colorectum | MSS | regulation of protein localization to nucleus | 54/3467 | 136/18723 | 6.20e-09 | 3.95e-07 | 54 |
| GO:00345042 | Colorectum | MSS | protein localization to nucleus | 92/3467 | 290/18723 | 3.66e-08 | 1.98e-06 | 92 |
| Page: 1 2 3 4 5 |
| Pathway ID | Tissue | Disease Stage | Description | Gene Ratio | Bg Ratio | pvalue | p.adjust | qvalue | Count |
| Page: 1 |
Top |
Cell-cell communication analysis |
| Identification of potential cell-cell interactions between two cell types and their ligand-receptor pairs for different disease states |
| Ligand | Receptor | LRpair | Pathway | Tissue | Disease Stage |
| Page: 1 |
Top |
Single-cell gene regulatory network inference analysis |
| Find out the significant the regulons (TFs) and the target genes of each regulon across cell types for different disease states |
| TF | Cell Type | Tissue | Disease Stage | Target Gene | RSS | Regulon Activity |
| ∗The dot plots of a searched regulon are shown for all cell subpopulations in each disease state of each tissue based on the regulon specific score inferred using pySCENIC and by calculating the average expression. |
| Page: 1 |
Top |
Somatic mutation of malignant transformation related genes |
| Annotation of somatic variants for genes involved in malignant transformation |
| Hugo Symbol | Variant Class | Variant Classification | dbSNP RS | HGVSc | HGVSp | HGVSp Short | SWISSPROT | BIOTYPE | SIFT | PolyPhen | Tumor Sample Barcode | Tissue | Histology | Sex | Age | Stage | Therapy Types | Drugs | Outcome |
| NVL | SNV | Missense_Mutation | rs755757900 | c.1366G>A | p.Ala456Thr | p.A456T | O15381 | protein_coding | tolerated(0.44) | benign(0) | TCGA-A2-A0CX-01 | Breast | breast invasive carcinoma | Female | <65 | I/II | Chemotherapy | adriamycin | SD |
| NVL | SNV | Missense_Mutation | rs751450518 | c.1543N>G | p.Arg515Gly | p.R515G | O15381 | protein_coding | tolerated(0.41) | benign(0) | TCGA-A8-A09A-01 | Breast | breast invasive carcinoma | Female | <65 | I/II | Hormone Therapy | tamoxiphen | SD |
| NVL | SNV | Missense_Mutation | c.2527G>A | p.Asp843Asn | p.D843N | O15381 | protein_coding | deleterious(0.02) | possibly_damaging(0.717) | TCGA-A8-A09K-01 | Breast | breast invasive carcinoma | Female | >=65 | I/II | Unknown | Unknown | SD | |
| NVL | SNV | Missense_Mutation | novel | c.968N>C | p.Asp323Ala | p.D323A | O15381 | protein_coding | tolerated(0.22) | benign(0.014) | TCGA-AQ-A1H3-01 | Breast | breast invasive carcinoma | Female | <65 | III/IV | Chemotherapy | adriamycin | SD |
| NVL | SNV | Missense_Mutation | novel | c.968A>C | p.Asp323Ala | p.D323A | O15381 | protein_coding | tolerated(0.22) | benign(0.014) | TCGA-BH-A1F5-01 | Breast | breast invasive carcinoma | Female | <65 | I/II | Unknown | Unknown | SD |
| NVL | SNV | Missense_Mutation | rs376797399 | c.2078G>A | p.Arg693Gln | p.R693Q | O15381 | protein_coding | tolerated(0.59) | benign(0.108) | TCGA-C8-A3M7-01 | Breast | breast invasive carcinoma | Female | <65 | III/IV | Unknown | Unknown | PD |
| NVL | SNV | Missense_Mutation | c.2401T>G | p.Ser801Ala | p.S801A | O15381 | protein_coding | tolerated(0.35) | benign(0.076) | TCGA-D8-A1JK-01 | Breast | breast invasive carcinoma | Female | >=65 | I/II | Unknown | Unknown | SD | |
| NVL | SNV | Missense_Mutation | novel | c.968N>C | p.Asp323Ala | p.D323A | O15381 | protein_coding | tolerated(0.22) | benign(0.014) | TCGA-D8-A1JP-01 | Breast | breast invasive carcinoma | Female | >=65 | I/II | Hormone Therapy | tamoxiphen | SD |
| NVL | SNV | Missense_Mutation | novel | c.1885A>G | p.Thr629Ala | p.T629A | O15381 | protein_coding | deleterious(0) | probably_damaging(0.999) | TCGA-JL-A3YW-01 | Breast | breast invasive carcinoma | Female | <65 | I/II | Unknown | Unknown | SD |
| NVL | SNV | Missense_Mutation | rs761421541 | c.2351G>A | p.Arg784His | p.R784H | O15381 | protein_coding | deleterious(0.04) | benign(0.013) | TCGA-2W-A8YY-01 | Cervix | cervical & endocervical cancer | Female | <65 | I/II | Chemotherapy | cisplatin | CR |
| Page: 1 2 3 4 5 6 7 8 9 |
Top |
Related drugs of malignant transformation related genes |
| Identification of chemicals and drugs interact with genes involved in malignant transfromation |
| (DGIdb 4.0) |
| Entrez ID | Symbol | Category | Interaction Types | Drug Claim Name | Drug Name | PMIDs |
| Page: 1 |

Copyright 2023-Present -The University of Texas Health Science Center at Houston |