
|
|||||
|
 | |
| |
| |
| |
| |
| |
|
Gene: NUSAP1 |
Gene summary for NUSAP1 |
| Gene information | Species | Human | Gene symbol | NUSAP1 | Gene ID | 51203 |
| Gene name | nucleolar and spindle associated protein 1 | |
| Gene Alias | ANKT | |
| Cytomap | 15q15.1 | |
| Gene Type | protein-coding | GO ID | GO:0000070 | UniProtAcc | Q9BXS6 |
Top |
Malignant transformation analysis |
| Identification of the aberrant gene expression in precancerous and cancerous lesions by comparing the gene expression of stem-like cells in diseased tissues with normal stem cells |
| Entrez ID | Symbol | Replicates | Species | Organ | Tissue | Adj P-value | Log2FC | Malignancy |
| 51203 | NUSAP1 | LZE2T | Human | Esophagus | ESCC | 3.12e-05 | 1.04e+00 | 0.082 |
| 51203 | NUSAP1 | LZE4T | Human | Esophagus | ESCC | 3.40e-04 | 3.23e-01 | 0.0811 |
| 51203 | NUSAP1 | LZE7T | Human | Esophagus | ESCC | 2.72e-03 | 4.31e-01 | 0.0667 |
| 51203 | NUSAP1 | LZE22T | Human | Esophagus | ESCC | 1.27e-02 | 3.59e-01 | 0.068 |
| 51203 | NUSAP1 | LZE21T | Human | Esophagus | ESCC | 3.84e-08 | 7.12e-01 | 0.0655 |
| 51203 | NUSAP1 | LZE6T | Human | Esophagus | ESCC | 7.47e-05 | 2.95e-01 | 0.0845 |
| 51203 | NUSAP1 | P1T-E | Human | Esophagus | ESCC | 4.91e-05 | 3.18e-01 | 0.0875 |
| 51203 | NUSAP1 | P2T-E | Human | Esophagus | ESCC | 3.07e-08 | 6.06e-01 | 0.1177 |
| 51203 | NUSAP1 | P4T-E | Human | Esophagus | ESCC | 9.09e-23 | 8.24e-01 | 0.1323 |
| 51203 | NUSAP1 | P5T-E | Human | Esophagus | ESCC | 4.34e-21 | 8.83e-01 | 0.1327 |
| 51203 | NUSAP1 | P8T-E | Human | Esophagus | ESCC | 3.29e-05 | 3.98e-01 | 0.0889 |
| 51203 | NUSAP1 | P9T-E | Human | Esophagus | ESCC | 2.70e-15 | 6.95e-01 | 0.1131 |
| 51203 | NUSAP1 | P10T-E | Human | Esophagus | ESCC | 1.89e-11 | 7.09e-01 | 0.116 |
| 51203 | NUSAP1 | P11T-E | Human | Esophagus | ESCC | 7.94e-04 | 2.78e-01 | 0.1426 |
| 51203 | NUSAP1 | P12T-E | Human | Esophagus | ESCC | 3.02e-09 | 3.33e-01 | 0.1122 |
| 51203 | NUSAP1 | P15T-E | Human | Esophagus | ESCC | 8.38e-08 | 3.65e-01 | 0.1149 |
| 51203 | NUSAP1 | P16T-E | Human | Esophagus | ESCC | 1.16e-04 | 3.71e-01 | 0.1153 |
| 51203 | NUSAP1 | P17T-E | Human | Esophagus | ESCC | 4.08e-02 | 4.79e-01 | 0.1278 |
| 51203 | NUSAP1 | P19T-E | Human | Esophagus | ESCC | 4.54e-02 | 4.04e-01 | 0.1662 |
| 51203 | NUSAP1 | P20T-E | Human | Esophagus | ESCC | 1.47e-06 | 4.02e-01 | 0.1124 |
| Page: 1 2 3 4 5 |
| Tissue | Expression Dynamics | Abbreviation |
| Esophagus | 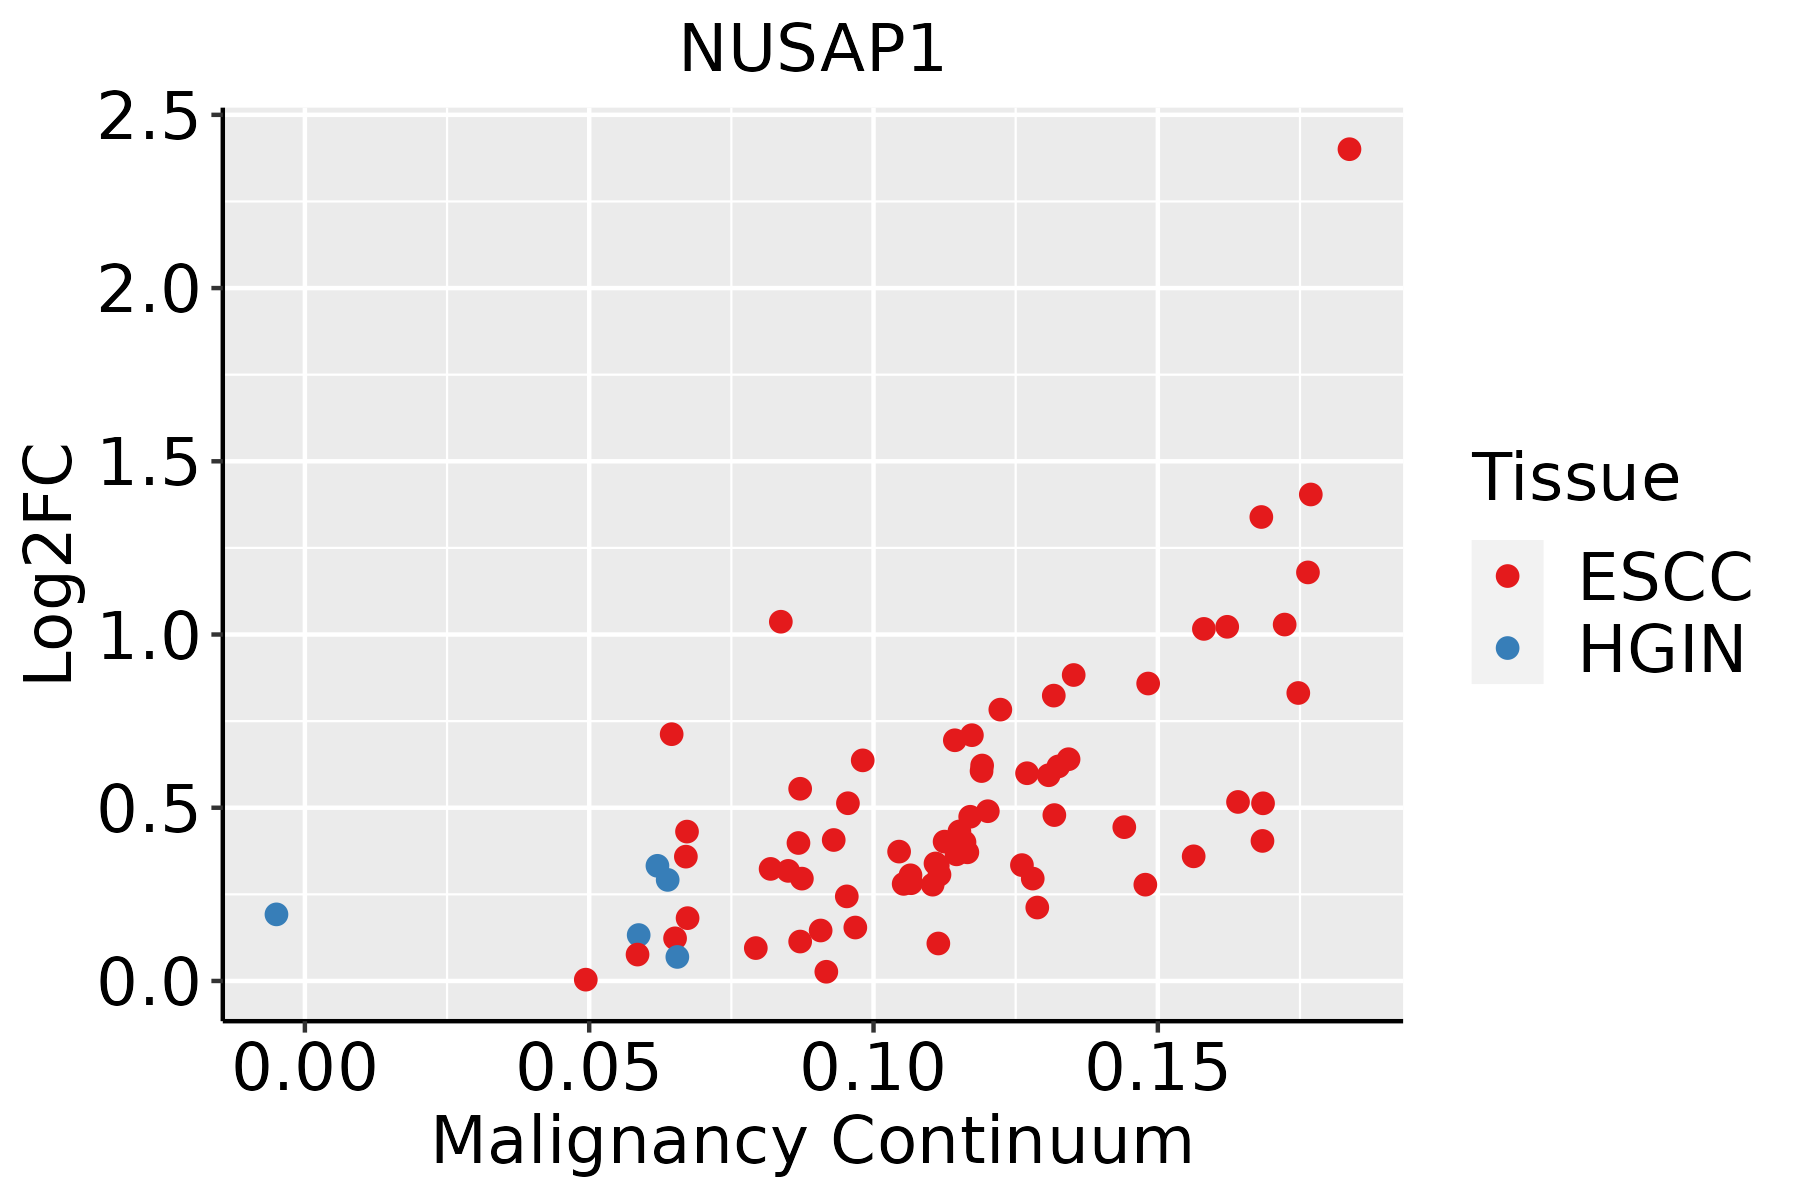 | ESCC: Esophageal squamous cell carcinoma |
| HGIN: High-grade intraepithelial neoplasias | ||
| LGIN: Low-grade intraepithelial neoplasias | ||
| Liver | 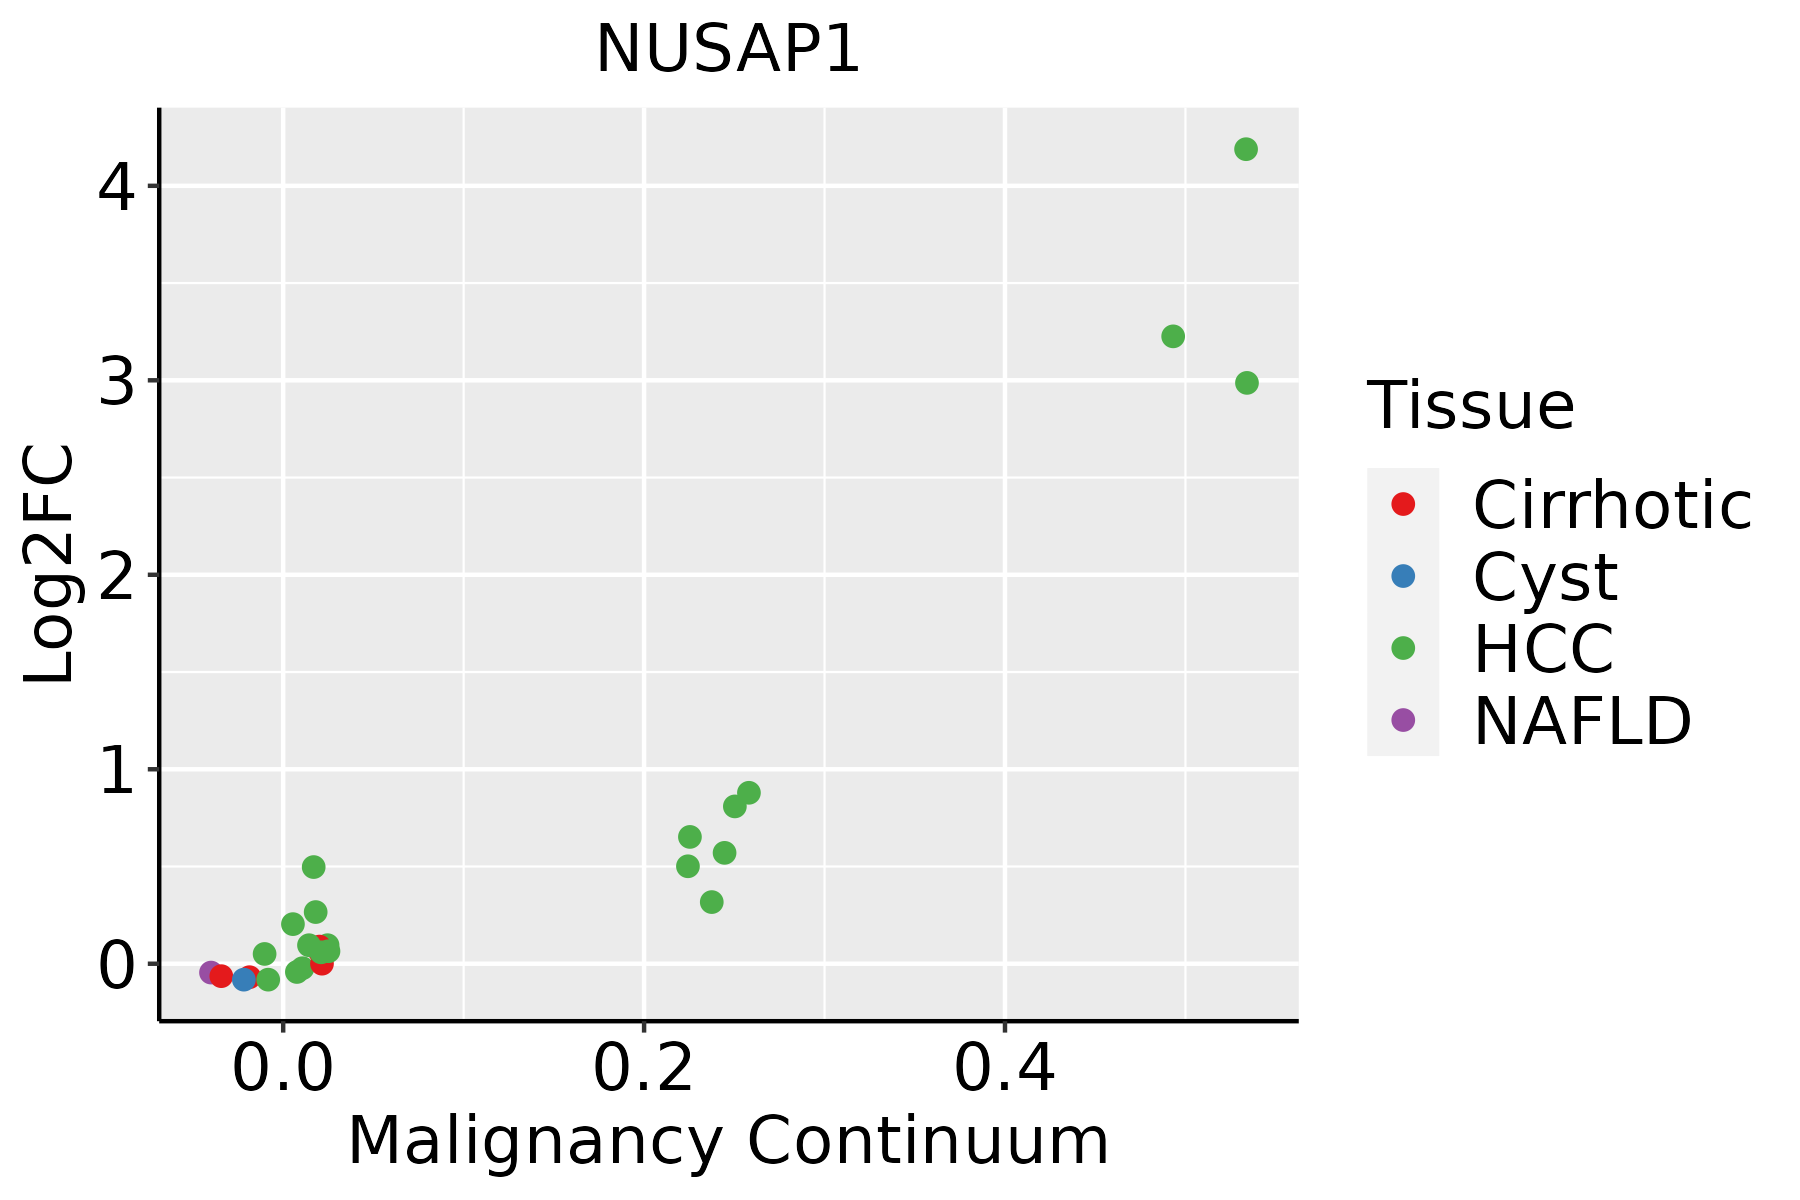 | HCC: Hepatocellular carcinoma |
| NAFLD: Non-alcoholic fatty liver disease | ||
| Oral Cavity | 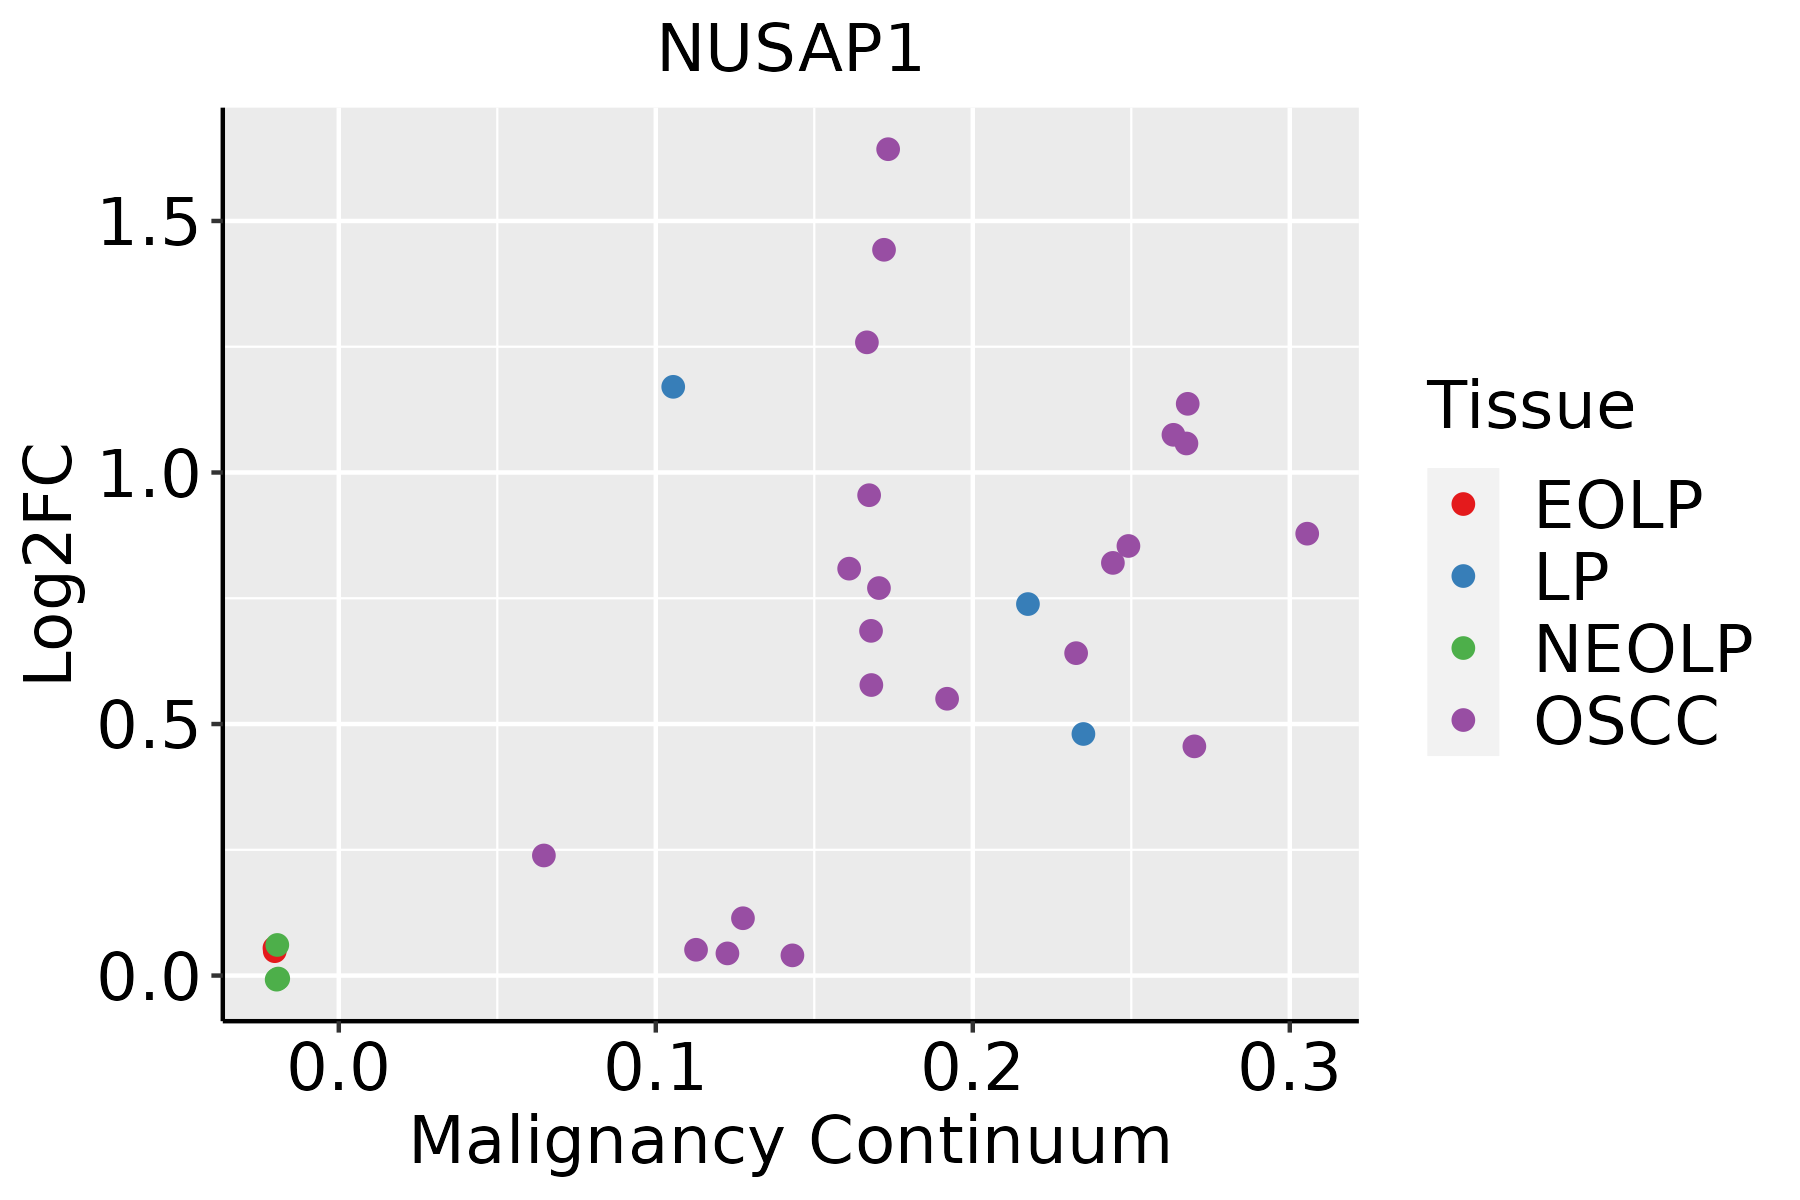 | EOLP: Erosive Oral lichen planus |
| LP: leukoplakia | ||
| NEOLP: Non-erosive oral lichen planus | ||
| OSCC: Oral squamous cell carcinoma | ||
| Skin | 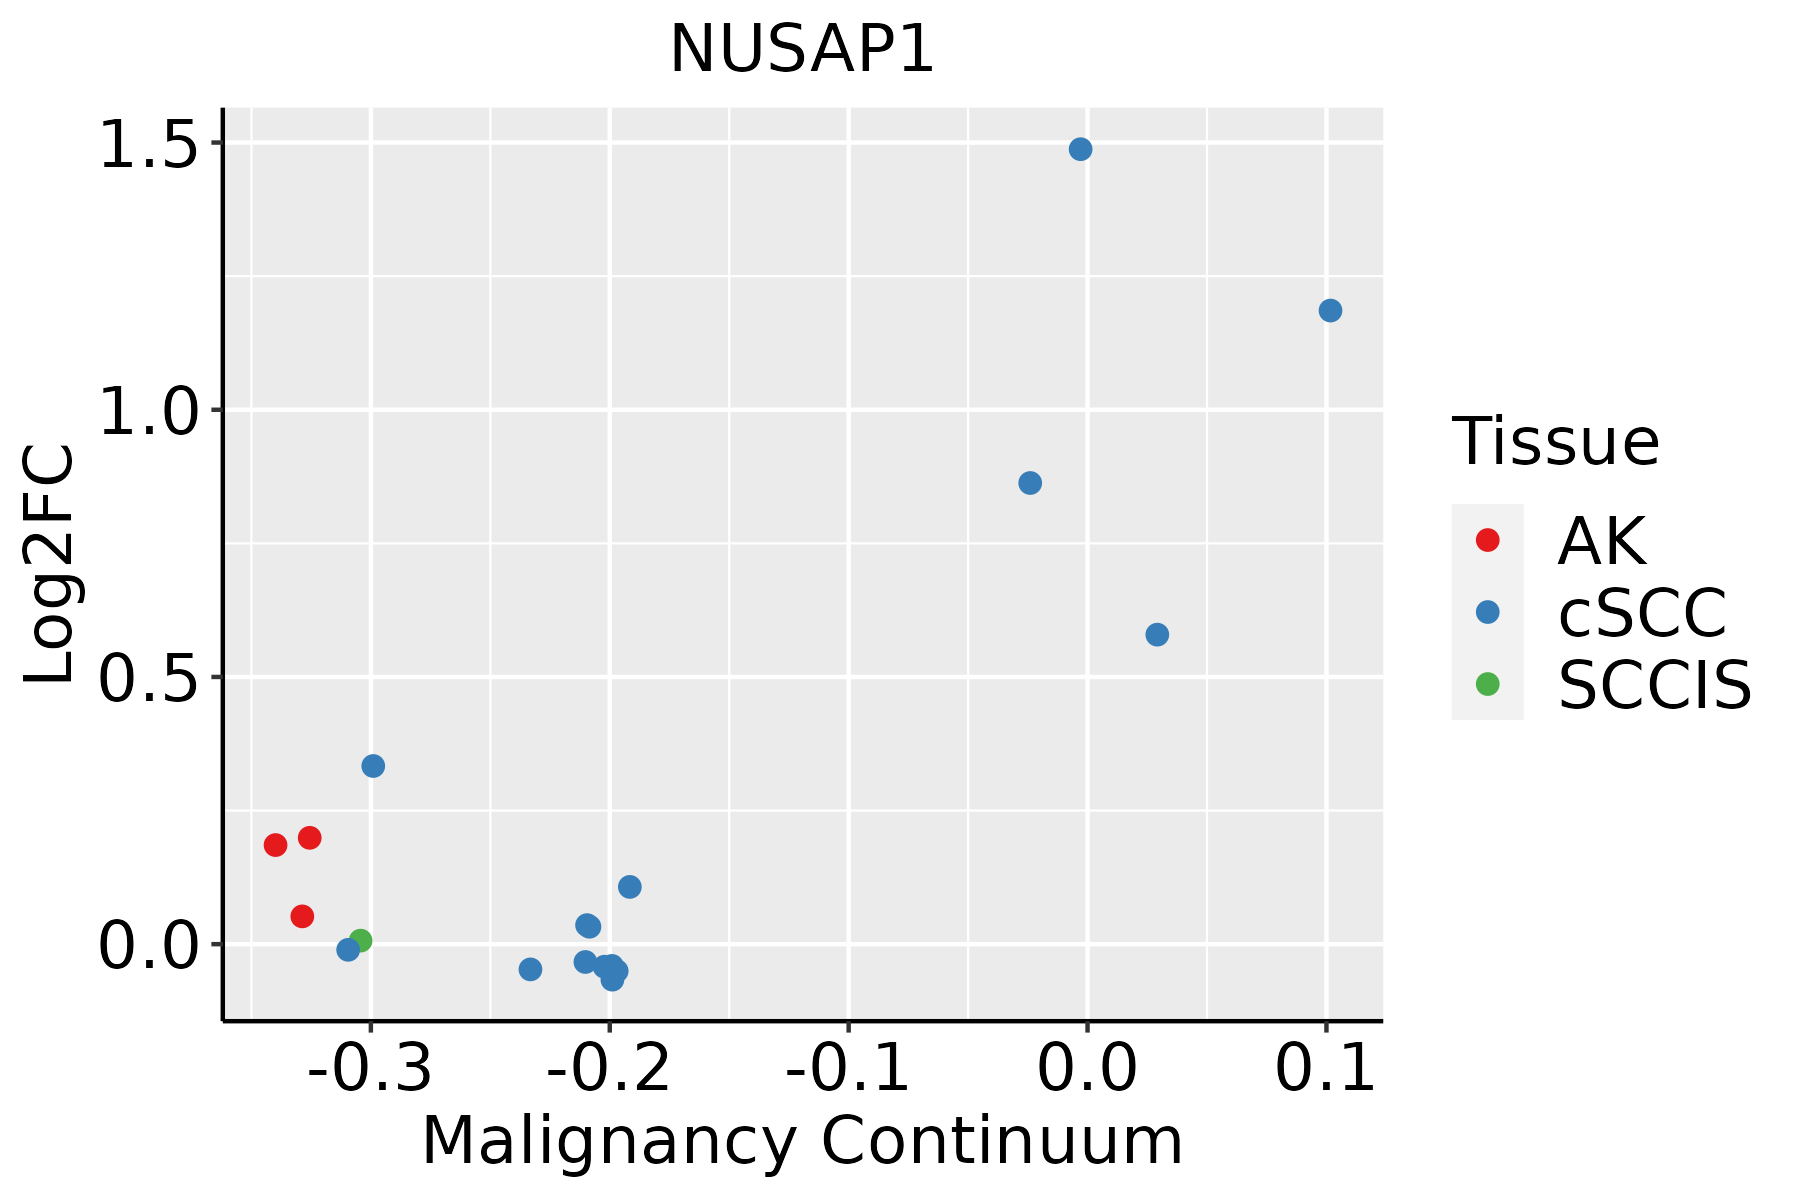 | AK: Actinic keratosis |
| cSCC: Cutaneous squamous cell carcinoma | ||
| SCCIS:squamous cell carcinoma in situ | ||
| Thyroid | 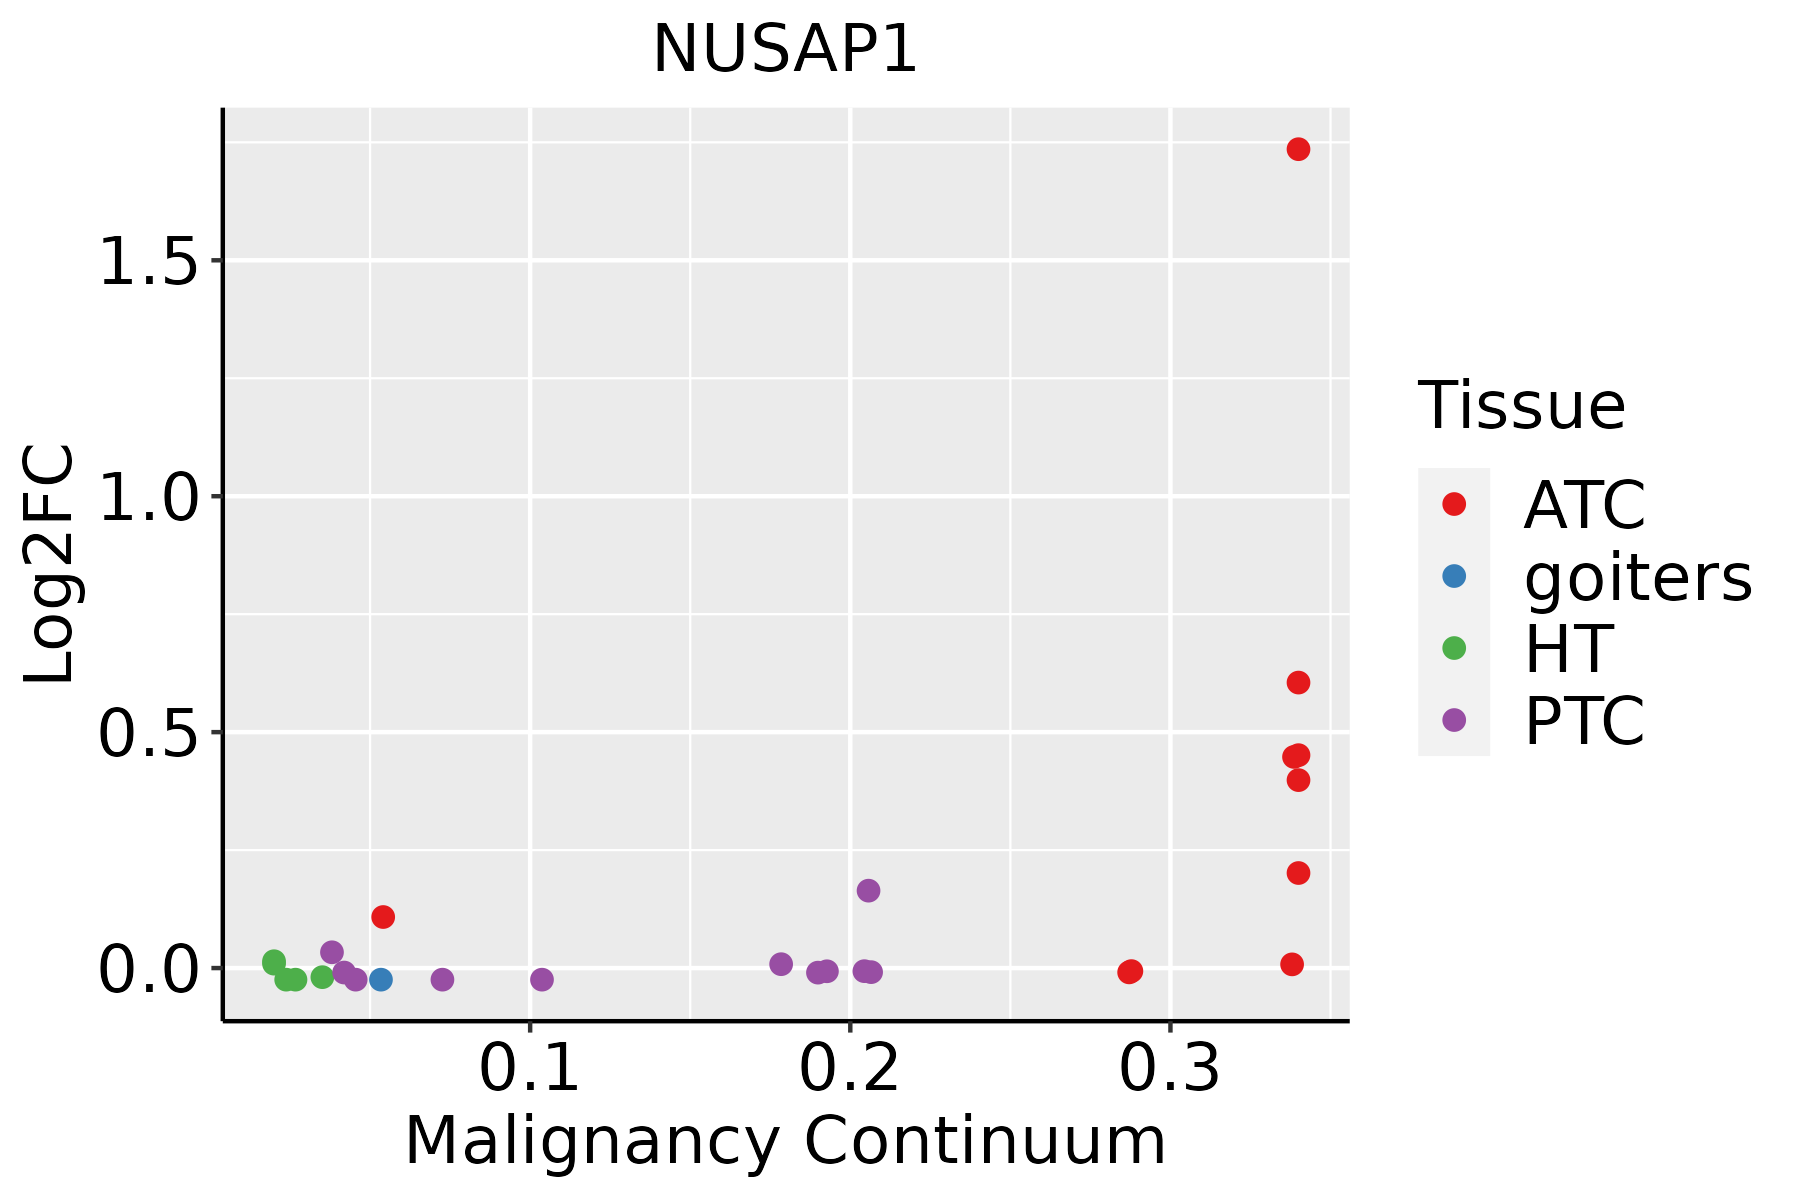 | ATC: Anaplastic thyroid cancer |
| HT: Hashimoto's thyroiditis | ||
| PTC: Papillary thyroid cancer |
| ∗log2FC in expression of this searched gene in stem-like cells from each diseased tissue sample relative to stem-like cells in normal samples in each tissue plotted against the malignancy continuum. Samples are colored based on if they are from different disease stage. |
Top |
Malignant transformation related pathway analysis |
| Find out the enriched GO biological processes and KEGG pathways involved in transition from healthy to precancer to cancer |
| Tissue | Disease Stage | Enriched GO biological Processes |
| Colorectum | AD |  |
| Colorectum | SER |  |
| Colorectum | MSS |  |
| Colorectum | MSI-H |  |
| Colorectum | FAP |  |
| ∗Top 15 enriched GO BP terms are showed in the bar plot of each disease state in each tissue. Each row represents a significant GO biological process which is colored according to the -log10(p.adjust). |
| Page: 1 2 3 4 5 6 7 8 9 |
| GO ID | Tissue | Disease Stage | Description | Gene Ratio | Bg Ratio | pvalue | p.adjust | Count |
| GO:014001414 | Esophagus | ESCC | mitotic nuclear division | 218/8552 | 287/18723 | 6.17e-26 | 1.78e-23 | 218 |
| GO:005165617 | Esophagus | ESCC | establishment of organelle localization | 273/8552 | 390/18723 | 9.13e-23 | 1.81e-20 | 273 |
| GO:000007011 | Esophagus | ESCC | mitotic sister chromatid segregation | 138/8552 | 168/18723 | 1.37e-22 | 2.63e-20 | 138 |
| GO:00008194 | Esophagus | ESCC | sister chromatid segregation | 157/8552 | 202/18723 | 8.41e-21 | 1.33e-18 | 157 |
| GO:000705911 | Esophagus | ESCC | chromosome segregation | 238/8552 | 346/18723 | 1.72e-18 | 1.82e-16 | 238 |
| GO:190285015 | Esophagus | ESCC | microtubule cytoskeleton organization involved in mitosis | 116/8552 | 147/18723 | 1.25e-16 | 9.91e-15 | 116 |
| GO:000734615 | Esophagus | ESCC | regulation of mitotic cell cycle | 293/8552 | 457/18723 | 8.00e-16 | 5.64e-14 | 293 |
| GO:00482853 | Esophagus | ESCC | organelle fission | 301/8552 | 488/18723 | 4.64e-13 | 2.12e-11 | 301 |
| GO:00988133 | Esophagus | ESCC | nuclear chromosome segregation | 187/8552 | 281/18723 | 1.00e-12 | 4.36e-11 | 187 |
| GO:00002802 | Esophagus | ESCC | nuclear division | 270/8552 | 439/18723 | 1.17e-11 | 4.24e-10 | 270 |
| GO:000028115 | Esophagus | ESCC | mitotic cytokinesis | 58/8552 | 71/18723 | 4.34e-10 | 1.15e-08 | 58 |
| GO:004578710 | Esophagus | ESCC | positive regulation of cell cycle | 196/8552 | 313/18723 | 9.27e-10 | 2.24e-08 | 196 |
| GO:000091016 | Esophagus | ESCC | cytokinesis | 115/8552 | 173/18723 | 2.48e-08 | 4.68e-07 | 115 |
| GO:00070883 | Esophagus | ESCC | regulation of mitotic nuclear division | 78/8552 | 110/18723 | 6.96e-08 | 1.21e-06 | 78 |
| GO:006164015 | Esophagus | ESCC | cytoskeleton-dependent cytokinesis | 72/8552 | 100/18723 | 8.10e-08 | 1.39e-06 | 72 |
| GO:00517831 | Esophagus | ESCC | regulation of nuclear division | 90/8552 | 139/18723 | 4.30e-06 | 4.60e-05 | 90 |
| GO:00900689 | Esophagus | ESCC | positive regulation of cell cycle process | 142/8552 | 236/18723 | 4.79e-06 | 5.08e-05 | 142 |
| GO:00070761 | Esophagus | ESCC | mitotic chromosome condensation | 15/8552 | 17/18723 | 3.48e-04 | 2.03e-03 | 15 |
| GO:00400011 | Esophagus | ESCC | establishment of mitotic spindle localization | 26/8552 | 35/18723 | 5.57e-04 | 3.04e-03 | 26 |
| GO:00516533 | Esophagus | ESCC | spindle localization | 37/8552 | 56/18723 | 1.65e-03 | 7.65e-03 | 37 |
| Page: 1 2 3 4 5 6 |
| Pathway ID | Tissue | Disease Stage | Description | Gene Ratio | Bg Ratio | pvalue | p.adjust | qvalue | Count |
| Page: 1 |
Top |
Cell-cell communication analysis |
| Identification of potential cell-cell interactions between two cell types and their ligand-receptor pairs for different disease states |
| Ligand | Receptor | LRpair | Pathway | Tissue | Disease Stage |
| Page: 1 |
Top |
Single-cell gene regulatory network inference analysis |
| Find out the significant the regulons (TFs) and the target genes of each regulon across cell types for different disease states |
| TF | Cell Type | Tissue | Disease Stage | Target Gene | RSS | Regulon Activity |
| ∗The dot plots of a searched regulon are shown for all cell subpopulations in each disease state of each tissue based on the regulon specific score inferred using pySCENIC and by calculating the average expression. |
| Page: 1 |
Top |
Somatic mutation of malignant transformation related genes |
| Annotation of somatic variants for genes involved in malignant transformation |
| Hugo Symbol | Variant Class | Variant Classification | dbSNP RS | HGVSc | HGVSp | HGVSp Short | SWISSPROT | BIOTYPE | SIFT | PolyPhen | Tumor Sample Barcode | Tissue | Histology | Sex | Age | Stage | Therapy Types | Drugs | Outcome |
| NUSAP1 | SNV | Missense_Mutation | c.32C>G | p.Ser11Cys | p.S11C | Q9BXS6 | protein_coding | deleterious(0) | probably_damaging(1) | TCGA-C8-A26Y-01 | Breast | breast invasive carcinoma | Female | >=65 | I/II | Unknown | Unknown | SD | |
| NUSAP1 | SNV | Missense_Mutation | rs748216021 | c.883N>T | p.Arg295Cys | p.R295C | Q9BXS6 | protein_coding | deleterious(0.05) | benign(0.024) | TCGA-2W-A8YY-01 | Cervix | cervical & endocervical cancer | Female | <65 | I/II | Chemotherapy | cisplatin | CR |
| NUSAP1 | SNV | Missense_Mutation | novel | c.1026N>C | p.Leu342Phe | p.L342F | Q9BXS6 | protein_coding | tolerated(1) | benign(0.015) | TCGA-EA-A97N-01 | Cervix | cervical & endocervical cancer | Female | <65 | I/II | Unknown | Unknown | SD |
| NUSAP1 | SNV | Missense_Mutation | rs745709236 | c.19N>A | p.Glu7Lys | p.E7K | Q9BXS6 | protein_coding | deleterious(0.01) | probably_damaging(0.962) | TCGA-VS-AA62-01 | Cervix | cervical & endocervical cancer | Female | <65 | I/II | Chemotherapy | cisplatin | PD |
| NUSAP1 | SNV | Missense_Mutation | c.779N>C | p.Ser260Thr | p.S260T | Q9BXS6 | protein_coding | tolerated(0.19) | benign(0.044) | TCGA-A6-5657-01 | Colorectum | colon adenocarcinoma | Male | >=65 | III/IV | Ancillary | leucovorin | SD | |
| NUSAP1 | SNV | Missense_Mutation | c.814N>T | p.Arg272Cys | p.R272C | Q9BXS6 | protein_coding | tolerated(0.07) | possibly_damaging(0.791) | TCGA-WS-AB45-01 | Colorectum | colon adenocarcinoma | Female | <65 | I/II | Unknown | Unknown | SD | |
| NUSAP1 | SNV | Missense_Mutation | novel | c.348N>A | p.Phe116Leu | p.F116L | Q9BXS6 | protein_coding | tolerated(0.7) | benign(0.006) | TCGA-F5-6814-01 | Colorectum | rectum adenocarcinoma | Male | <65 | I/II | Unknown | Unknown | SD |
| NUSAP1 | SNV | Missense_Mutation | novel | c.490C>A | p.Leu164Ile | p.L164I | Q9BXS6 | protein_coding | tolerated(0.1) | benign(0.153) | TCGA-AJ-A5DW-01 | Endometrium | uterine corpus endometrioid carcinoma | Female | <65 | I/II | Unknown | Unknown | SD |
| NUSAP1 | SNV | Missense_Mutation | c.817N>A | p.Ser273Thr | p.S273T | Q9BXS6 | protein_coding | deleterious(0.02) | possibly_damaging(0.755) | TCGA-AP-A059-01 | Endometrium | uterine corpus endometrioid carcinoma | Female | >=65 | I/II | Unknown | Unknown | SD | |
| NUSAP1 | SNV | Missense_Mutation | rs775051382 | c.286C>T | p.Arg96Cys | p.R96C | Q9BXS6 | protein_coding | tolerated(0.07) | benign(0.417) | TCGA-AP-A05O-01 | Endometrium | uterine corpus endometrioid carcinoma | Female | >=65 | I/II | Chemotherapy | carboplatin | PD |
| Page: 1 2 3 |
Top |
Related drugs of malignant transformation related genes |
| Identification of chemicals and drugs interact with genes involved in malignant transfromation |
| (DGIdb 4.0) |
| Entrez ID | Symbol | Category | Interaction Types | Drug Claim Name | Drug Name | PMIDs |
| Page: 1 |

Copyright 2023-Present -The University of Texas Health Science Center at Houston |