
|
|||||
|
 | |
| |
| |
| |
| |
| |
|
Gene: NUPR2 |
Gene summary for NUPR2 |
| Gene information | Species | Human | Gene symbol | NUPR2 | Gene ID | 389493 |
| Gene name | nuclear protein 2, transcriptional regulator | |
| Gene Alias | NUPR1L | |
| Cytomap | 7p11.2 | |
| Gene Type | protein-coding | GO ID | GO:0000122 | UniProtAcc | A6NF83 |
Top |
Malignant transformation analysis |
| Identification of the aberrant gene expression in precancerous and cancerous lesions by comparing the gene expression of stem-like cells in diseased tissues with normal stem cells |
| Entrez ID | Symbol | Replicates | Species | Organ | Tissue | Adj P-value | Log2FC | Malignancy |
| 389493 | NUPR2 | P4T-E | Human | Esophagus | ESCC | 4.80e-04 | 8.54e-02 | 0.1323 |
| 389493 | NUPR2 | P10T-E | Human | Esophagus | ESCC | 8.84e-04 | 3.95e-02 | 0.116 |
| 389493 | NUPR2 | P16T-E | Human | Esophagus | ESCC | 1.84e-38 | 7.97e-01 | 0.1153 |
| 389493 | NUPR2 | P27T-E | Human | Esophagus | ESCC | 7.75e-10 | 1.03e-01 | 0.1055 |
| 389493 | NUPR2 | P44T-E | Human | Esophagus | ESCC | 1.66e-02 | 1.05e-01 | 0.1096 |
| 389493 | NUPR2 | P56T-E | Human | Esophagus | ESCC | 2.46e-13 | 1.10e+00 | 0.1613 |
| 389493 | NUPR2 | P57T-E | Human | Esophagus | ESCC | 2.09e-06 | 2.60e-01 | 0.0926 |
| 389493 | NUPR2 | P61T-E | Human | Esophagus | ESCC | 1.22e-06 | 2.51e-01 | 0.099 |
| 389493 | NUPR2 | P65T-E | Human | Esophagus | ESCC | 8.77e-09 | 1.24e-01 | 0.0978 |
| 389493 | NUPR2 | P74T-E | Human | Esophagus | ESCC | 2.60e-11 | 2.80e-01 | 0.1479 |
| 389493 | NUPR2 | P76T-E | Human | Esophagus | ESCC | 3.41e-18 | 4.32e-01 | 0.1207 |
| 389493 | NUPR2 | P79T-E | Human | Esophagus | ESCC | 1.03e-42 | 9.33e-01 | 0.1154 |
| 389493 | NUPR2 | P83T-E | Human | Esophagus | ESCC | 9.14e-09 | 2.73e-01 | 0.1738 |
| 389493 | NUPR2 | P130T-E | Human | Esophagus | ESCC | 2.51e-22 | 5.57e-01 | 0.1676 |
| 389493 | NUPR2 | male-WTA | Human | Thyroid | PTC | 1.22e-08 | -5.59e-02 | 0.1037 |
| 389493 | NUPR2 | PTC01 | Human | Thyroid | PTC | 9.51e-03 | -1.29e-01 | 0.1899 |
| 389493 | NUPR2 | PTC05 | Human | Thyroid | PTC | 1.46e-03 | 3.28e-01 | 0.2065 |
| 389493 | NUPR2 | PTC06 | Human | Thyroid | PTC | 5.13e-07 | 1.00e-01 | 0.2057 |
| 389493 | NUPR2 | PTC07 | Human | Thyroid | PTC | 4.27e-15 | 2.90e-01 | 0.2044 |
| 389493 | NUPR2 | ATC12 | Human | Thyroid | ATC | 4.82e-02 | -1.57e-01 | 0.34 |
| Page: 1 2 |
| Tissue | Expression Dynamics | Abbreviation |
| Esophagus |  | ESCC: Esophageal squamous cell carcinoma |
| HGIN: High-grade intraepithelial neoplasias | ||
| LGIN: Low-grade intraepithelial neoplasias | ||
| Thyroid | 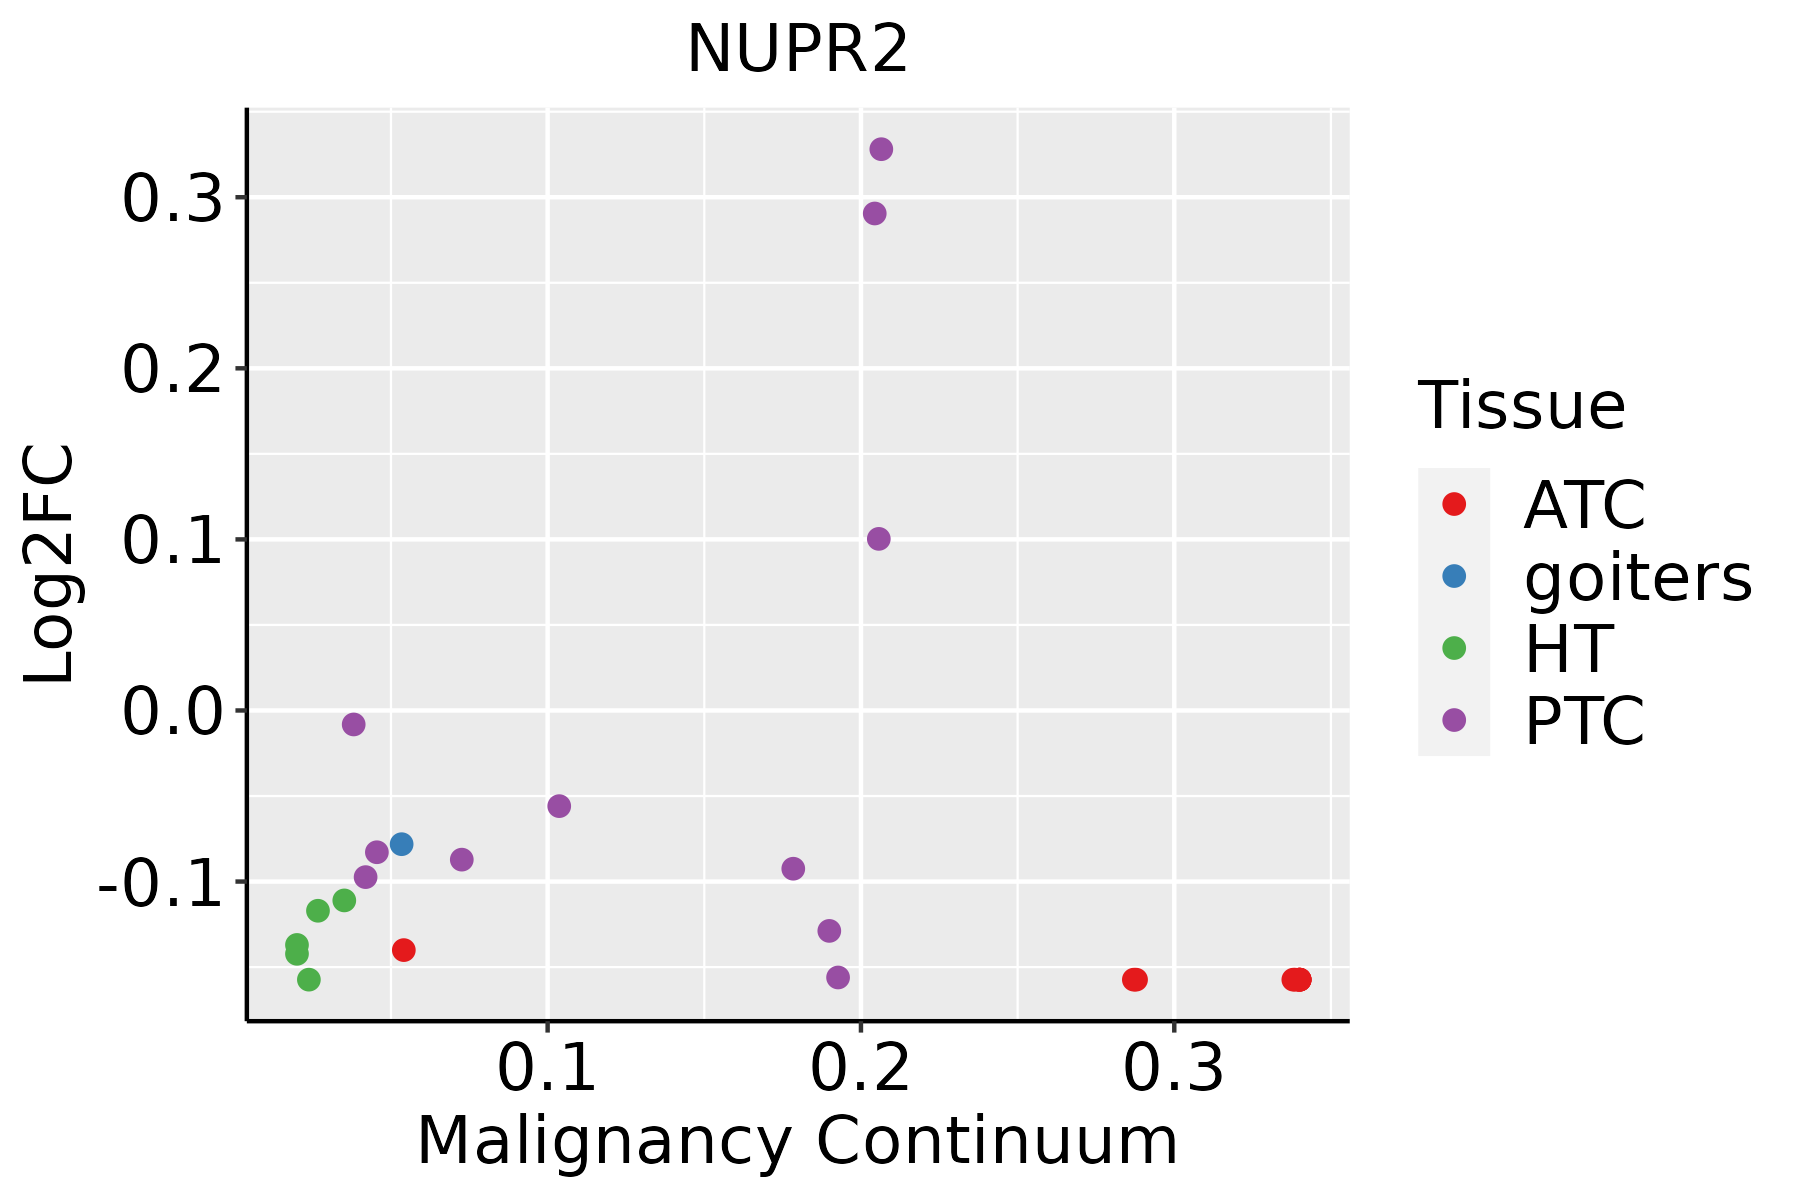 | ATC: Anaplastic thyroid cancer |
| HT: Hashimoto's thyroiditis | ||
| PTC: Papillary thyroid cancer |
| ∗log2FC in expression of this searched gene in stem-like cells from each diseased tissue sample relative to stem-like cells in normal samples in each tissue plotted against the malignancy continuum. Samples are colored based on if they are from different disease stage. |
Top |
Malignant transformation related pathway analysis |
| Find out the enriched GO biological processes and KEGG pathways involved in transition from healthy to precancer to cancer |
| Tissue | Disease Stage | Enriched GO biological Processes |
| Colorectum | AD |  |
| Colorectum | SER |  |
| Colorectum | MSS |  |
| Colorectum | MSI-H |  |
| Colorectum | FAP |  |
| ∗Top 15 enriched GO BP terms are showed in the bar plot of each disease state in each tissue. Each row represents a significant GO biological process which is colored according to the -log10(p.adjust). |
| Page: 1 2 3 4 5 6 7 8 9 |
| GO ID | Tissue | Disease Stage | Description | Gene Ratio | Bg Ratio | pvalue | p.adjust | Count |
| GO:0071496111 | Esophagus | ESCC | cellular response to external stimulus | 215/8552 | 320/18723 | 4.29e-15 | 2.43e-13 | 215 |
| GO:0031668111 | Esophagus | ESCC | cellular response to extracellular stimulus | 168/8552 | 246/18723 | 4.93e-13 | 2.23e-11 | 168 |
| GO:0031669110 | Esophagus | ESCC | cellular response to nutrient levels | 148/8552 | 215/18723 | 4.58e-12 | 1.76e-10 | 148 |
| GO:0031667111 | Esophagus | ESCC | response to nutrient levels | 289/8552 | 474/18723 | 9.25e-12 | 3.47e-10 | 289 |
| GO:0009267110 | Esophagus | ESCC | cellular response to starvation | 110/8552 | 156/18723 | 2.63e-10 | 7.37e-09 | 110 |
| GO:00457865 | Esophagus | ESCC | negative regulation of cell cycle | 236/8552 | 385/18723 | 3.62e-10 | 9.93e-09 | 236 |
| GO:004259419 | Esophagus | ESCC | response to starvation | 133/8552 | 197/18723 | 4.31e-10 | 1.14e-08 | 133 |
| GO:0071496113 | Thyroid | PTC | cellular response to external stimulus | 158/5968 | 320/18723 | 4.12e-11 | 1.47e-09 | 158 |
| GO:0031668113 | Thyroid | PTC | cellular response to extracellular stimulus | 120/5968 | 246/18723 | 2.13e-08 | 4.91e-07 | 120 |
| GO:0031669112 | Thyroid | PTC | cellular response to nutrient levels | 106/5968 | 215/18723 | 6.96e-08 | 1.44e-06 | 106 |
| GO:0042594111 | Thyroid | PTC | response to starvation | 98/5968 | 197/18723 | 1.24e-07 | 2.41e-06 | 98 |
| GO:0009267112 | Thyroid | PTC | cellular response to starvation | 80/5968 | 156/18723 | 3.52e-07 | 5.90e-06 | 80 |
| GO:0031667113 | Thyroid | PTC | response to nutrient levels | 201/5968 | 474/18723 | 7.00e-07 | 1.10e-05 | 201 |
| GO:00457867 | Thyroid | PTC | negative regulation of cell cycle | 166/5968 | 385/18723 | 1.93e-06 | 2.64e-05 | 166 |
| GO:0071496210 | Thyroid | ATC | cellular response to external stimulus | 165/6293 | 320/18723 | 2.01e-11 | 7.23e-10 | 165 |
| GO:003166927 | Thyroid | ATC | cellular response to nutrient levels | 112/6293 | 215/18723 | 1.57e-08 | 3.20e-07 | 112 |
| GO:003166827 | Thyroid | ATC | cellular response to extracellular stimulus | 125/6293 | 246/18723 | 1.65e-08 | 3.31e-07 | 125 |
| GO:004578614 | Thyroid | ATC | negative regulation of cell cycle | 181/6293 | 385/18723 | 2.64e-08 | 5.07e-07 | 181 |
| GO:004259424 | Thyroid | ATC | response to starvation | 103/6293 | 197/18723 | 4.59e-08 | 8.31e-07 | 103 |
| GO:000926724 | Thyroid | ATC | cellular response to starvation | 85/6293 | 156/18723 | 6.14e-08 | 1.09e-06 | 85 |
| Page: 1 2 |
| Pathway ID | Tissue | Disease Stage | Description | Gene Ratio | Bg Ratio | pvalue | p.adjust | qvalue | Count |
| Page: 1 |
Top |
Cell-cell communication analysis |
| Identification of potential cell-cell interactions between two cell types and their ligand-receptor pairs for different disease states |
| Ligand | Receptor | LRpair | Pathway | Tissue | Disease Stage |
| Page: 1 |
Top |
Single-cell gene regulatory network inference analysis |
| Find out the significant the regulons (TFs) and the target genes of each regulon across cell types for different disease states |
| TF | Cell Type | Tissue | Disease Stage | Target Gene | RSS | Regulon Activity |
| ∗The dot plots of a searched regulon are shown for all cell subpopulations in each disease state of each tissue based on the regulon specific score inferred using pySCENIC and by calculating the average expression. |
| Page: 1 |
Top |
Somatic mutation of malignant transformation related genes |
| Annotation of somatic variants for genes involved in malignant transformation |
| Hugo Symbol | Variant Class | Variant Classification | dbSNP RS | HGVSc | HGVSp | HGVSp Short | SWISSPROT | BIOTYPE | SIFT | PolyPhen | Tumor Sample Barcode | Tissue | Histology | Sex | Age | Stage | Therapy Types | Drugs | Outcome |
| NUPR2 | SNV | Missense_Mutation | novel | c.217G>A | p.Ala73Thr | p.A73T | A6NF83 | protein_coding | tolerated(0.16) | benign(0.007) | TCGA-A5-AB3J-01 | Endometrium | uterine corpus endometrioid carcinoma | Female | <65 | I/II | Chemotherapy | carboplatin | CR |
| NUPR2 | SNV | Missense_Mutation | rs190448728 | c.113G>T | p.Arg38Leu | p.R38L | A6NF83 | protein_coding | tolerated(0.26) | probably_damaging(0.96) | TCGA-AP-A05O-01 | Endometrium | uterine corpus endometrioid carcinoma | Female | >=65 | I/II | Chemotherapy | carboplatin | PD |
| Page: 1 |
Top |
Related drugs of malignant transformation related genes |
| Identification of chemicals and drugs interact with genes involved in malignant transfromation |
| (DGIdb 4.0) |
| Entrez ID | Symbol | Category | Interaction Types | Drug Claim Name | Drug Name | PMIDs |
| Page: 1 |

Copyright 2023-Present -The University of Texas Health Science Center at Houston |