
|
|||||
|
 | |
| |
| |
| |
| |
| |
|
Gene: NUPL2 |
Gene summary for NUPL2 |
| Gene information | Species | Human | Gene symbol | NUPL2 | Gene ID | 11097 |
| Gene name | nucleoporin 42 | |
| Gene Alias | CG1 | |
| Cytomap | 7p15.3 | |
| Gene Type | protein-coding | GO ID | GO:0006403 | UniProtAcc | O15504 |
Top |
Malignant transformation analysis |
| Identification of the aberrant gene expression in precancerous and cancerous lesions by comparing the gene expression of stem-like cells in diseased tissues with normal stem cells |
| Entrez ID | Symbol | Replicates | Species | Organ | Tissue | Adj P-value | Log2FC | Malignancy |
| 11097 | NUPL2 | P1T-E | Human | Esophagus | ESCC | 2.10e-09 | 5.09e-01 | 0.0875 |
| 11097 | NUPL2 | P2T-E | Human | Esophagus | ESCC | 1.87e-30 | 5.65e-01 | 0.1177 |
| 11097 | NUPL2 | P4T-E | Human | Esophagus | ESCC | 7.33e-33 | 6.85e-01 | 0.1323 |
| 11097 | NUPL2 | P5T-E | Human | Esophagus | ESCC | 2.03e-24 | 5.37e-01 | 0.1327 |
| 11097 | NUPL2 | P8T-E | Human | Esophagus | ESCC | 4.29e-21 | 3.52e-01 | 0.0889 |
| 11097 | NUPL2 | P9T-E | Human | Esophagus | ESCC | 2.52e-29 | 5.65e-01 | 0.1131 |
| 11097 | NUPL2 | P10T-E | Human | Esophagus | ESCC | 3.72e-31 | 5.45e-01 | 0.116 |
| 11097 | NUPL2 | P11T-E | Human | Esophagus | ESCC | 8.73e-25 | 8.41e-01 | 0.1426 |
| 11097 | NUPL2 | P12T-E | Human | Esophagus | ESCC | 1.81e-30 | 5.11e-01 | 0.1122 |
| 11097 | NUPL2 | P15T-E | Human | Esophagus | ESCC | 5.44e-27 | 4.51e-01 | 0.1149 |
| 11097 | NUPL2 | P16T-E | Human | Esophagus | ESCC | 2.49e-24 | 4.92e-01 | 0.1153 |
| 11097 | NUPL2 | P17T-E | Human | Esophagus | ESCC | 3.37e-14 | 4.86e-01 | 0.1278 |
| 11097 | NUPL2 | P19T-E | Human | Esophagus | ESCC | 4.26e-05 | 6.12e-01 | 0.1662 |
| 11097 | NUPL2 | P20T-E | Human | Esophagus | ESCC | 7.07e-27 | 4.86e-01 | 0.1124 |
| 11097 | NUPL2 | P21T-E | Human | Esophagus | ESCC | 2.56e-28 | 5.08e-01 | 0.1617 |
| 11097 | NUPL2 | P22T-E | Human | Esophagus | ESCC | 2.08e-30 | 5.59e-01 | 0.1236 |
| 11097 | NUPL2 | P23T-E | Human | Esophagus | ESCC | 4.56e-22 | 4.93e-01 | 0.108 |
| 11097 | NUPL2 | P24T-E | Human | Esophagus | ESCC | 3.30e-16 | 3.28e-01 | 0.1287 |
| 11097 | NUPL2 | P26T-E | Human | Esophagus | ESCC | 3.24e-34 | 5.98e-01 | 0.1276 |
| 11097 | NUPL2 | P27T-E | Human | Esophagus | ESCC | 6.55e-32 | 6.32e-01 | 0.1055 |
| Page: 1 2 3 4 5 |
| Tissue | Expression Dynamics | Abbreviation |
| Esophagus | 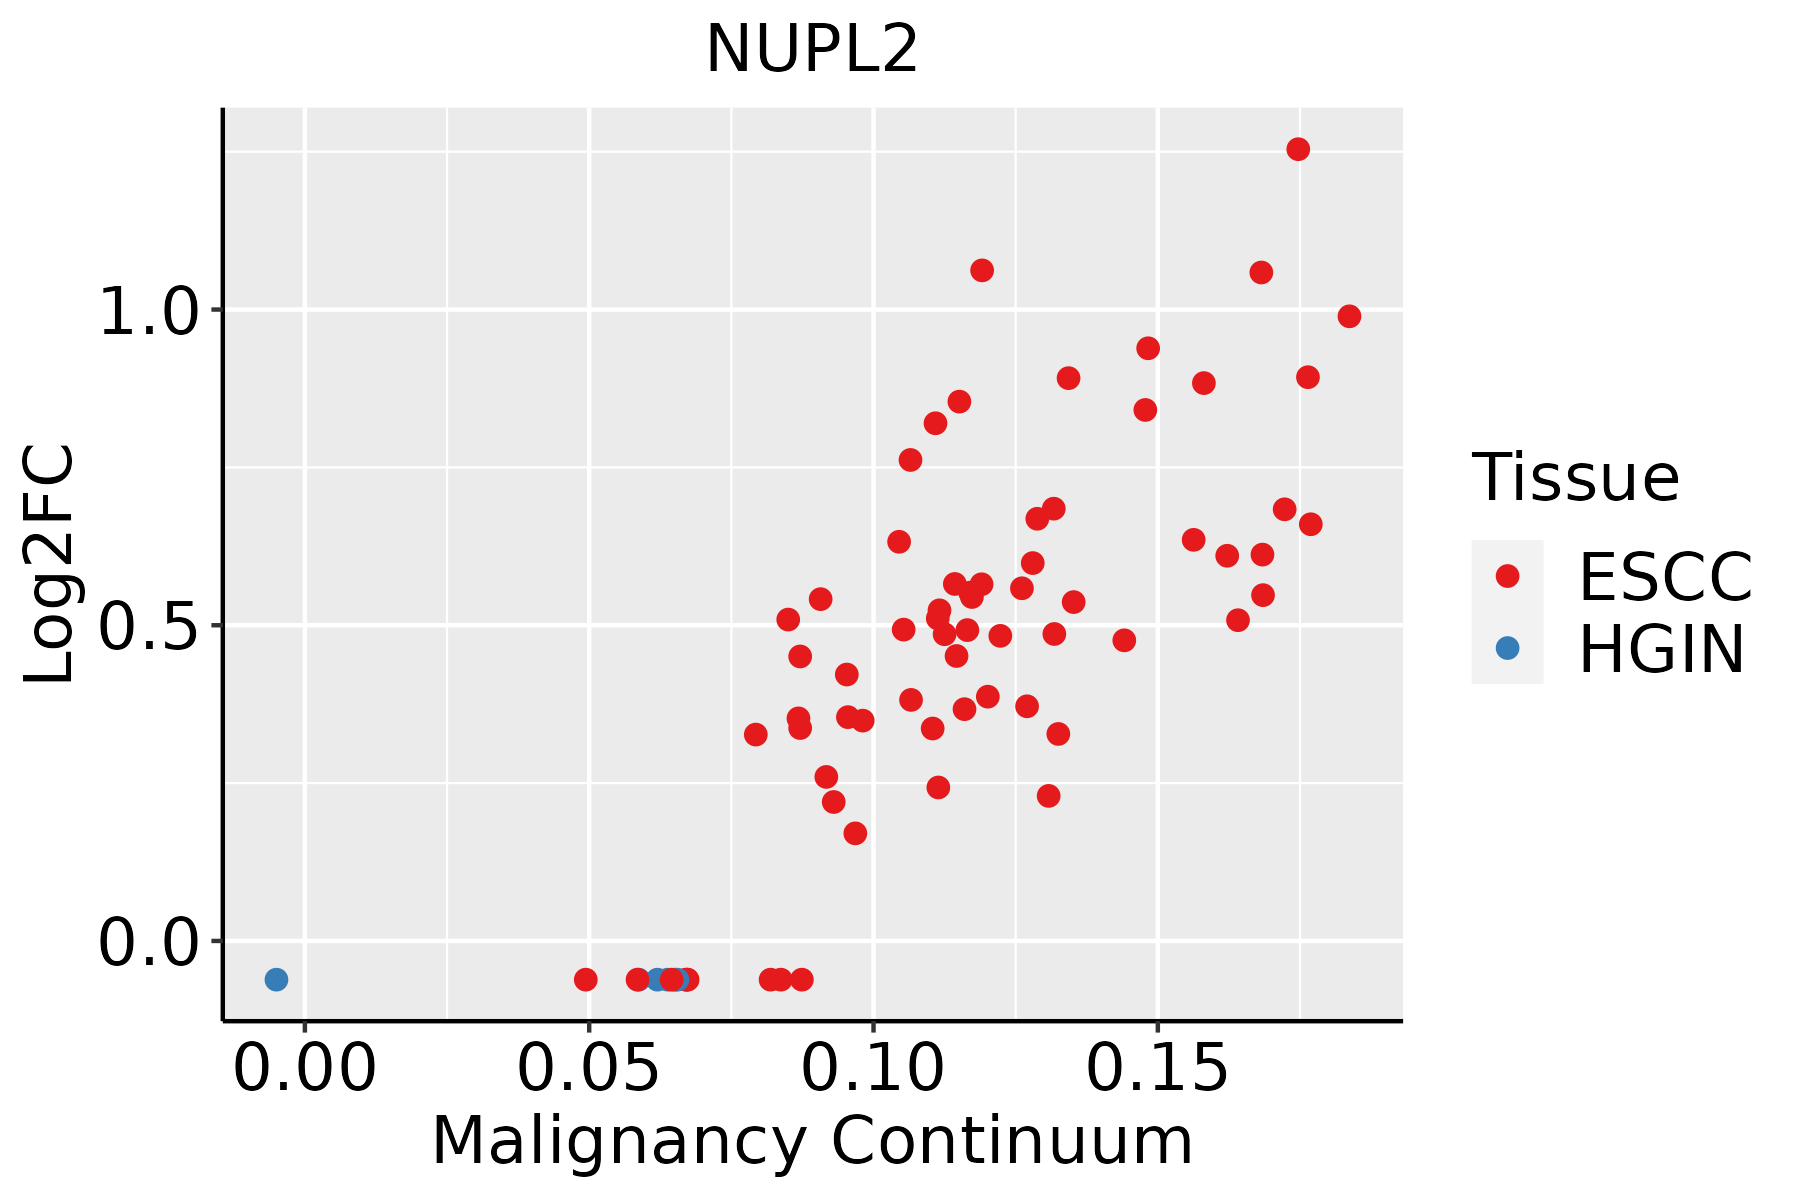 | ESCC: Esophageal squamous cell carcinoma |
| HGIN: High-grade intraepithelial neoplasias | ||
| LGIN: Low-grade intraepithelial neoplasias | ||
| Liver | 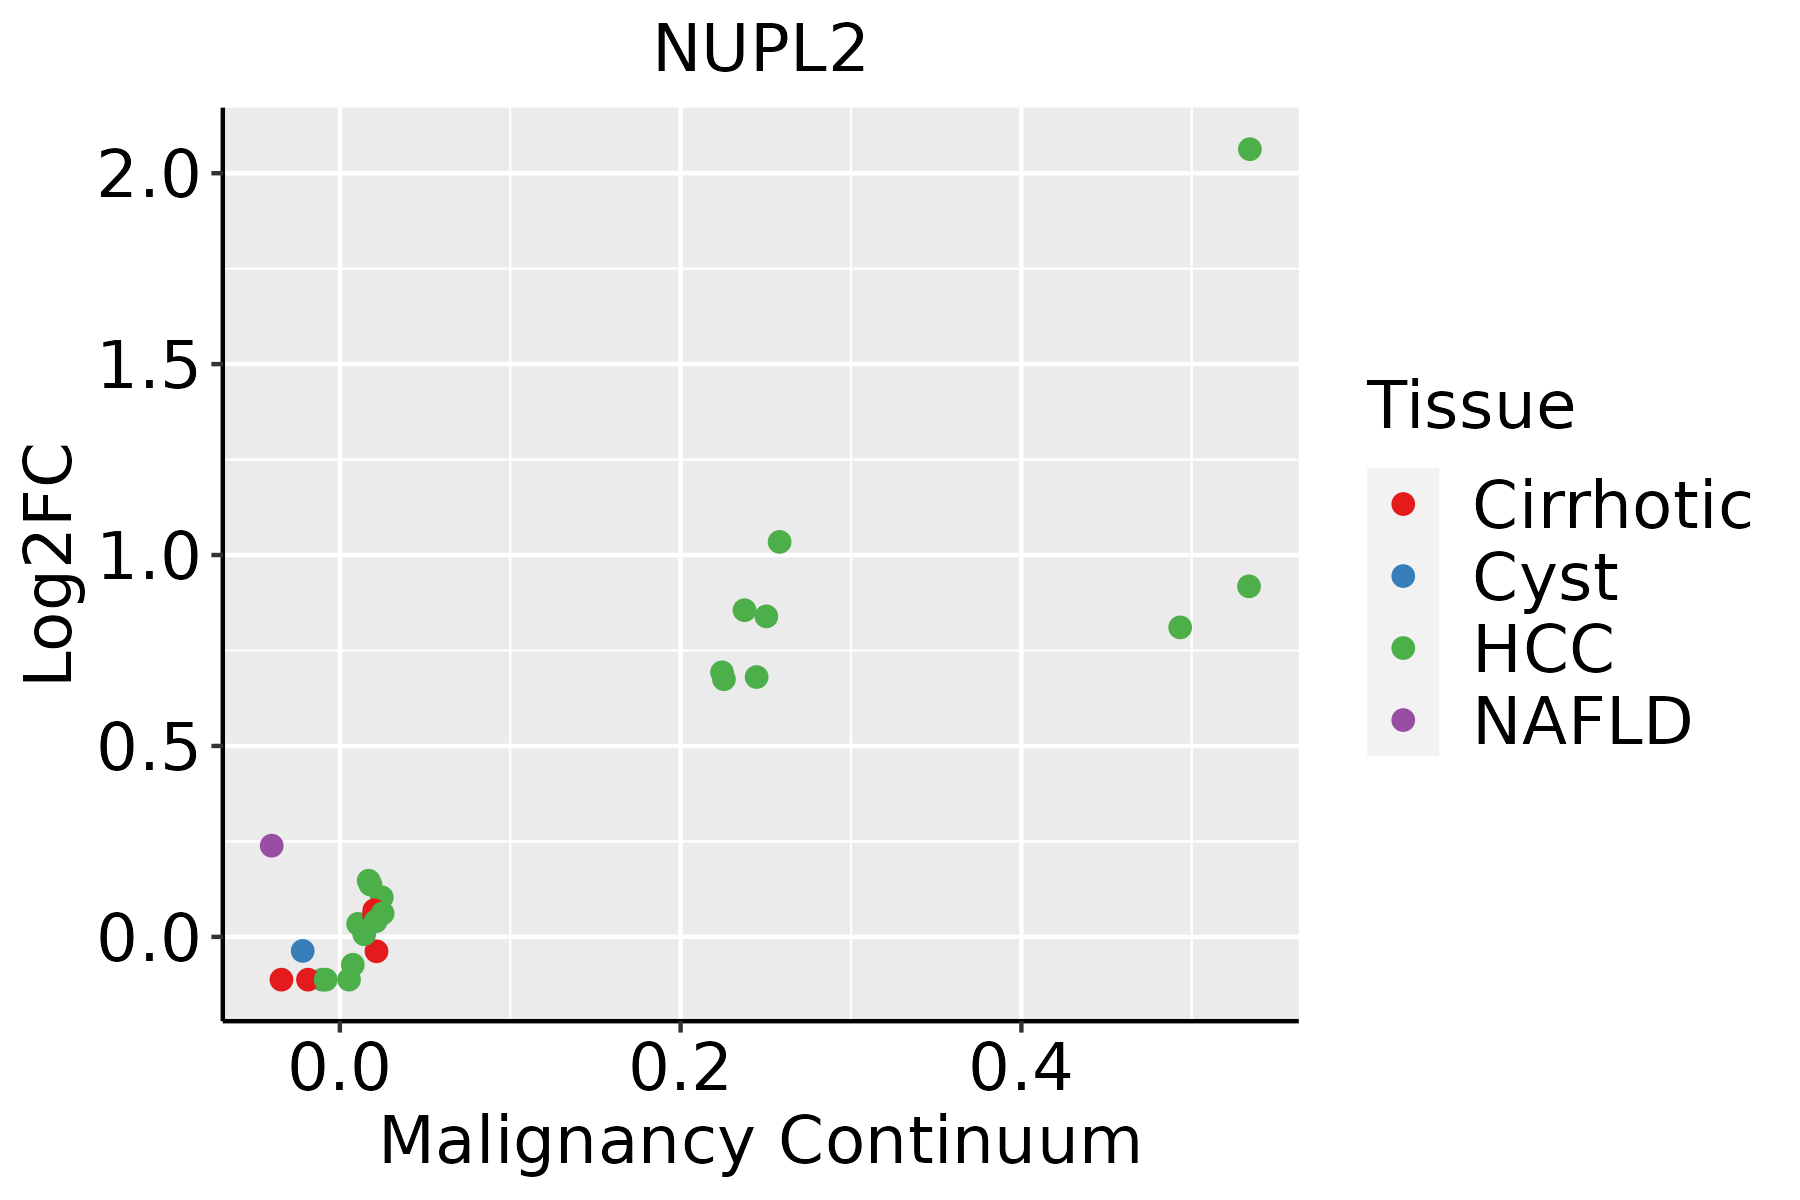 | HCC: Hepatocellular carcinoma |
| NAFLD: Non-alcoholic fatty liver disease | ||
| Oral Cavity | 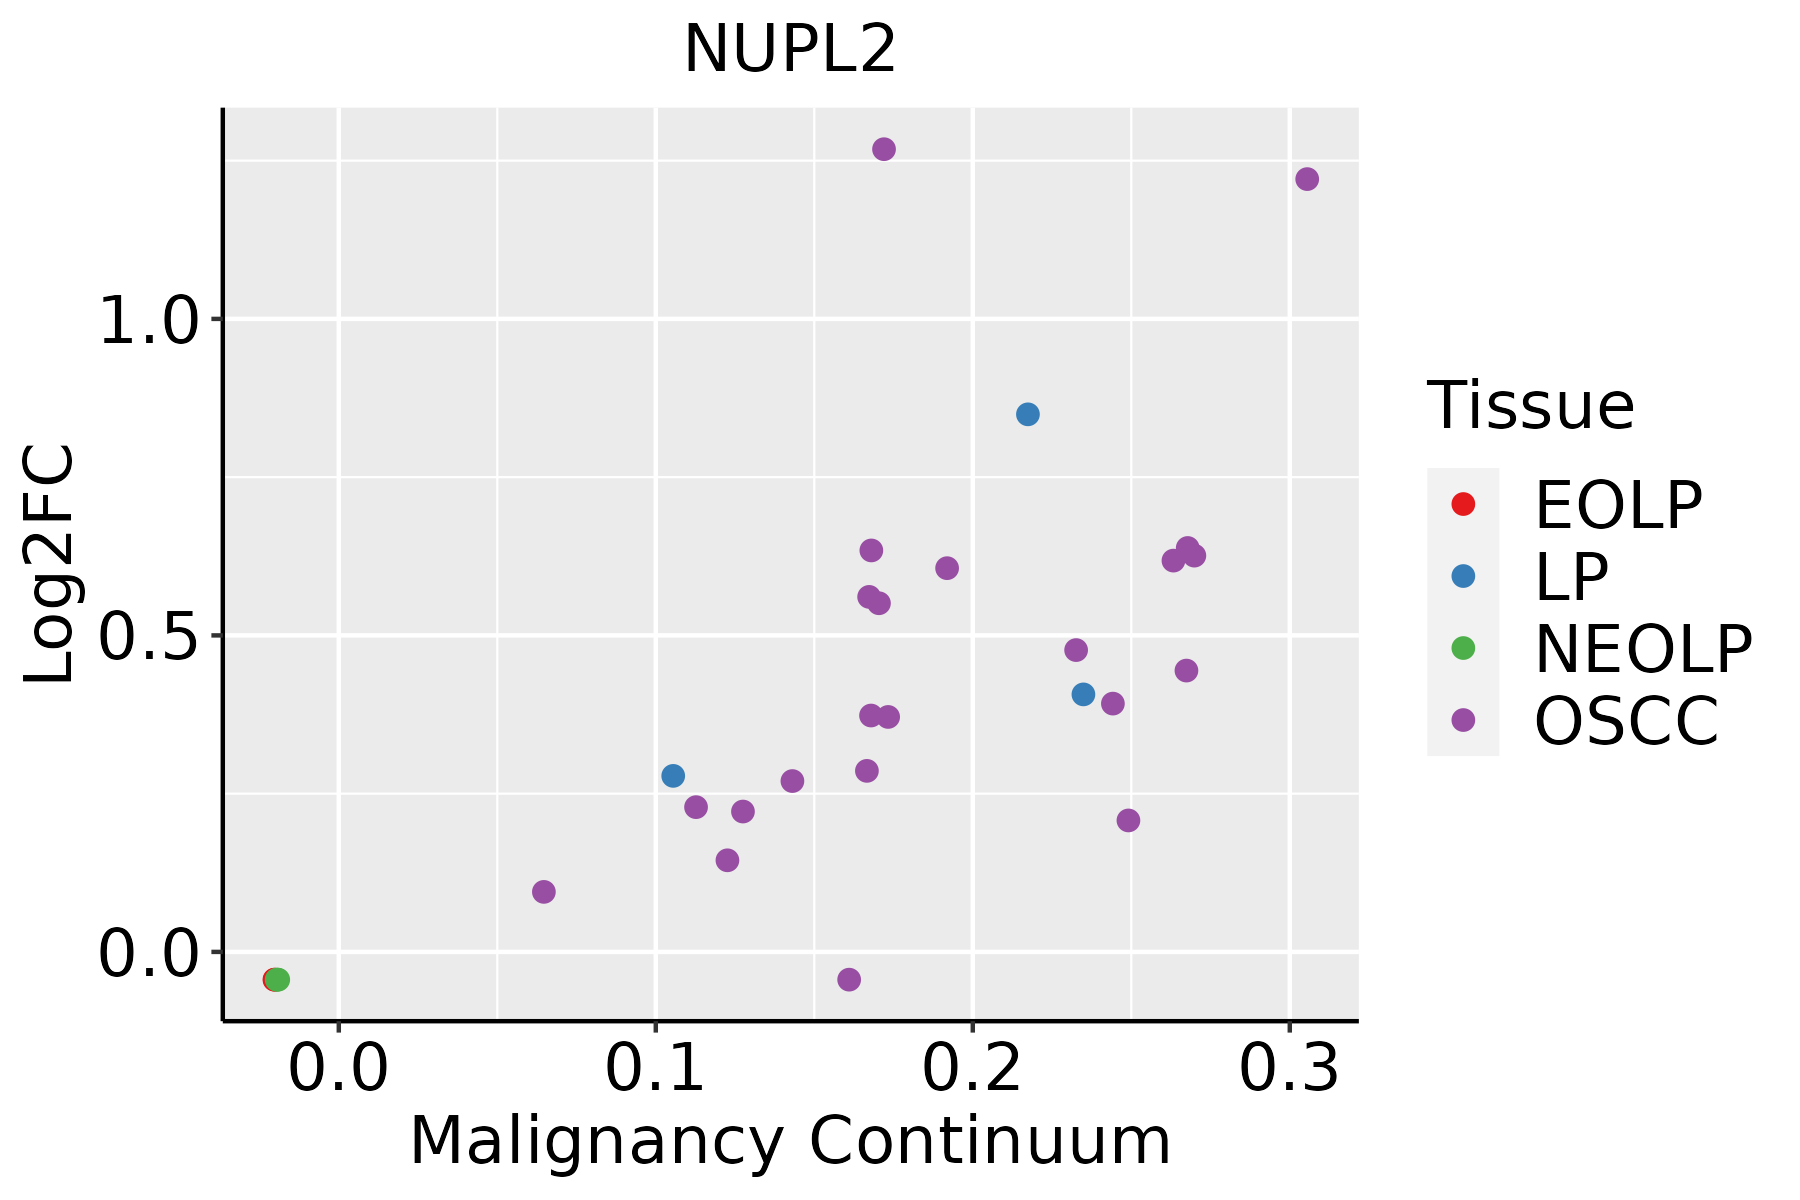 | EOLP: Erosive Oral lichen planus |
| LP: leukoplakia | ||
| NEOLP: Non-erosive oral lichen planus | ||
| OSCC: Oral squamous cell carcinoma | ||
| Skin | 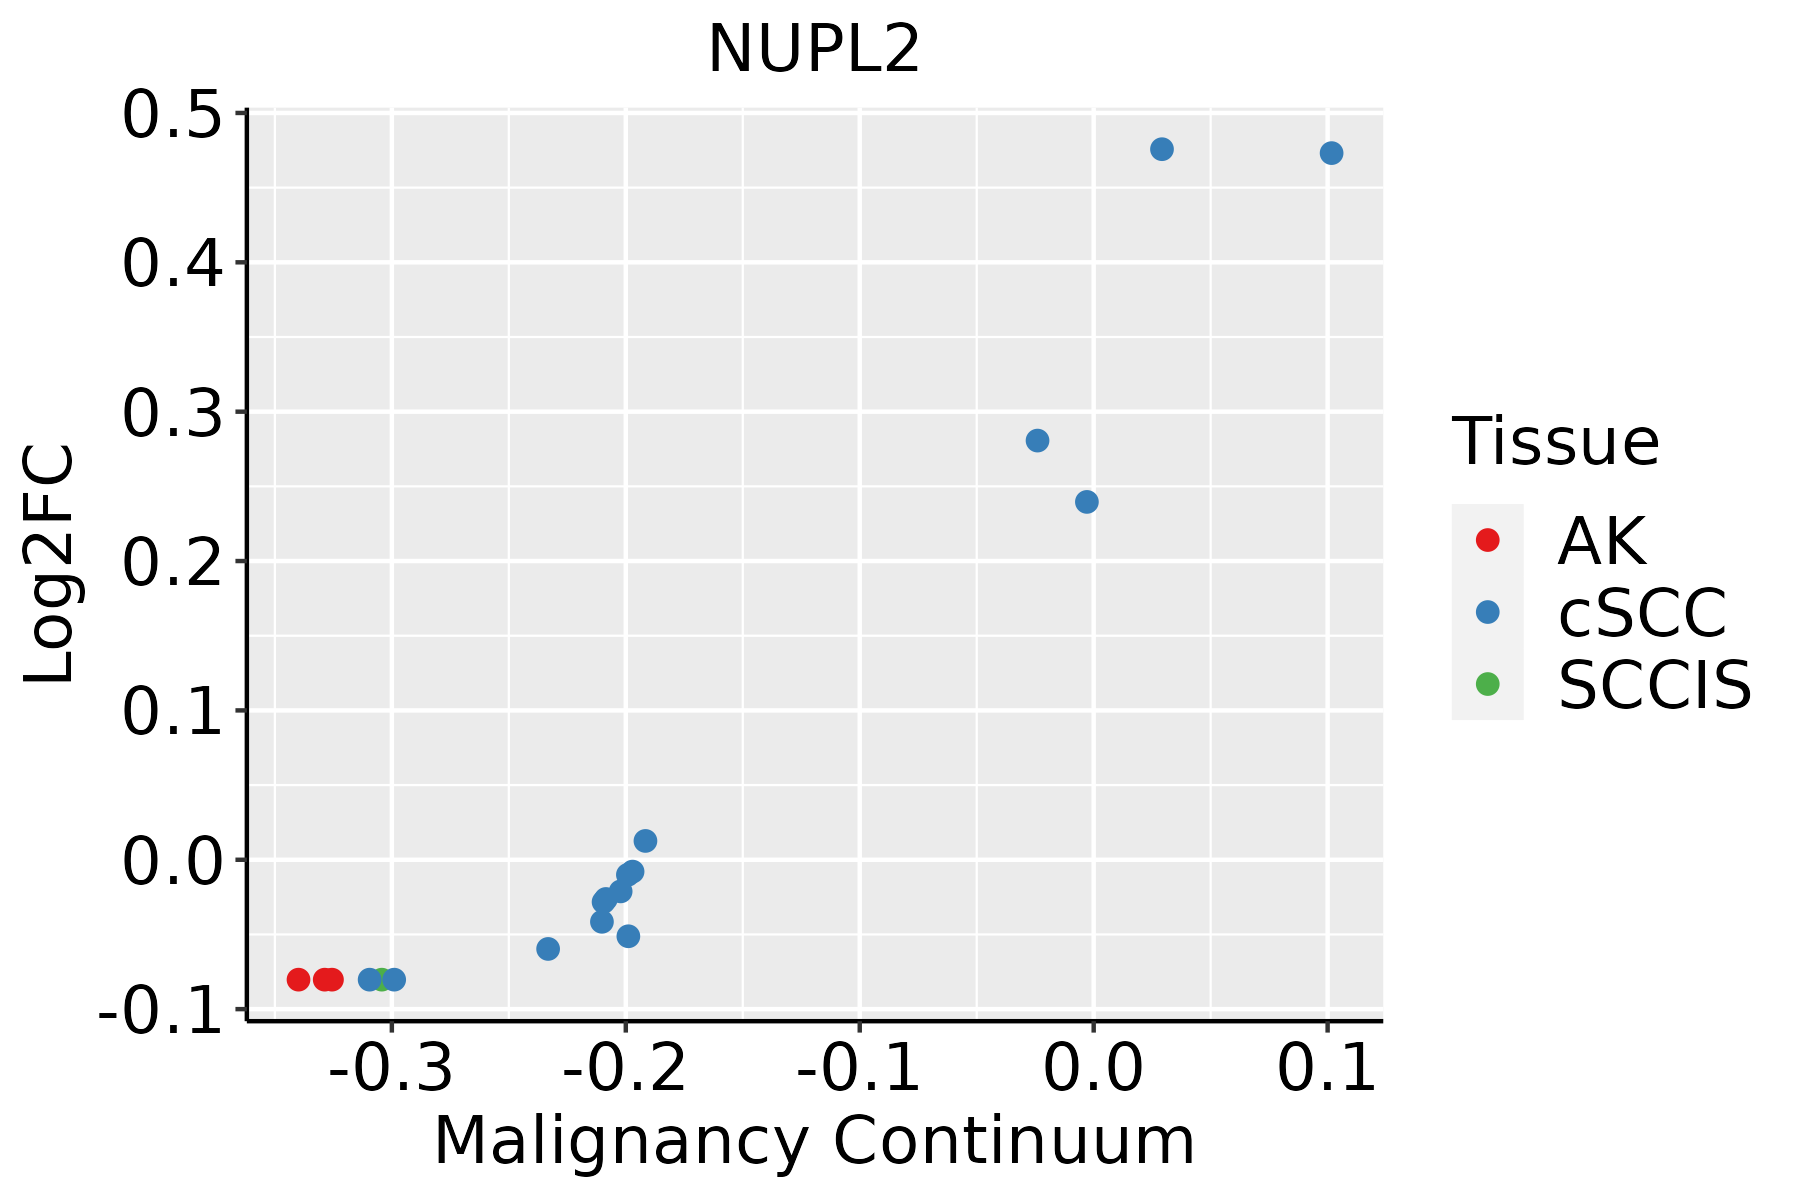 | AK: Actinic keratosis |
| cSCC: Cutaneous squamous cell carcinoma | ||
| SCCIS:squamous cell carcinoma in situ | ||
| Thyroid |  | ATC: Anaplastic thyroid cancer |
| HT: Hashimoto's thyroiditis | ||
| PTC: Papillary thyroid cancer |
| ∗log2FC in expression of this searched gene in stem-like cells from each diseased tissue sample relative to stem-like cells in normal samples in each tissue plotted against the malignancy continuum. Samples are colored based on if they are from different disease stage. |
Top |
Malignant transformation related pathway analysis |
| Find out the enriched GO biological processes and KEGG pathways involved in transition from healthy to precancer to cancer |
| Tissue | Disease Stage | Enriched GO biological Processes |
| Colorectum | AD |  |
| Colorectum | SER |  |
| Colorectum | MSS |  |
| Colorectum | MSI-H |  |
| Colorectum | FAP |  |
| ∗Top 15 enriched GO BP terms are showed in the bar plot of each disease state in each tissue. Each row represents a significant GO biological process which is colored according to the -log10(p.adjust). |
| Page: 1 2 3 4 5 6 7 8 9 |
| GO ID | Tissue | Disease Stage | Description | Gene Ratio | Bg Ratio | pvalue | p.adjust | Count |
| Page: 1 |
| Pathway ID | Tissue | Disease Stage | Description | Gene Ratio | Bg Ratio | pvalue | p.adjust | qvalue | Count |
| hsa030137 | Esophagus | HGIN | Nucleocytoplasmic transport | 31/1383 | 108/8465 | 8.29e-04 | 7.95e-03 | 6.31e-03 | 31 |
| hsa0301312 | Esophagus | HGIN | Nucleocytoplasmic transport | 31/1383 | 108/8465 | 8.29e-04 | 7.95e-03 | 6.31e-03 | 31 |
| hsa0301321 | Esophagus | ESCC | Nucleocytoplasmic transport | 89/4205 | 108/8465 | 1.20e-12 | 2.37e-11 | 1.21e-11 | 89 |
| hsa0301331 | Esophagus | ESCC | Nucleocytoplasmic transport | 89/4205 | 108/8465 | 1.20e-12 | 2.37e-11 | 1.21e-11 | 89 |
| Page: 1 |
Top |
Cell-cell communication analysis |
| Identification of potential cell-cell interactions between two cell types and their ligand-receptor pairs for different disease states |
| Ligand | Receptor | LRpair | Pathway | Tissue | Disease Stage |
| Page: 1 |
Top |
Single-cell gene regulatory network inference analysis |
| Find out the significant the regulons (TFs) and the target genes of each regulon across cell types for different disease states |
| TF | Cell Type | Tissue | Disease Stage | Target Gene | RSS | Regulon Activity |
| ∗The dot plots of a searched regulon are shown for all cell subpopulations in each disease state of each tissue based on the regulon specific score inferred using pySCENIC and by calculating the average expression. |
| Page: 1 |
Top |
Somatic mutation of malignant transformation related genes |
| Annotation of somatic variants for genes involved in malignant transformation |
| Hugo Symbol | Variant Class | Variant Classification | dbSNP RS | HGVSc | HGVSp | HGVSp Short | SWISSPROT | BIOTYPE | SIFT | PolyPhen | Tumor Sample Barcode | Tissue | Histology | Sex | Age | Stage | Therapy Types | Drugs | Outcome |
| NUPL2 | SNV | Missense_Mutation | c.871N>C | p.Gly291Arg | p.G291R | O15504 | protein_coding | deleterious(0.05) | benign(0.062) | TCGA-A7-A13D-01 | Breast | breast invasive carcinoma | Female | <65 | I/II | Chemotherapy | cytoxan | SD | |
| NUPL2 | SNV | Missense_Mutation | novel | c.710N>C | p.Asn237Thr | p.N237T | O15504 | protein_coding | tolerated(0.13) | benign(0.018) | TCGA-LL-A5YO-01 | Breast | breast invasive carcinoma | Female | <65 | I/II | Chemotherapy | taxotere | CR |
| NUPL2 | insertion | Frame_Shift_Ins | rs758695627 | c.212dupG | p.Ser72GlnfsTer13 | p.S72Qfs*13 | O15504 | protein_coding | TCGA-E2-A150-01 | Breast | breast invasive carcinoma | Female | <65 | I/II | Chemotherapy | doxorubicin | SD | ||
| NUPL2 | SNV | Missense_Mutation | novel | c.734N>C | p.Asn245Thr | p.N245T | O15504 | protein_coding | tolerated(1) | benign(0.306) | TCGA-AA-3510-01 | Colorectum | colon adenocarcinoma | Male | >=65 | I/II | Unknown | Unknown | SD |
| NUPL2 | SNV | Missense_Mutation | c.629G>C | p.Gly210Ala | p.G210A | O15504 | protein_coding | tolerated(1) | benign(0.006) | TCGA-AA-3681-01 | Colorectum | colon adenocarcinoma | Female | >=65 | III/IV | Unknown | Unknown | SD | |
| NUPL2 | SNV | Missense_Mutation | c.1147N>T | p.Asp383Tyr | p.D383Y | O15504 | protein_coding | deleterious(0.01) | possibly_damaging(0.855) | TCGA-AA-A010-01 | Colorectum | colon adenocarcinoma | Female | <65 | I/II | Chemotherapy | folinic | CR | |
| NUPL2 | SNV | Missense_Mutation | c.1027N>A | p.Ala343Thr | p.A343T | O15504 | protein_coding | tolerated(0.18) | benign(0.028) | TCGA-AD-6895-01 | Colorectum | colon adenocarcinoma | Male | >=65 | III/IV | Unknown | Unknown | SD | |
| NUPL2 | SNV | Missense_Mutation | c.949N>A | p.Ser317Thr | p.S317T | O15504 | protein_coding | tolerated(0.07) | probably_damaging(0.997) | TCGA-DM-A0XF-01 | Colorectum | colon adenocarcinoma | Female | >=65 | III/IV | Chemotherapy | mayo | CR | |
| NUPL2 | SNV | Missense_Mutation | c.80N>T | p.Gly27Val | p.G27V | O15504 | protein_coding | deleterious(0.01) | probably_damaging(0.934) | TCGA-AG-3726-01 | Colorectum | rectum adenocarcinoma | Female | <65 | I/II | Unknown | Unknown | SD | |
| NUPL2 | deletion | Frame_Shift_Del | c.577delN | p.Ser194ValfsTer2 | p.S194Vfs*2 | O15504 | protein_coding | TCGA-AD-A5EJ-01 | Colorectum | colon adenocarcinoma | Female | >=65 | I/II | Unknown | Unknown | SD |
| Page: 1 2 3 4 |
Top |
Related drugs of malignant transformation related genes |
| Identification of chemicals and drugs interact with genes involved in malignant transfromation |
| (DGIdb 4.0) |
| Entrez ID | Symbol | Category | Interaction Types | Drug Claim Name | Drug Name | PMIDs |
| Page: 1 |

Copyright 2023-Present -The University of Texas Health Science Center at Houston |