
|
|||||
|
 | |
| |
| |
| |
| |
| |
|
Gene: NUP50 |
Gene summary for NUP50 |
| Gene information | Species | Human | Gene symbol | NUP50 | Gene ID | 10762 |
| Gene name | nucleoporin 50 | |
| Gene Alias | NPAP60 | |
| Cytomap | 22q13.31 | |
| Gene Type | protein-coding | GO ID | GO:0006403 | UniProtAcc | A0A024R4X7 |
Top |
Malignant transformation analysis |
| Identification of the aberrant gene expression in precancerous and cancerous lesions by comparing the gene expression of stem-like cells in diseased tissues with normal stem cells |
| Entrez ID | Symbol | Replicates | Species | Organ | Tissue | Adj P-value | Log2FC | Malignancy |
| 10762 | NUP50 | LZE4T | Human | Esophagus | ESCC | 1.06e-12 | 1.92e-01 | 0.0811 |
| 10762 | NUP50 | LZE7T | Human | Esophagus | ESCC | 3.71e-10 | 7.98e-01 | 0.0667 |
| 10762 | NUP50 | LZE8T | Human | Esophagus | ESCC | 9.18e-09 | 6.30e-02 | 0.067 |
| 10762 | NUP50 | LZE21D1 | Human | Esophagus | HGIN | 9.91e-03 | 5.22e-03 | 0.0632 |
| 10762 | NUP50 | LZE22D1 | Human | Esophagus | HGIN | 4.52e-02 | 3.28e-02 | 0.0595 |
| 10762 | NUP50 | LZE24T | Human | Esophagus | ESCC | 2.37e-13 | 3.96e-01 | 0.0596 |
| 10762 | NUP50 | LZE21T | Human | Esophagus | ESCC | 2.17e-06 | 6.91e-01 | 0.0655 |
| 10762 | NUP50 | LZE6T | Human | Esophagus | ESCC | 4.20e-04 | -1.90e-02 | 0.0845 |
| 10762 | NUP50 | P1T-E | Human | Esophagus | ESCC | 2.40e-10 | 2.56e-01 | 0.0875 |
| 10762 | NUP50 | P2T-E | Human | Esophagus | ESCC | 5.00e-16 | 3.06e-01 | 0.1177 |
| 10762 | NUP50 | P4T-E | Human | Esophagus | ESCC | 4.92e-17 | 4.26e-01 | 0.1323 |
| 10762 | NUP50 | P5T-E | Human | Esophagus | ESCC | 2.08e-11 | 4.12e-02 | 0.1327 |
| 10762 | NUP50 | P8T-E | Human | Esophagus | ESCC | 7.65e-14 | 2.71e-01 | 0.0889 |
| 10762 | NUP50 | P9T-E | Human | Esophagus | ESCC | 3.68e-34 | 9.63e-01 | 0.1131 |
| 10762 | NUP50 | P10T-E | Human | Esophagus | ESCC | 1.23e-23 | 4.99e-01 | 0.116 |
| 10762 | NUP50 | P11T-E | Human | Esophagus | ESCC | 1.93e-08 | 5.14e-01 | 0.1426 |
| 10762 | NUP50 | P12T-E | Human | Esophagus | ESCC | 1.34e-27 | 7.10e-01 | 0.1122 |
| 10762 | NUP50 | P15T-E | Human | Esophagus | ESCC | 2.28e-25 | 7.15e-01 | 0.1149 |
| 10762 | NUP50 | P16T-E | Human | Esophagus | ESCC | 5.57e-17 | 3.69e-01 | 0.1153 |
| 10762 | NUP50 | P20T-E | Human | Esophagus | ESCC | 1.19e-08 | 1.02e-01 | 0.1124 |
| Page: 1 2 3 4 5 6 |
| Tissue | Expression Dynamics | Abbreviation |
| Esophagus | 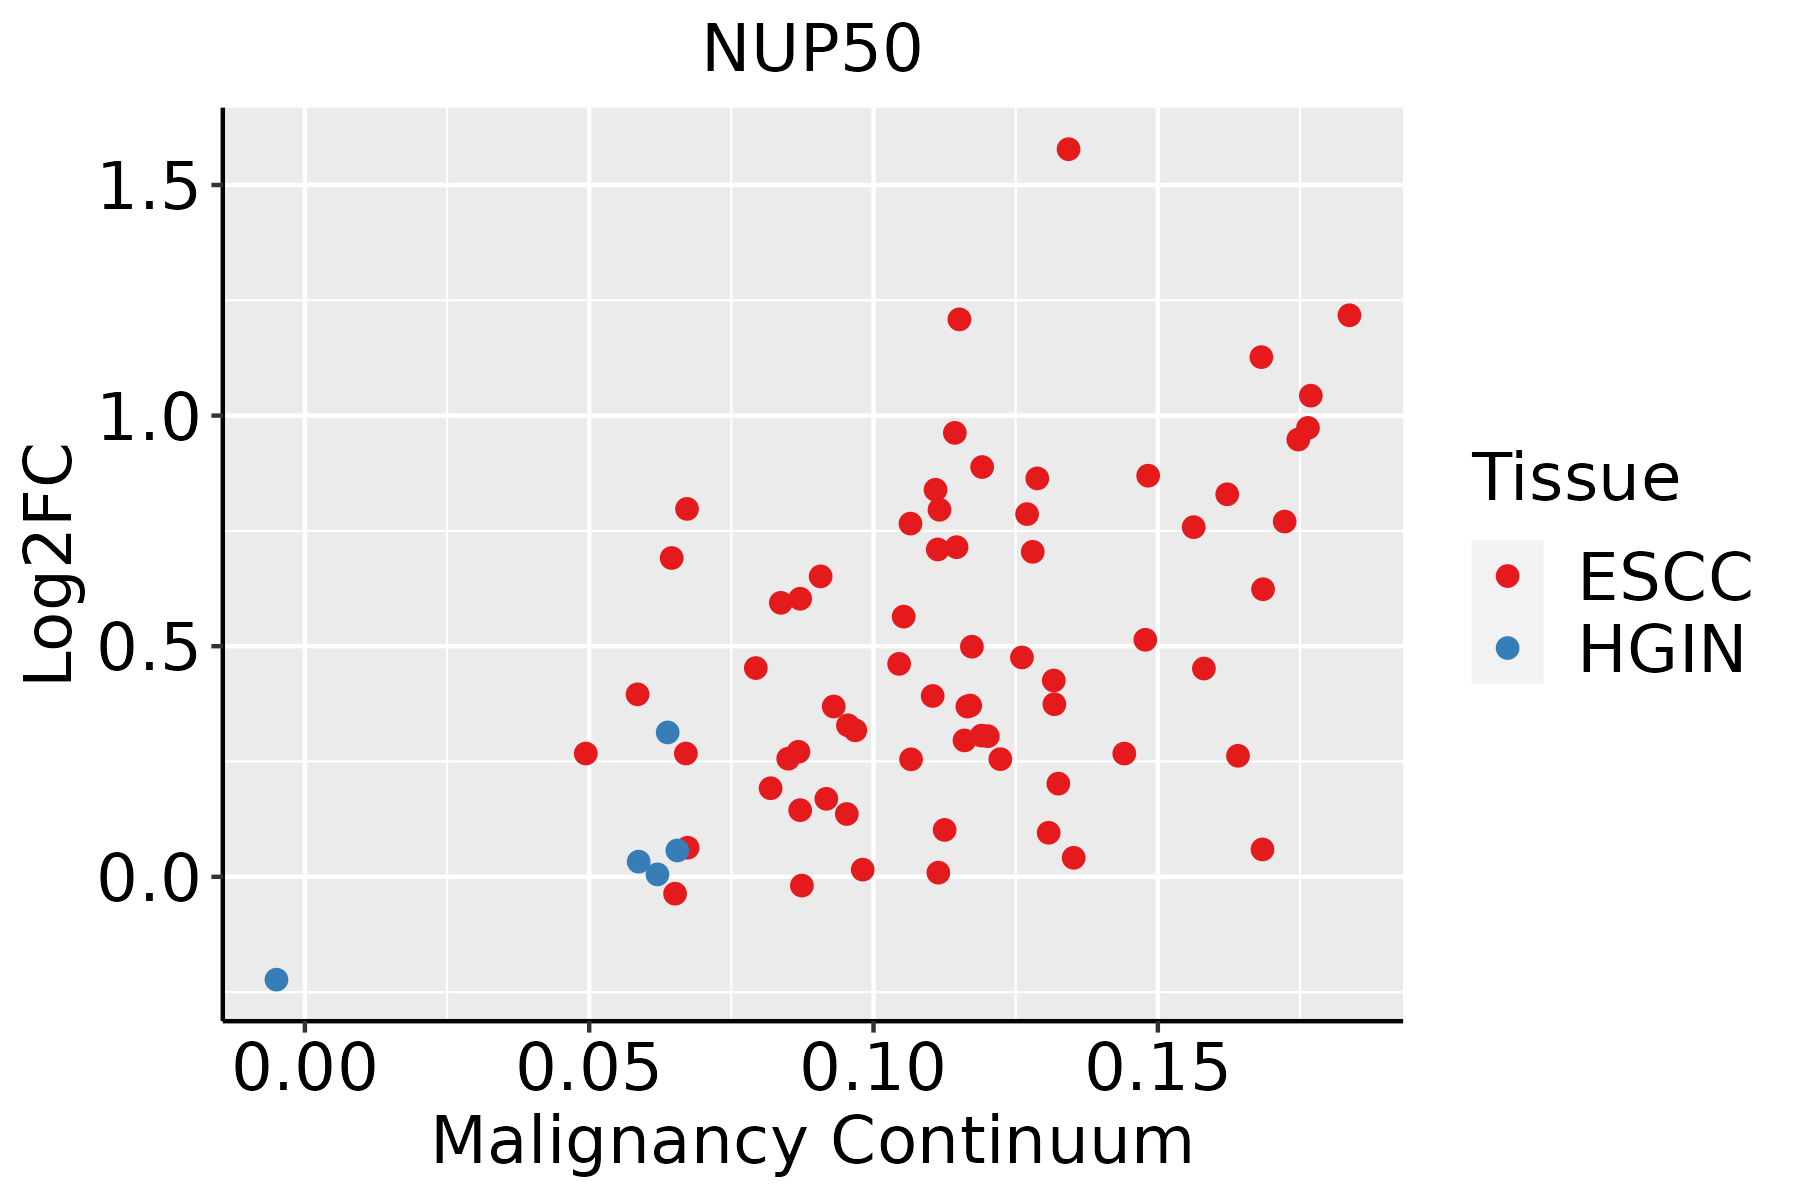 | ESCC: Esophageal squamous cell carcinoma |
| HGIN: High-grade intraepithelial neoplasias | ||
| LGIN: Low-grade intraepithelial neoplasias | ||
| Liver | 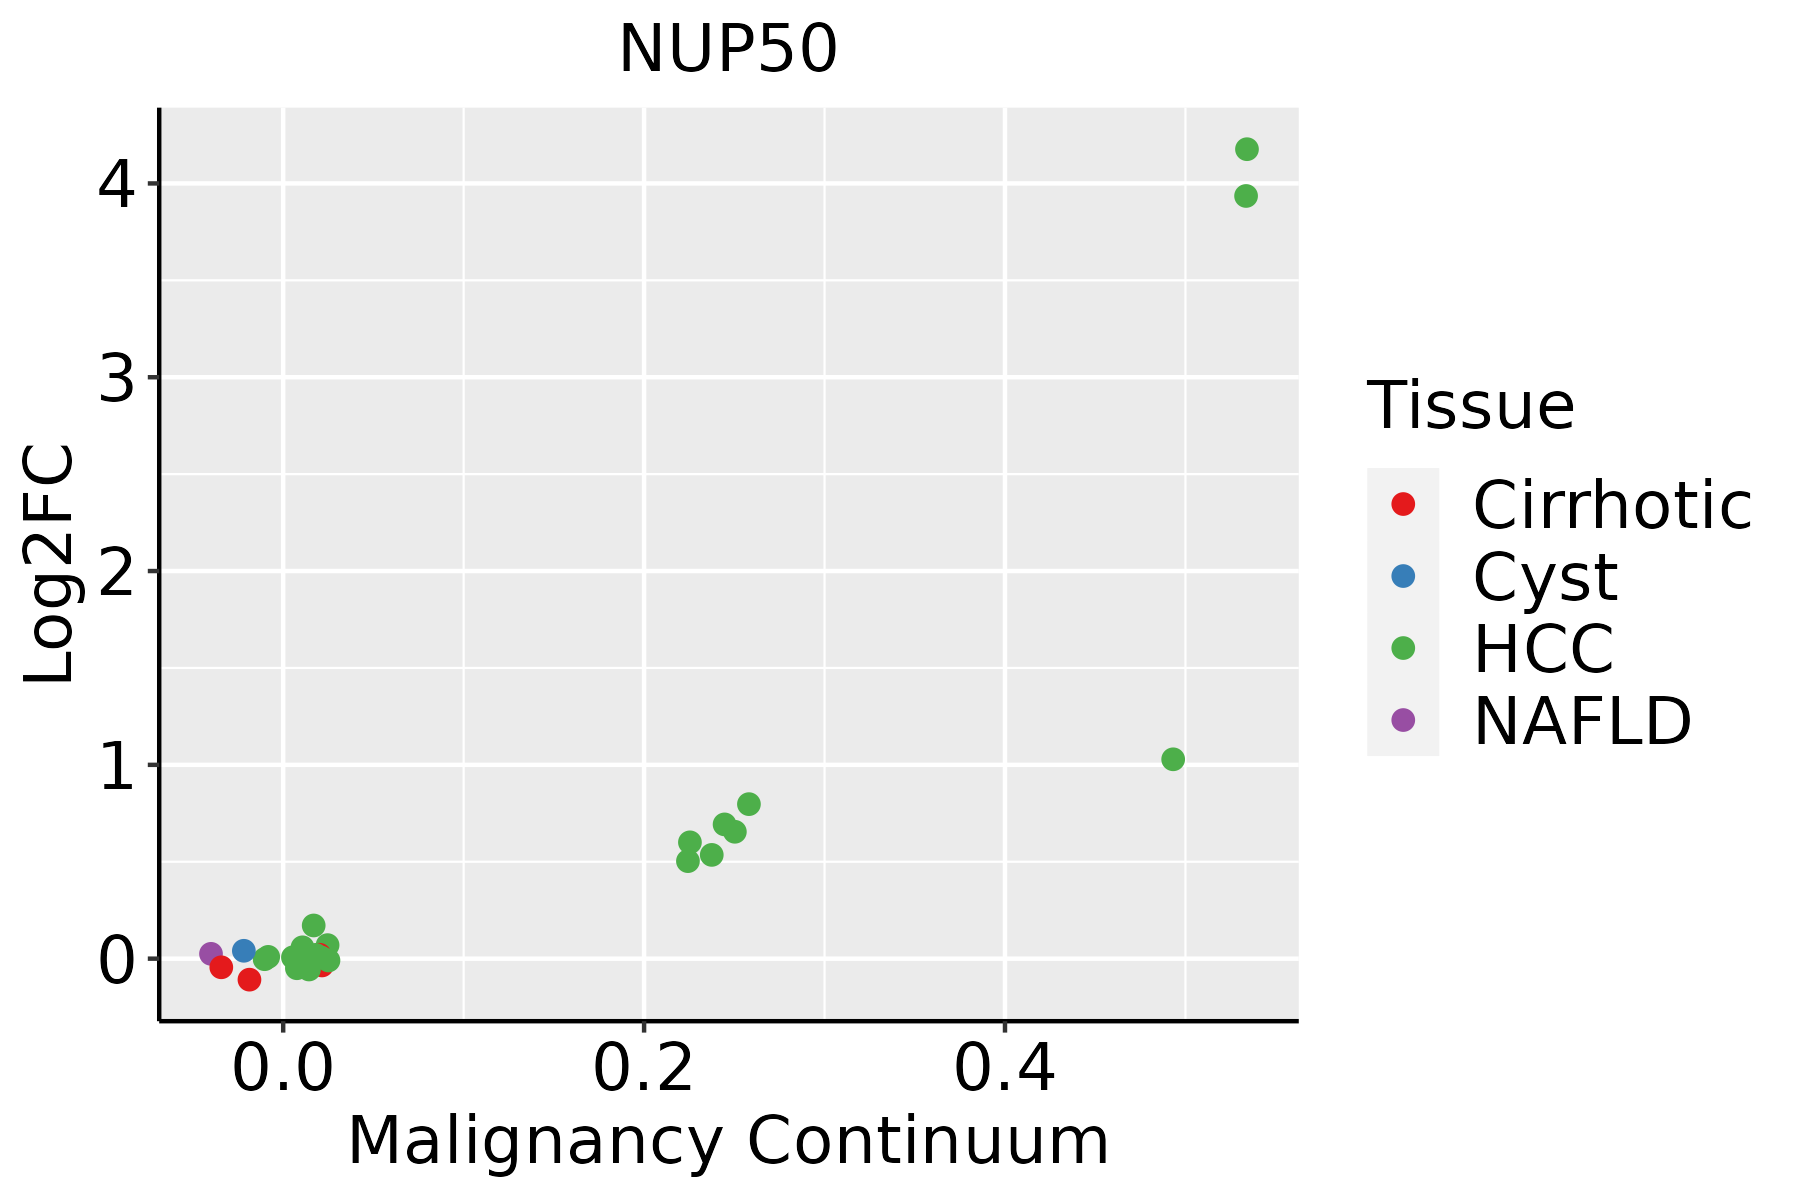 | HCC: Hepatocellular carcinoma |
| NAFLD: Non-alcoholic fatty liver disease | ||
| Oral Cavity | 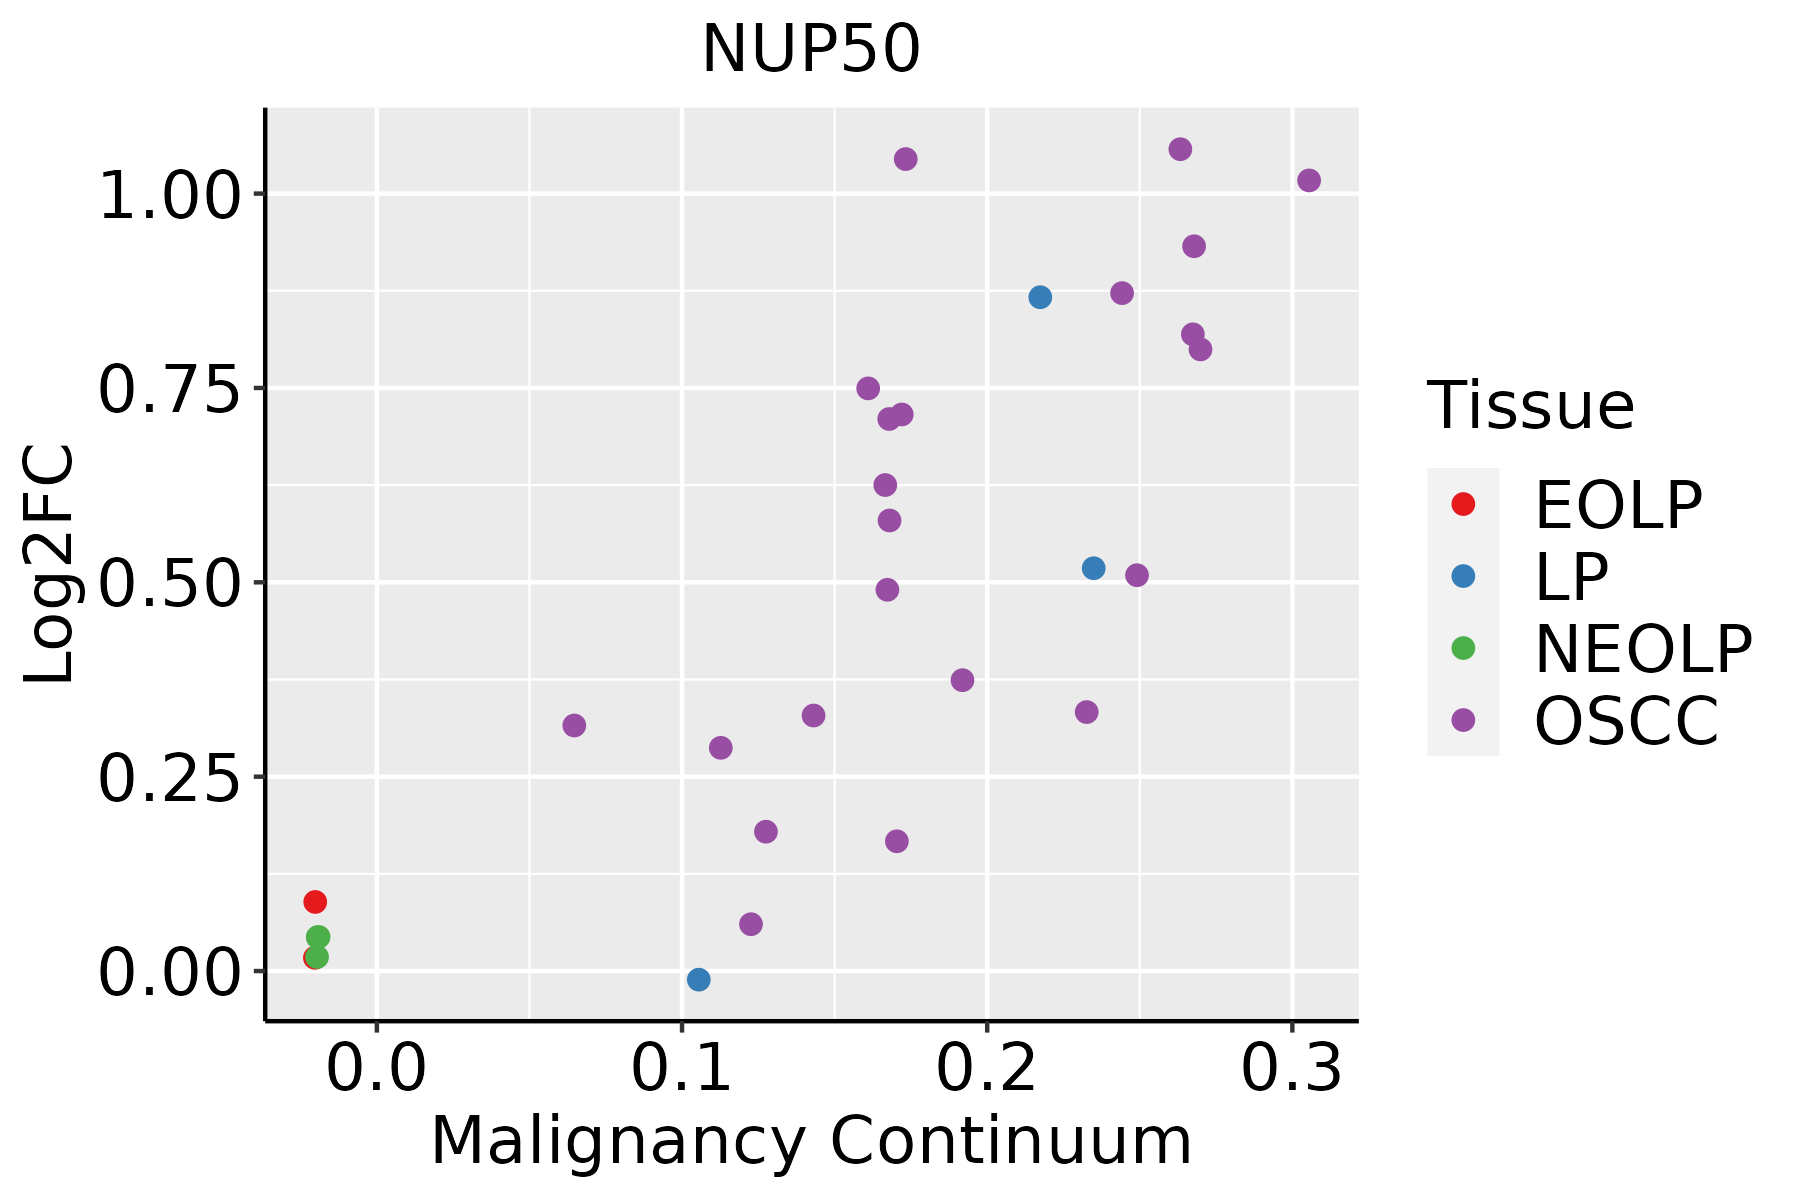 | EOLP: Erosive Oral lichen planus |
| LP: leukoplakia | ||
| NEOLP: Non-erosive oral lichen planus | ||
| OSCC: Oral squamous cell carcinoma | ||
| Skin |  | AK: Actinic keratosis |
| cSCC: Cutaneous squamous cell carcinoma | ||
| SCCIS:squamous cell carcinoma in situ | ||
| Thyroid |  | ATC: Anaplastic thyroid cancer |
| HT: Hashimoto's thyroiditis | ||
| PTC: Papillary thyroid cancer |
| ∗log2FC in expression of this searched gene in stem-like cells from each diseased tissue sample relative to stem-like cells in normal samples in each tissue plotted against the malignancy continuum. Samples are colored based on if they are from different disease stage. |
Top |
Malignant transformation related pathway analysis |
| Find out the enriched GO biological processes and KEGG pathways involved in transition from healthy to precancer to cancer |
| Tissue | Disease Stage | Enriched GO biological Processes |
| Colorectum | AD |  |
| Colorectum | SER |  |
| Colorectum | MSS |  |
| Colorectum | MSI-H |  |
| Colorectum | FAP |  |
| ∗Top 15 enriched GO BP terms are showed in the bar plot of each disease state in each tissue. Each row represents a significant GO biological process which is colored according to the -log10(p.adjust). |
| Page: 1 2 3 4 5 6 7 8 9 |
| GO ID | Tissue | Disease Stage | Description | Gene Ratio | Bg Ratio | pvalue | p.adjust | Count |
| GO:007259420 | Esophagus | HGIN | establishment of protein localization to organelle | 120/2587 | 422/18723 | 1.73e-15 | 4.00e-13 | 120 |
| GO:000640320 | Esophagus | HGIN | RNA localization | 66/2587 | 201/18723 | 4.06e-12 | 5.41e-10 | 66 |
| GO:003450417 | Esophagus | HGIN | protein localization to nucleus | 84/2587 | 290/18723 | 1.06e-11 | 1.24e-09 | 84 |
| GO:000691319 | Esophagus | HGIN | nucleocytoplasmic transport | 83/2587 | 301/18723 | 2.14e-10 | 1.97e-08 | 83 |
| GO:005116919 | Esophagus | HGIN | nuclear transport | 83/2587 | 301/18723 | 2.14e-10 | 1.97e-08 | 83 |
| GO:005065716 | Esophagus | HGIN | nucleic acid transport | 49/2587 | 163/18723 | 5.71e-08 | 3.06e-06 | 49 |
| GO:005065816 | Esophagus | HGIN | RNA transport | 49/2587 | 163/18723 | 5.71e-08 | 3.06e-06 | 49 |
| GO:005123616 | Esophagus | HGIN | establishment of RNA localization | 49/2587 | 166/18723 | 1.07e-07 | 5.47e-06 | 49 |
| GO:00510288 | Esophagus | HGIN | mRNA transport | 40/2587 | 130/18723 | 4.67e-07 | 2.07e-05 | 40 |
| GO:001593116 | Esophagus | HGIN | nucleobase-containing compound transport | 57/2587 | 222/18723 | 1.76e-06 | 6.52e-05 | 57 |
| GO:001703817 | Esophagus | HGIN | protein import | 51/2587 | 206/18723 | 1.79e-05 | 4.86e-04 | 51 |
| GO:005117010 | Esophagus | HGIN | import into nucleus | 41/2587 | 159/18723 | 4.24e-05 | 1.04e-03 | 41 |
| GO:000660610 | Esophagus | HGIN | protein import into nucleus | 39/2587 | 155/18723 | 1.14e-04 | 2.39e-03 | 39 |
| GO:0072594110 | Esophagus | ESCC | establishment of protein localization to organelle | 311/8552 | 422/18723 | 3.02e-32 | 2.13e-29 | 311 |
| GO:0006913110 | Esophagus | ESCC | nucleocytoplasmic transport | 230/8552 | 301/18723 | 6.04e-28 | 2.02e-25 | 230 |
| GO:0051169110 | Esophagus | ESCC | nuclear transport | 230/8552 | 301/18723 | 6.04e-28 | 2.02e-25 | 230 |
| GO:0006403110 | Esophagus | ESCC | RNA localization | 166/8552 | 201/18723 | 1.95e-27 | 6.18e-25 | 166 |
| GO:003450418 | Esophagus | ESCC | protein localization to nucleus | 211/8552 | 290/18723 | 4.06e-21 | 6.60e-19 | 211 |
| GO:005123617 | Esophagus | ESCC | establishment of RNA localization | 134/8552 | 166/18723 | 1.23e-20 | 1.81e-18 | 134 |
| GO:005102815 | Esophagus | ESCC | mRNA transport | 110/8552 | 130/18723 | 2.76e-20 | 3.80e-18 | 110 |
| Page: 1 2 3 4 5 6 |
| Pathway ID | Tissue | Disease Stage | Description | Gene Ratio | Bg Ratio | pvalue | p.adjust | qvalue | Count |
| hsa0501430 | Esophagus | HGIN | Amyotrophic lateral sclerosis | 140/1383 | 364/8465 | 2.13e-25 | 1.16e-23 | 9.19e-24 | 140 |
| hsa030137 | Esophagus | HGIN | Nucleocytoplasmic transport | 31/1383 | 108/8465 | 8.29e-04 | 7.95e-03 | 6.31e-03 | 31 |
| hsa05014113 | Esophagus | HGIN | Amyotrophic lateral sclerosis | 140/1383 | 364/8465 | 2.13e-25 | 1.16e-23 | 9.19e-24 | 140 |
| hsa0301312 | Esophagus | HGIN | Nucleocytoplasmic transport | 31/1383 | 108/8465 | 8.29e-04 | 7.95e-03 | 6.31e-03 | 31 |
| hsa05014210 | Esophagus | ESCC | Amyotrophic lateral sclerosis | 266/4205 | 364/8465 | 1.31e-20 | 2.20e-18 | 1.13e-18 | 266 |
| hsa0301321 | Esophagus | ESCC | Nucleocytoplasmic transport | 89/4205 | 108/8465 | 1.20e-12 | 2.37e-11 | 1.21e-11 | 89 |
| hsa0501438 | Esophagus | ESCC | Amyotrophic lateral sclerosis | 266/4205 | 364/8465 | 1.31e-20 | 2.20e-18 | 1.13e-18 | 266 |
| hsa0301331 | Esophagus | ESCC | Nucleocytoplasmic transport | 89/4205 | 108/8465 | 1.20e-12 | 2.37e-11 | 1.21e-11 | 89 |
| hsa0501422 | Liver | HCC | Amyotrophic lateral sclerosis | 252/4020 | 364/8465 | 8.85e-18 | 7.41e-16 | 4.12e-16 | 252 |
| hsa03013 | Liver | HCC | Nucleocytoplasmic transport | 81/4020 | 108/8465 | 4.28e-09 | 6.83e-08 | 3.80e-08 | 81 |
| hsa0501432 | Liver | HCC | Amyotrophic lateral sclerosis | 252/4020 | 364/8465 | 8.85e-18 | 7.41e-16 | 4.12e-16 | 252 |
| hsa030131 | Liver | HCC | Nucleocytoplasmic transport | 81/4020 | 108/8465 | 4.28e-09 | 6.83e-08 | 3.80e-08 | 81 |
| hsa0501428 | Oral cavity | OSCC | Amyotrophic lateral sclerosis | 246/3704 | 364/8465 | 6.65e-21 | 1.11e-18 | 5.67e-19 | 246 |
| hsa030136 | Oral cavity | OSCC | Nucleocytoplasmic transport | 82/3704 | 108/8465 | 7.93e-12 | 1.33e-10 | 6.77e-11 | 82 |
| hsa05014112 | Oral cavity | OSCC | Amyotrophic lateral sclerosis | 246/3704 | 364/8465 | 6.65e-21 | 1.11e-18 | 5.67e-19 | 246 |
| hsa0301311 | Oral cavity | OSCC | Nucleocytoplasmic transport | 82/3704 | 108/8465 | 7.93e-12 | 1.33e-10 | 6.77e-11 | 82 |
| hsa0501429 | Oral cavity | LP | Amyotrophic lateral sclerosis | 197/2418 | 364/8465 | 1.25e-25 | 1.39e-23 | 8.93e-24 | 197 |
| hsa030132 | Oral cavity | LP | Nucleocytoplasmic transport | 53/2418 | 108/8465 | 4.68e-06 | 4.10e-05 | 2.64e-05 | 53 |
| hsa0501437 | Oral cavity | LP | Amyotrophic lateral sclerosis | 197/2418 | 364/8465 | 1.25e-25 | 1.39e-23 | 8.93e-24 | 197 |
| hsa030133 | Oral cavity | LP | Nucleocytoplasmic transport | 53/2418 | 108/8465 | 4.68e-06 | 4.10e-05 | 2.64e-05 | 53 |
| Page: 1 |
Top |
Cell-cell communication analysis |
| Identification of potential cell-cell interactions between two cell types and their ligand-receptor pairs for different disease states |
| Ligand | Receptor | LRpair | Pathway | Tissue | Disease Stage |
| Page: 1 |
Top |
Single-cell gene regulatory network inference analysis |
| Find out the significant the regulons (TFs) and the target genes of each regulon across cell types for different disease states |
| TF | Cell Type | Tissue | Disease Stage | Target Gene | RSS | Regulon Activity |
| ∗The dot plots of a searched regulon are shown for all cell subpopulations in each disease state of each tissue based on the regulon specific score inferred using pySCENIC and by calculating the average expression. |
| Page: 1 |
Top |
Somatic mutation of malignant transformation related genes |
| Annotation of somatic variants for genes involved in malignant transformation |
| Hugo Symbol | Variant Class | Variant Classification | dbSNP RS | HGVSc | HGVSp | HGVSp Short | SWISSPROT | BIOTYPE | SIFT | PolyPhen | Tumor Sample Barcode | Tissue | Histology | Sex | Age | Stage | Therapy Types | Drugs | Outcome |
| NUP50 | SNV | Missense_Mutation | c.116N>T | p.Ala39Val | p.A39V | Q9UKX7 | protein_coding | tolerated(0.14) | possibly_damaging(0.881) | TCGA-E9-A1NE-01 | Breast | breast invasive carcinoma | Female | <65 | I/II | Chemotherapy | doxorubicin | CR | |
| NUP50 | SNV | Missense_Mutation | rs144107829 | c.604N>A | p.Gly202Arg | p.G202R | Q9UKX7 | protein_coding | deleterious(0.04) | benign(0.308) | TCGA-2W-A8YY-01 | Cervix | cervical & endocervical cancer | Female | <65 | I/II | Chemotherapy | cisplatin | CR |
| NUP50 | SNV | Missense_Mutation | novel | c.1135G>T | p.Gly379Cys | p.G379C | Q9UKX7 | protein_coding | deleterious(0) | probably_damaging(1) | TCGA-EA-A410-01 | Cervix | cervical & endocervical cancer | Female | <65 | I/II | Unknown | Unknown | SD |
| NUP50 | SNV | Missense_Mutation | rs201334547 | c.1343G>A | p.Arg448Gln | p.R448Q | Q9UKX7 | protein_coding | deleterious(0) | probably_damaging(0.999) | TCGA-AM-5821-01 | Colorectum | colon adenocarcinoma | Female | >=65 | I/II | Unknown | Unknown | SD |
| NUP50 | SNV | Missense_Mutation | rs371473562 | c.433N>T | p.Leu145Phe | p.L145F | Q9UKX7 | protein_coding | tolerated(0.58) | benign(0) | TCGA-AZ-4615-01 | Colorectum | colon adenocarcinoma | Male | >=65 | III/IV | Chemotherapy | xeloda | PD |
| NUP50 | SNV | Missense_Mutation | c.1267A>G | p.Asn423Asp | p.N423D | Q9UKX7 | protein_coding | deleterious(0.01) | probably_damaging(0.989) | TCGA-CA-5254-01 | Colorectum | colon adenocarcinoma | Female | <65 | I/II | Chemotherapy | oxaliplatin | CR | |
| NUP50 | SNV | Missense_Mutation | c.494N>A | p.Cys165Tyr | p.C165Y | Q9UKX7 | protein_coding | tolerated(0.07) | probably_damaging(0.997) | TCGA-CK-4951-01 | Colorectum | colon adenocarcinoma | Female | >=65 | I/II | Unknown | Unknown | PD | |
| NUP50 | SNV | Missense_Mutation | c.320N>T | p.Ala107Val | p.A107V | Q9UKX7 | protein_coding | tolerated(0.11) | benign(0.001) | TCGA-NH-A5IV-01 | Colorectum | colon adenocarcinoma | Female | >=65 | I/II | Unknown | Unknown | SD | |
| NUP50 | SNV | Missense_Mutation | novel | c.139A>C | p.Asn47His | p.N47H | Q9UKX7 | protein_coding | tolerated(0.09) | benign(0.063) | TCGA-A5-A0G2-01 | Endometrium | uterine corpus endometrioid carcinoma | Female | <65 | III/IV | Unknown | Unknown | SD |
| NUP50 | SNV | Missense_Mutation | novel | c.523G>A | p.Val175Met | p.V175M | Q9UKX7 | protein_coding | deleterious(0) | probably_damaging(0.996) | TCGA-A5-A0G2-01 | Endometrium | uterine corpus endometrioid carcinoma | Female | <65 | III/IV | Unknown | Unknown | SD |
| Page: 1 2 3 4 5 |
Top |
Related drugs of malignant transformation related genes |
| Identification of chemicals and drugs interact with genes involved in malignant transfromation |
| (DGIdb 4.0) |
| Entrez ID | Symbol | Category | Interaction Types | Drug Claim Name | Drug Name | PMIDs |
| 10762 | NUP50 | NA | teniposide | TENIPOSIDE | 24444404 |
| Page: 1 |

Copyright 2023-Present -The University of Texas Health Science Center at Houston |