
|
|||||
|
 | |
| |
| |
| |
| |
| |
|
Gene: NUP43 |
Gene summary for NUP43 |
| Gene information | Species | Human | Gene symbol | NUP43 | Gene ID | 348995 |
| Gene name | nucleoporin 43 | |
| Gene Alias | bA350J20.1 | |
| Cytomap | 6q25.1 | |
| Gene Type | protein-coding | GO ID | GO:0006403 | UniProtAcc | Q8NFH3 |
Top |
Malignant transformation analysis |
| Identification of the aberrant gene expression in precancerous and cancerous lesions by comparing the gene expression of stem-like cells in diseased tissues with normal stem cells |
| Entrez ID | Symbol | Replicates | Species | Organ | Tissue | Adj P-value | Log2FC | Malignancy |
| 348995 | NUP43 | HCC1_Meng | Human | Liver | HCC | 7.58e-19 | -2.97e-02 | 0.0246 |
| 348995 | NUP43 | HCC1 | Human | Liver | HCC | 1.51e-13 | 3.03e+00 | 0.5336 |
| 348995 | NUP43 | HCC2 | Human | Liver | HCC | 6.07e-19 | 3.16e+00 | 0.5341 |
| 348995 | NUP43 | S014 | Human | Liver | HCC | 3.66e-03 | 2.06e-01 | 0.2254 |
| 348995 | NUP43 | S015 | Human | Liver | HCC | 4.46e-04 | 2.76e-01 | 0.2375 |
| 348995 | NUP43 | S016 | Human | Liver | HCC | 5.24e-04 | 1.50e-01 | 0.2243 |
| 348995 | NUP43 | S028 | Human | Liver | HCC | 4.57e-04 | 2.28e-01 | 0.2503 |
| Page: 1 |
| Tissue | Expression Dynamics | Abbreviation |
| Liver | 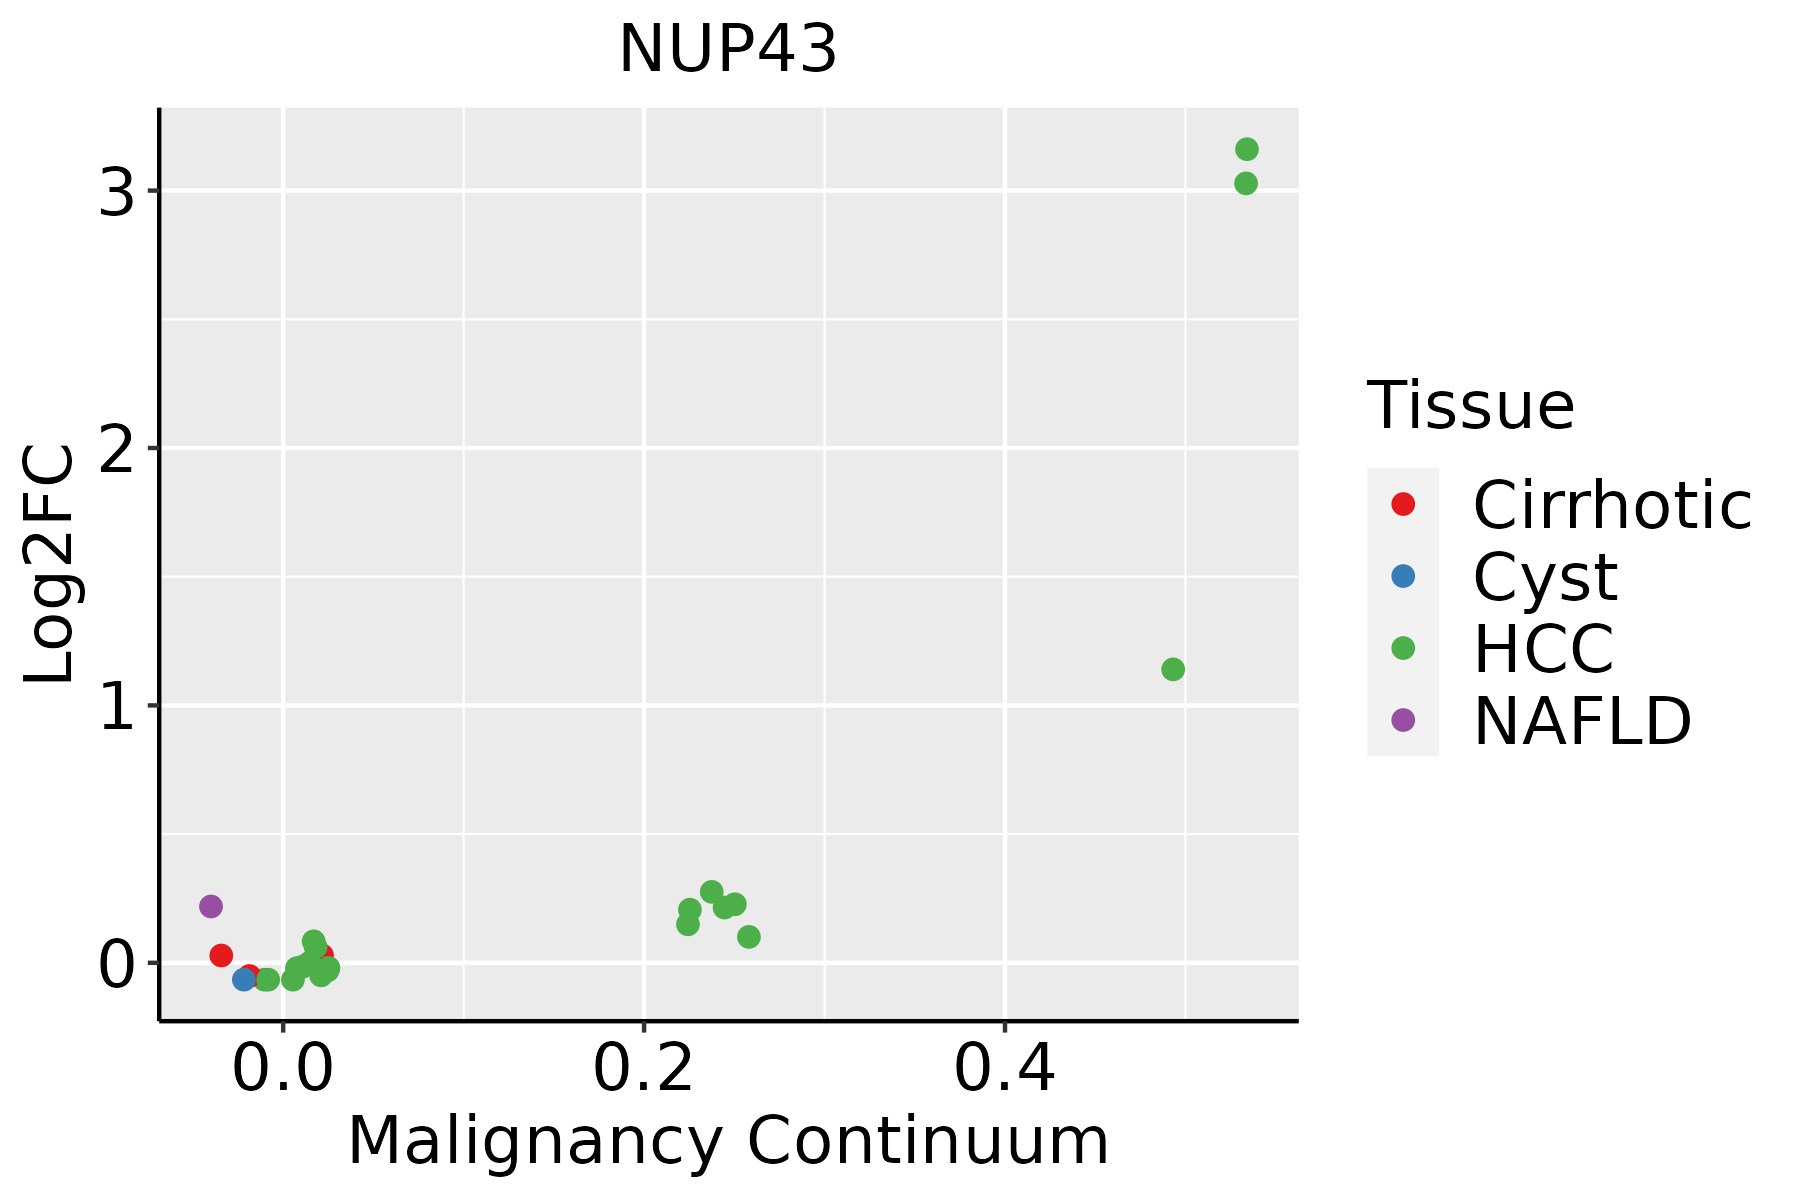 | HCC: Hepatocellular carcinoma |
| NAFLD: Non-alcoholic fatty liver disease |
| ∗log2FC in expression of this searched gene in stem-like cells from each diseased tissue sample relative to stem-like cells in normal samples in each tissue plotted against the malignancy continuum. Samples are colored based on if they are from different disease stage. |
Top |
Malignant transformation related pathway analysis |
| Find out the enriched GO biological processes and KEGG pathways involved in transition from healthy to precancer to cancer |
| Tissue | Disease Stage | Enriched GO biological Processes |
| Colorectum | AD |  |
| Colorectum | SER |  |
| Colorectum | MSS |  |
| Colorectum | MSI-H |  |
| Colorectum | FAP |  |
| ∗Top 15 enriched GO BP terms are showed in the bar plot of each disease state in each tissue. Each row represents a significant GO biological process which is colored according to the -log10(p.adjust). |
| Page: 1 2 3 4 5 6 7 8 9 |
| GO ID | Tissue | Disease Stage | Description | Gene Ratio | Bg Ratio | pvalue | p.adjust | Count |
| GO:000640321 | Liver | HCC | RNA localization | 151/7958 | 201/18723 | 3.72e-21 | 5.89e-19 | 151 |
| GO:005123621 | Liver | HCC | establishment of RNA localization | 121/7958 | 166/18723 | 1.61e-15 | 1.19e-13 | 121 |
| GO:005065711 | Liver | HCC | nucleic acid transport | 118/7958 | 163/18723 | 8.30e-15 | 5.60e-13 | 118 |
| GO:005065811 | Liver | HCC | RNA transport | 118/7958 | 163/18723 | 8.30e-15 | 5.60e-13 | 118 |
| GO:001593111 | Liver | HCC | nucleobase-containing compound transport | 150/7958 | 222/18723 | 3.17e-14 | 2.03e-12 | 150 |
| GO:005102811 | Liver | HCC | mRNA transport | 97/7958 | 130/18723 | 9.00e-14 | 5.23e-12 | 97 |
| GO:0007059 | Liver | HCC | chromosome segregation | 197/7958 | 346/18723 | 3.57e-08 | 7.87e-07 | 197 |
| Page: 1 |
| Pathway ID | Tissue | Disease Stage | Description | Gene Ratio | Bg Ratio | pvalue | p.adjust | qvalue | Count |
| hsa0501422 | Liver | HCC | Amyotrophic lateral sclerosis | 252/4020 | 364/8465 | 8.85e-18 | 7.41e-16 | 4.12e-16 | 252 |
| hsa03013 | Liver | HCC | Nucleocytoplasmic transport | 81/4020 | 108/8465 | 4.28e-09 | 6.83e-08 | 3.80e-08 | 81 |
| hsa0501432 | Liver | HCC | Amyotrophic lateral sclerosis | 252/4020 | 364/8465 | 8.85e-18 | 7.41e-16 | 4.12e-16 | 252 |
| hsa030131 | Liver | HCC | Nucleocytoplasmic transport | 81/4020 | 108/8465 | 4.28e-09 | 6.83e-08 | 3.80e-08 | 81 |
| Page: 1 |
Top |
Cell-cell communication analysis |
| Identification of potential cell-cell interactions between two cell types and their ligand-receptor pairs for different disease states |
| Ligand | Receptor | LRpair | Pathway | Tissue | Disease Stage |
| Page: 1 |
Top |
Single-cell gene regulatory network inference analysis |
| Find out the significant the regulons (TFs) and the target genes of each regulon across cell types for different disease states |
| TF | Cell Type | Tissue | Disease Stage | Target Gene | RSS | Regulon Activity |
| ∗The dot plots of a searched regulon are shown for all cell subpopulations in each disease state of each tissue based on the regulon specific score inferred using pySCENIC and by calculating the average expression. |
| Page: 1 |
Top |
Somatic mutation of malignant transformation related genes |
| Annotation of somatic variants for genes involved in malignant transformation |
| Hugo Symbol | Variant Class | Variant Classification | dbSNP RS | HGVSc | HGVSp | HGVSp Short | SWISSPROT | BIOTYPE | SIFT | PolyPhen | Tumor Sample Barcode | Tissue | Histology | Sex | Age | Stage | Therapy Types | Drugs | Outcome |
| NUP43 | SNV | Missense_Mutation | c.118N>C | p.Glu40Gln | p.E40Q | Q8NFH3 | protein_coding | tolerated(0.24) | benign(0.053) | TCGA-A2-A0EY-01 | Breast | breast invasive carcinoma | Female | <65 | I/II | Chemotherapy | adriamycin | SD | |
| NUP43 | SNV | Missense_Mutation | rs751766292 | c.872N>T | p.Ala291Val | p.A291V | Q8NFH3 | protein_coding | tolerated(0.13) | benign(0.007) | TCGA-D8-A1J8-01 | Breast | breast invasive carcinoma | Female | >=65 | I/II | Hormone Therapy | nolvadex | SD |
| NUP43 | insertion | Frame_Shift_Ins | novel | c.1062_1063insTTTT | p.Thr355PhefsTer23 | p.T355Ffs*23 | Q8NFH3 | protein_coding | TCGA-A8-A08H-01 | Breast | breast invasive carcinoma | Female | >=65 | I/II | Unknown | Unknown | SD | ||
| NUP43 | insertion | Frame_Shift_Ins | novel | c.1061_1062insTGATATGATCAGAGTAAAGAATTTTGCCATTTTGATC | p.Thr355AspfsTer34 | p.T355Dfs*34 | Q8NFH3 | protein_coding | TCGA-A8-A08H-01 | Breast | breast invasive carcinoma | Female | >=65 | I/II | Unknown | Unknown | SD | ||
| NUP43 | deletion | Frame_Shift_Del | novel | c.882delN | p.Asp294GlufsTer60 | p.D294Efs*60 | Q8NFH3 | protein_coding | TCGA-EW-A2FV-01 | Breast | breast invasive carcinoma | Female | <65 | III/IV | Chemotherapy | docetaxel | SD | ||
| NUP43 | SNV | Missense_Mutation | novel | c.141G>T | p.Trp47Cys | p.W47C | Q8NFH3 | protein_coding | deleterious(0) | probably_damaging(0.989) | TCGA-AA-3941-01 | Colorectum | colon adenocarcinoma | Female | >=65 | I/II | Unknown | Unknown | SD |
| NUP43 | SNV | Missense_Mutation | novel | c.140G>T | p.Trp47Leu | p.W47L | Q8NFH3 | protein_coding | deleterious(0) | probably_damaging(0.927) | TCGA-AA-3941-01 | Colorectum | colon adenocarcinoma | Female | >=65 | I/II | Unknown | Unknown | SD |
| NUP43 | SNV | Missense_Mutation | novel | c.316N>C | p.Asn106His | p.N106H | Q8NFH3 | protein_coding | tolerated(0.1) | possibly_damaging(0.535) | TCGA-AA-3984-01 | Colorectum | colon adenocarcinoma | Female | <65 | I/II | Unknown | Unknown | SD |
| NUP43 | SNV | Missense_Mutation | rs140800369 | c.1016N>A | p.Arg339Gln | p.R339Q | Q8NFH3 | protein_coding | tolerated(0.17) | benign(0.005) | TCGA-AA-A010-01 | Colorectum | colon adenocarcinoma | Female | <65 | I/II | Chemotherapy | folinic | CR |
| NUP43 | SNV | Missense_Mutation | c.378N>A | p.Ser126Arg | p.S126R | Q8NFH3 | protein_coding | deleterious_low_confidence(0.01) | benign(0.063) | TCGA-AH-6544-01 | Colorectum | rectum adenocarcinoma | Male | <65 | III/IV | Chemotherapy | oxaliplatin | SD |
| Page: 1 2 3 4 |
Top |
Related drugs of malignant transformation related genes |
| Identification of chemicals and drugs interact with genes involved in malignant transfromation |
| (DGIdb 4.0) |
| Entrez ID | Symbol | Category | Interaction Types | Drug Claim Name | Drug Name | PMIDs |
| Page: 1 |

Copyright 2023-Present -The University of Texas Health Science Center at Houston |